Download to read offline
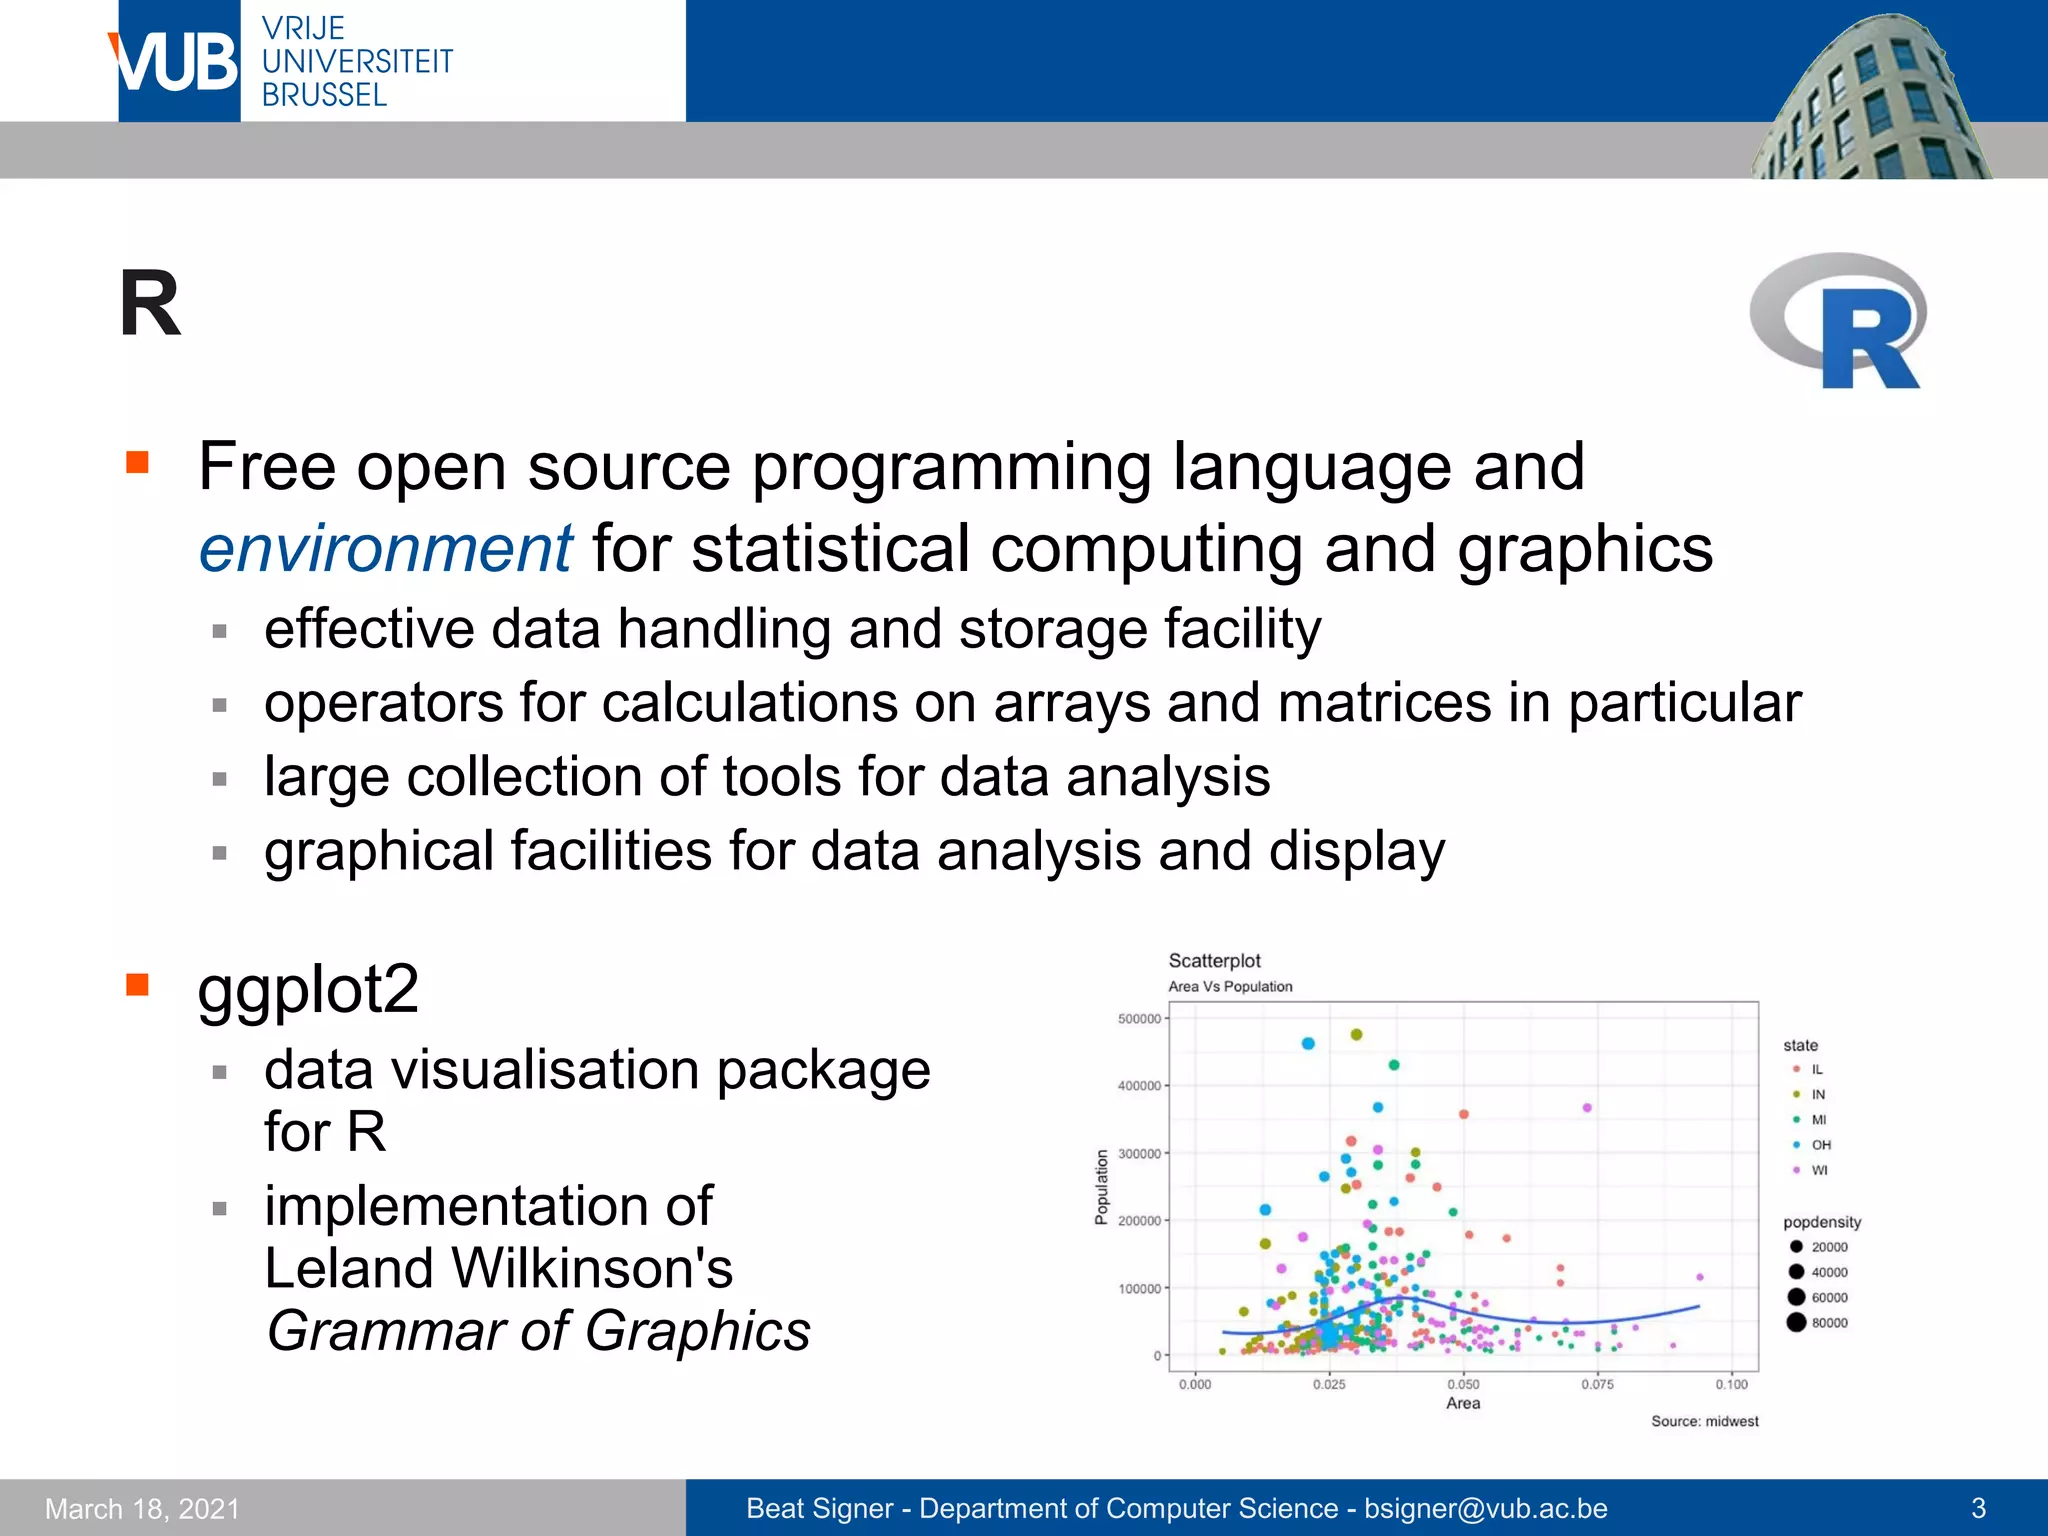
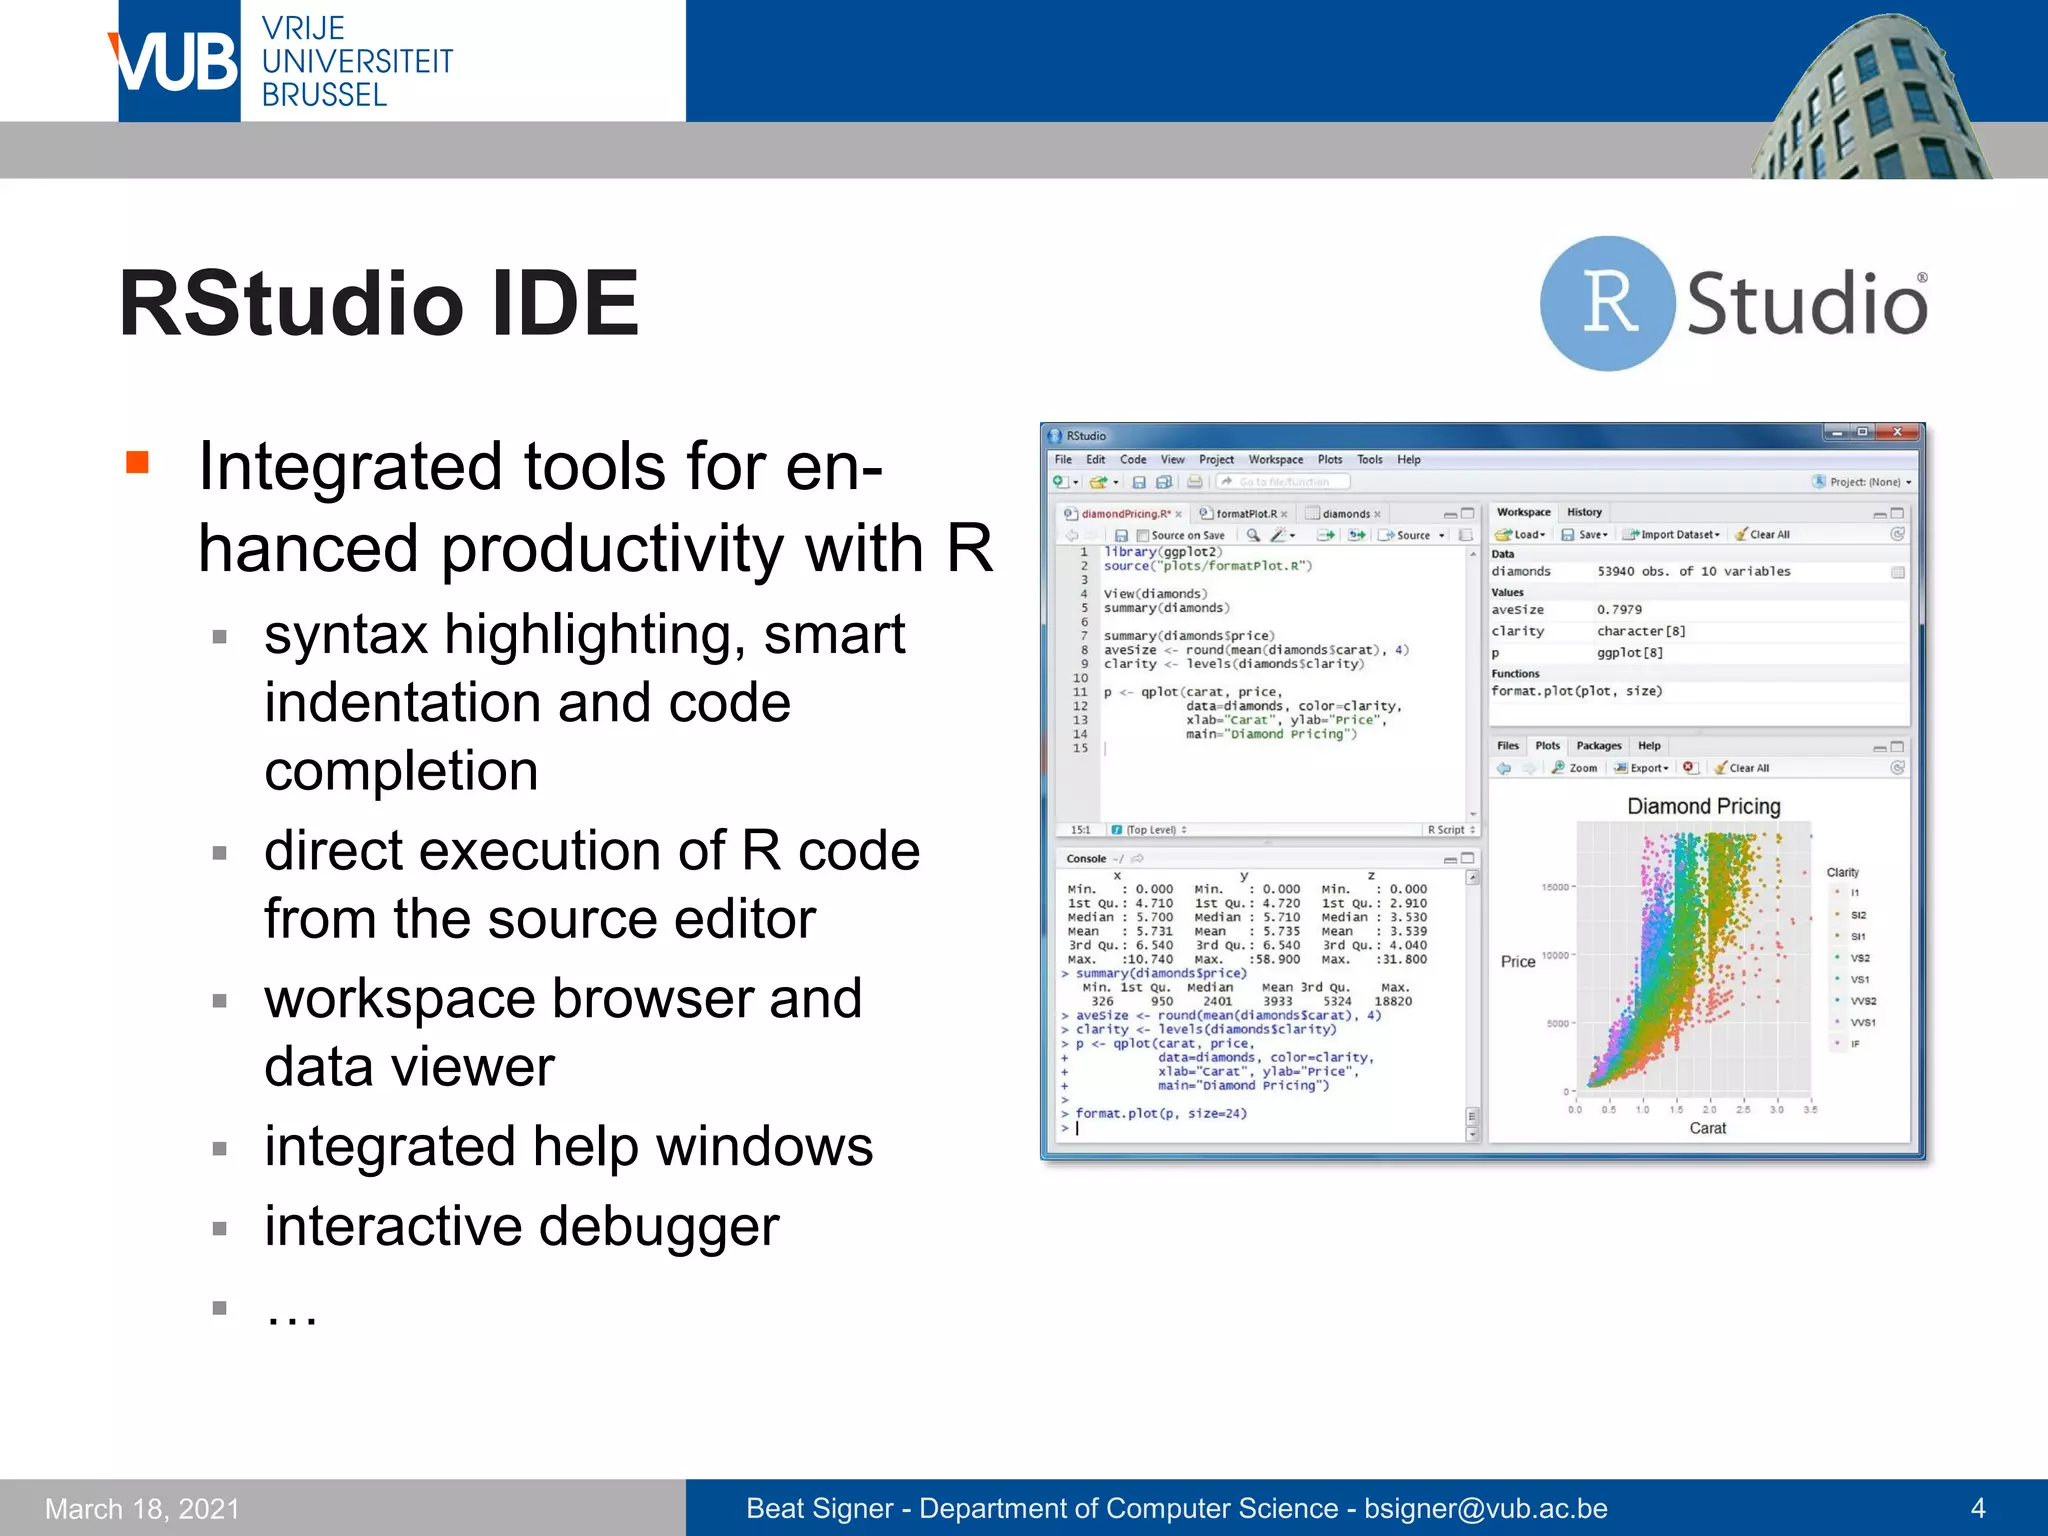
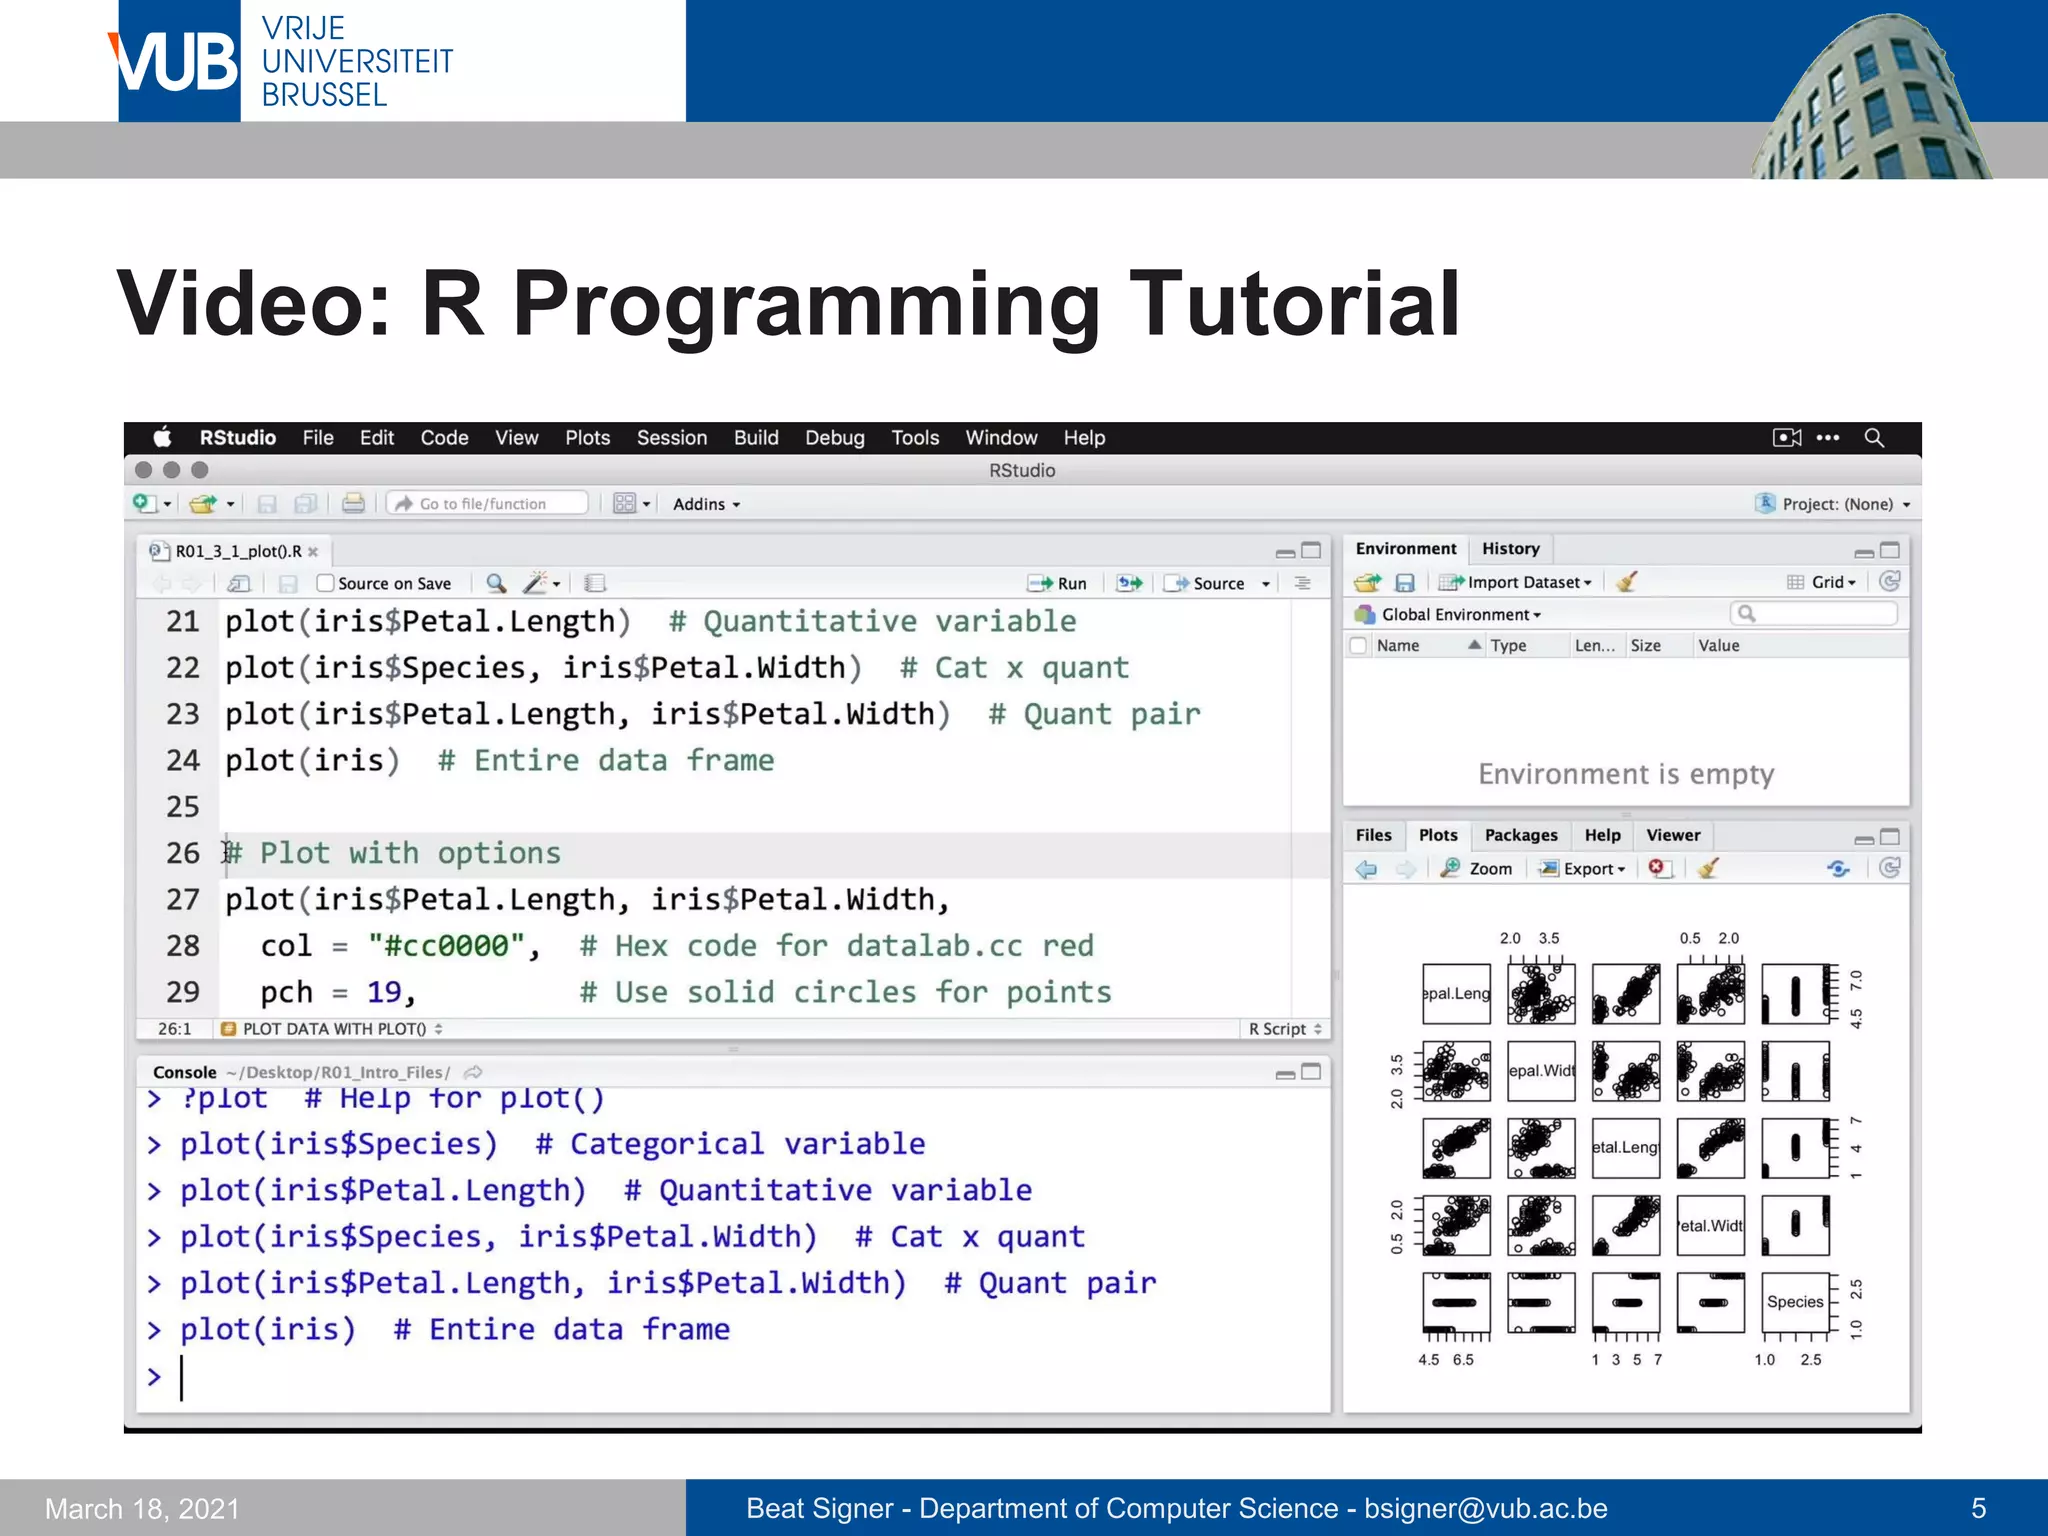
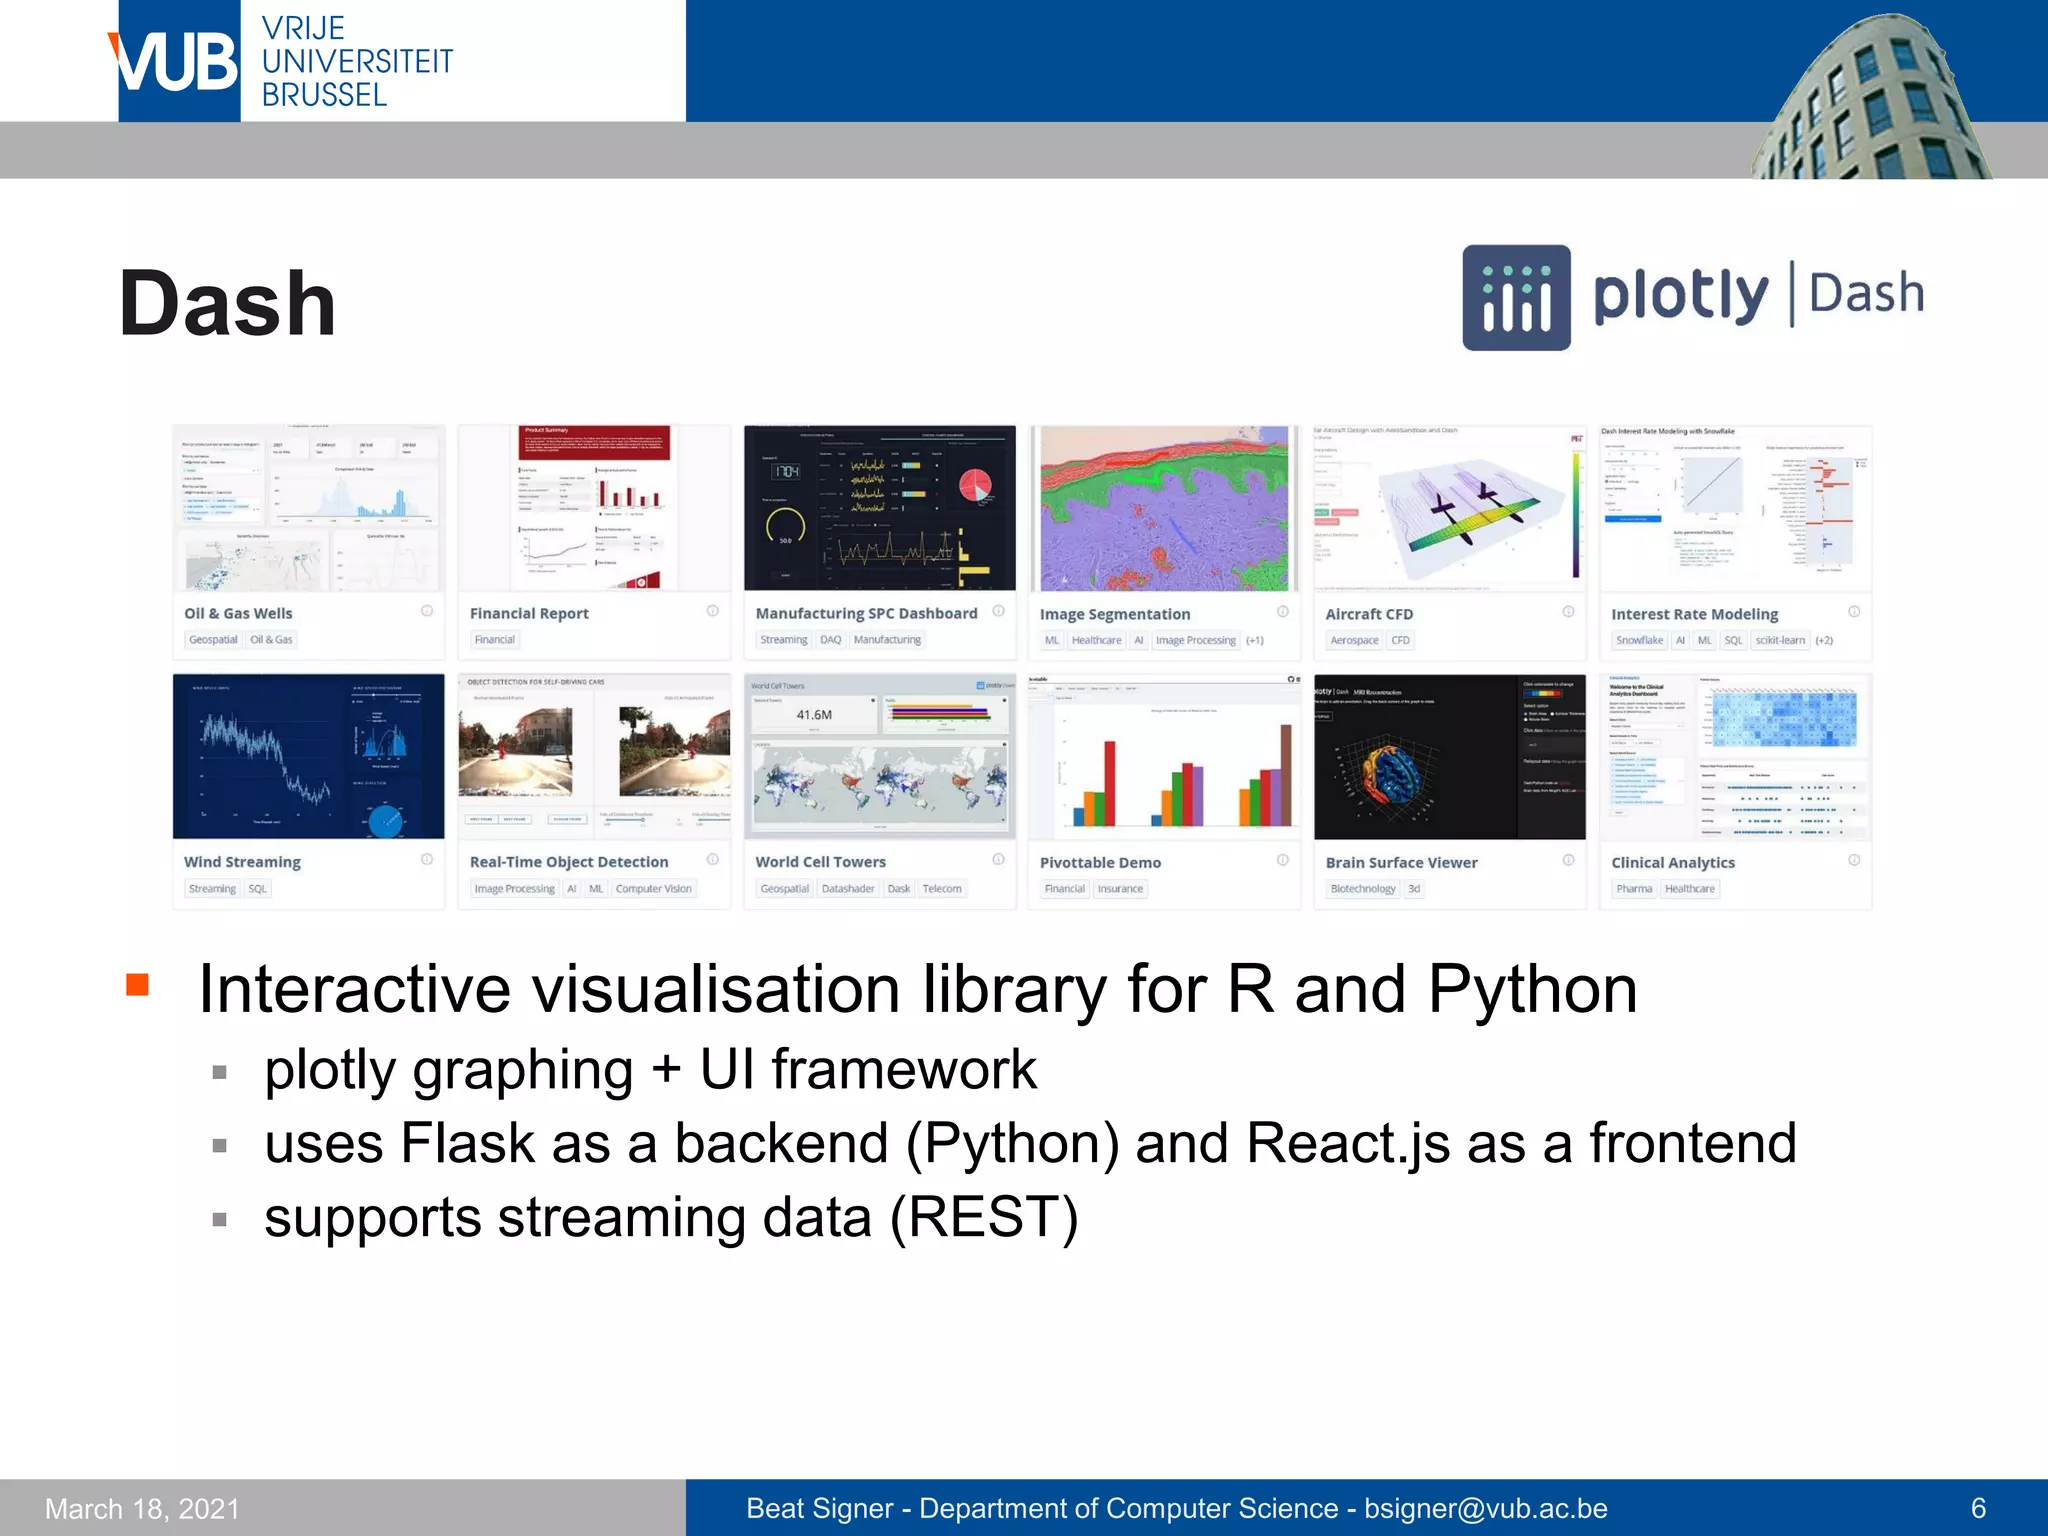
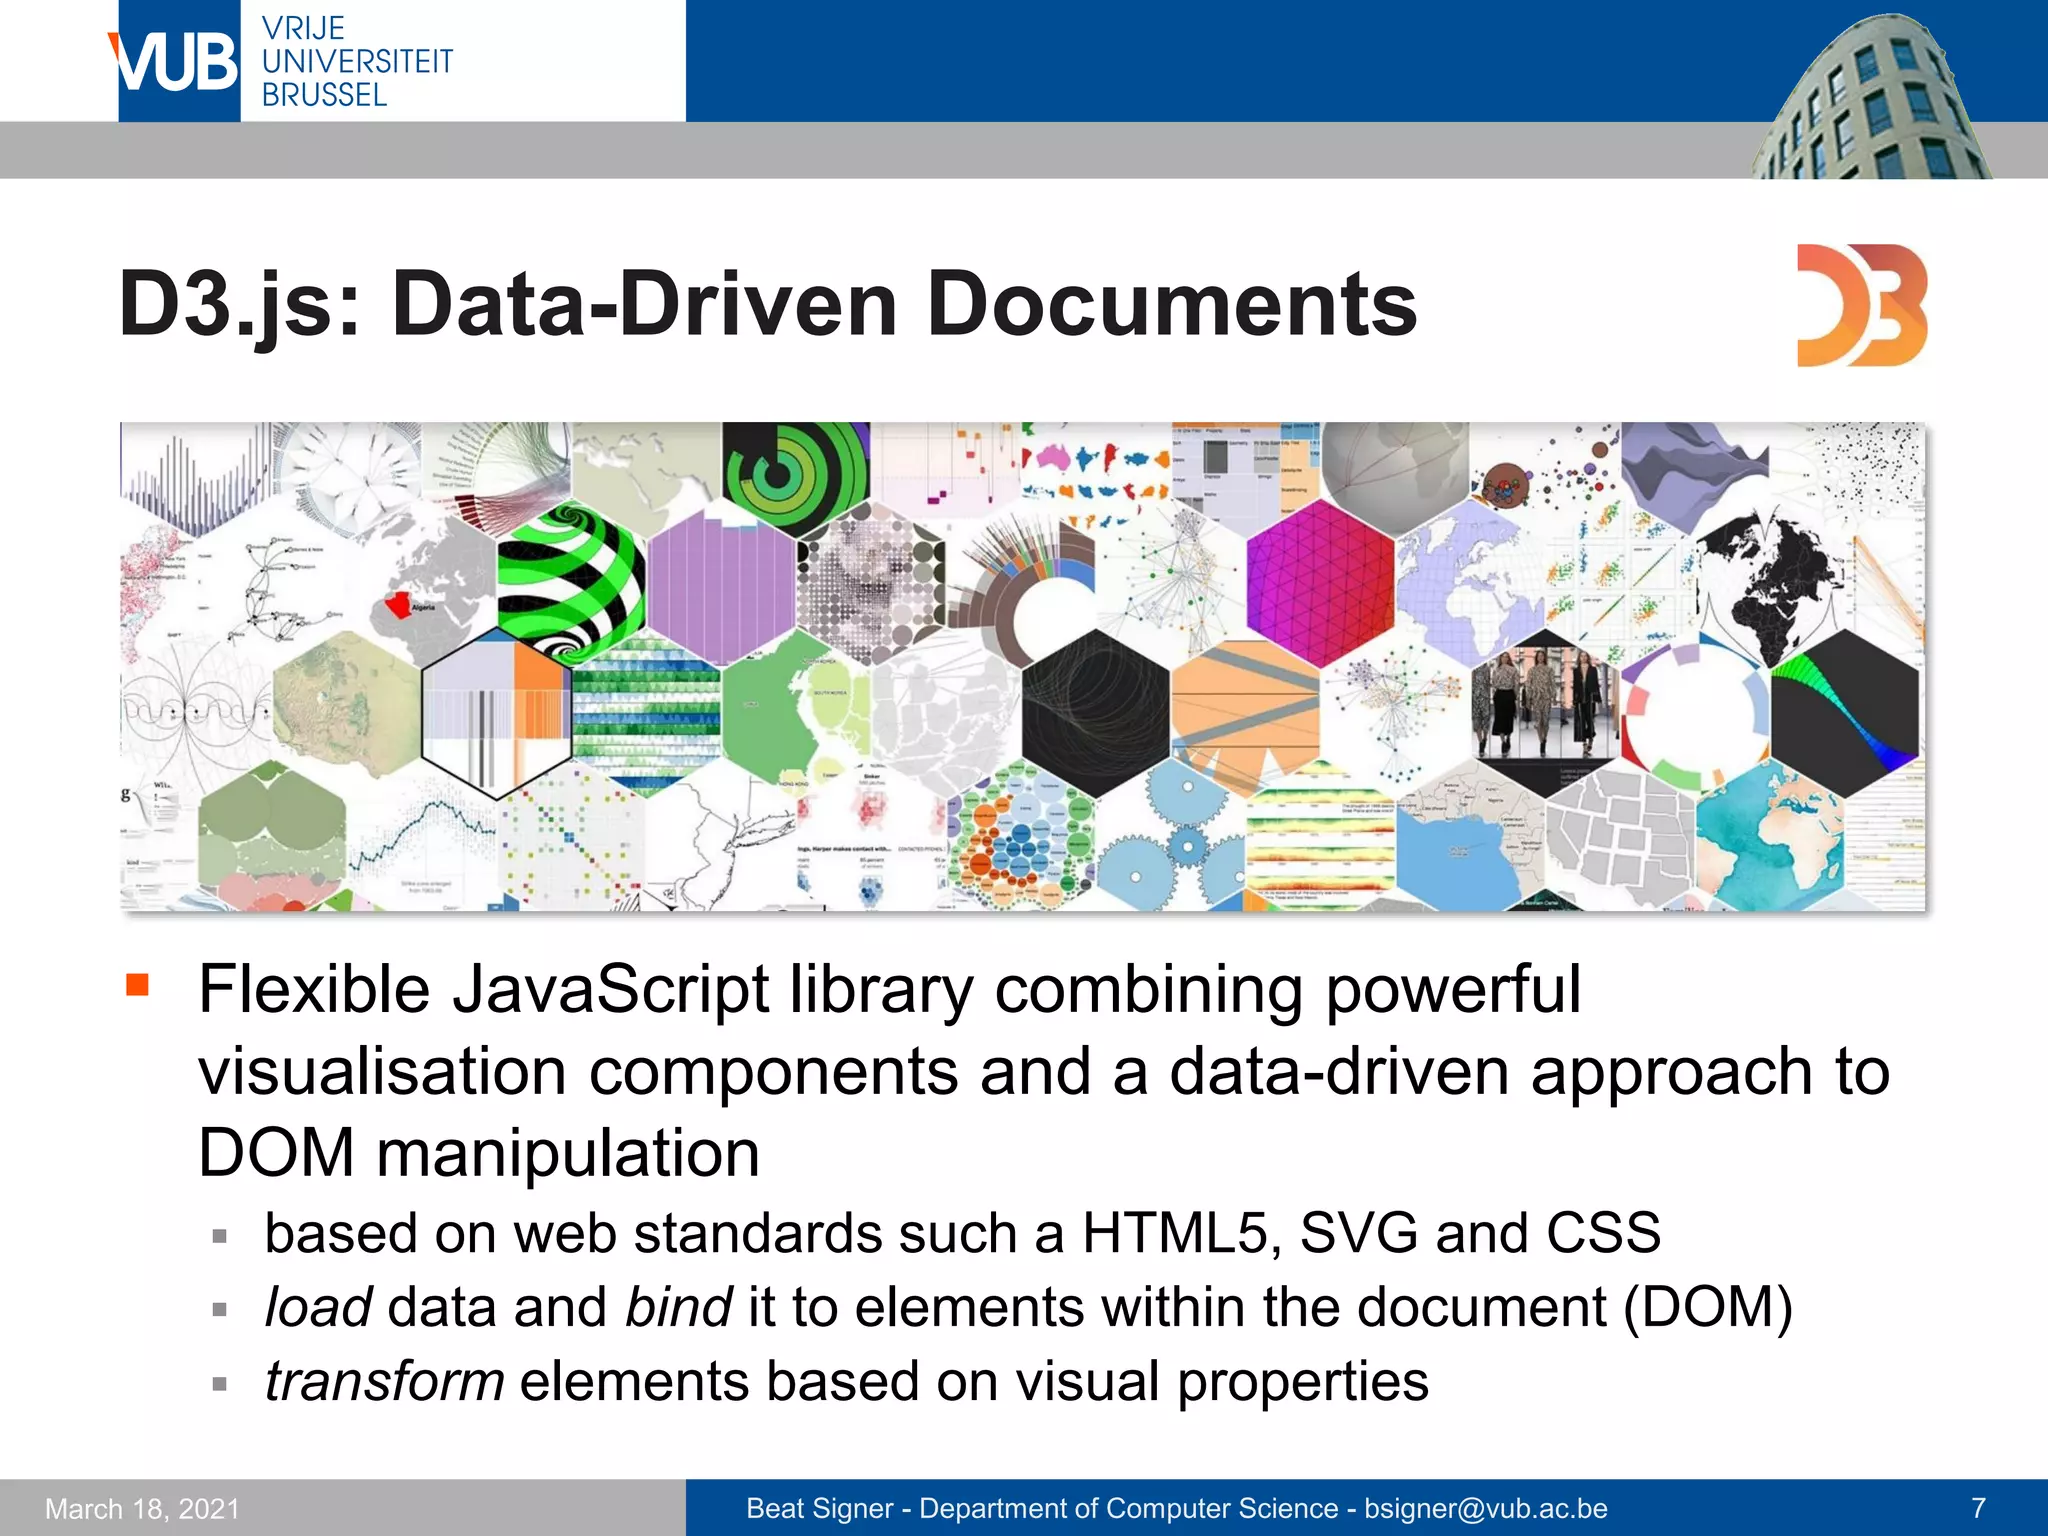
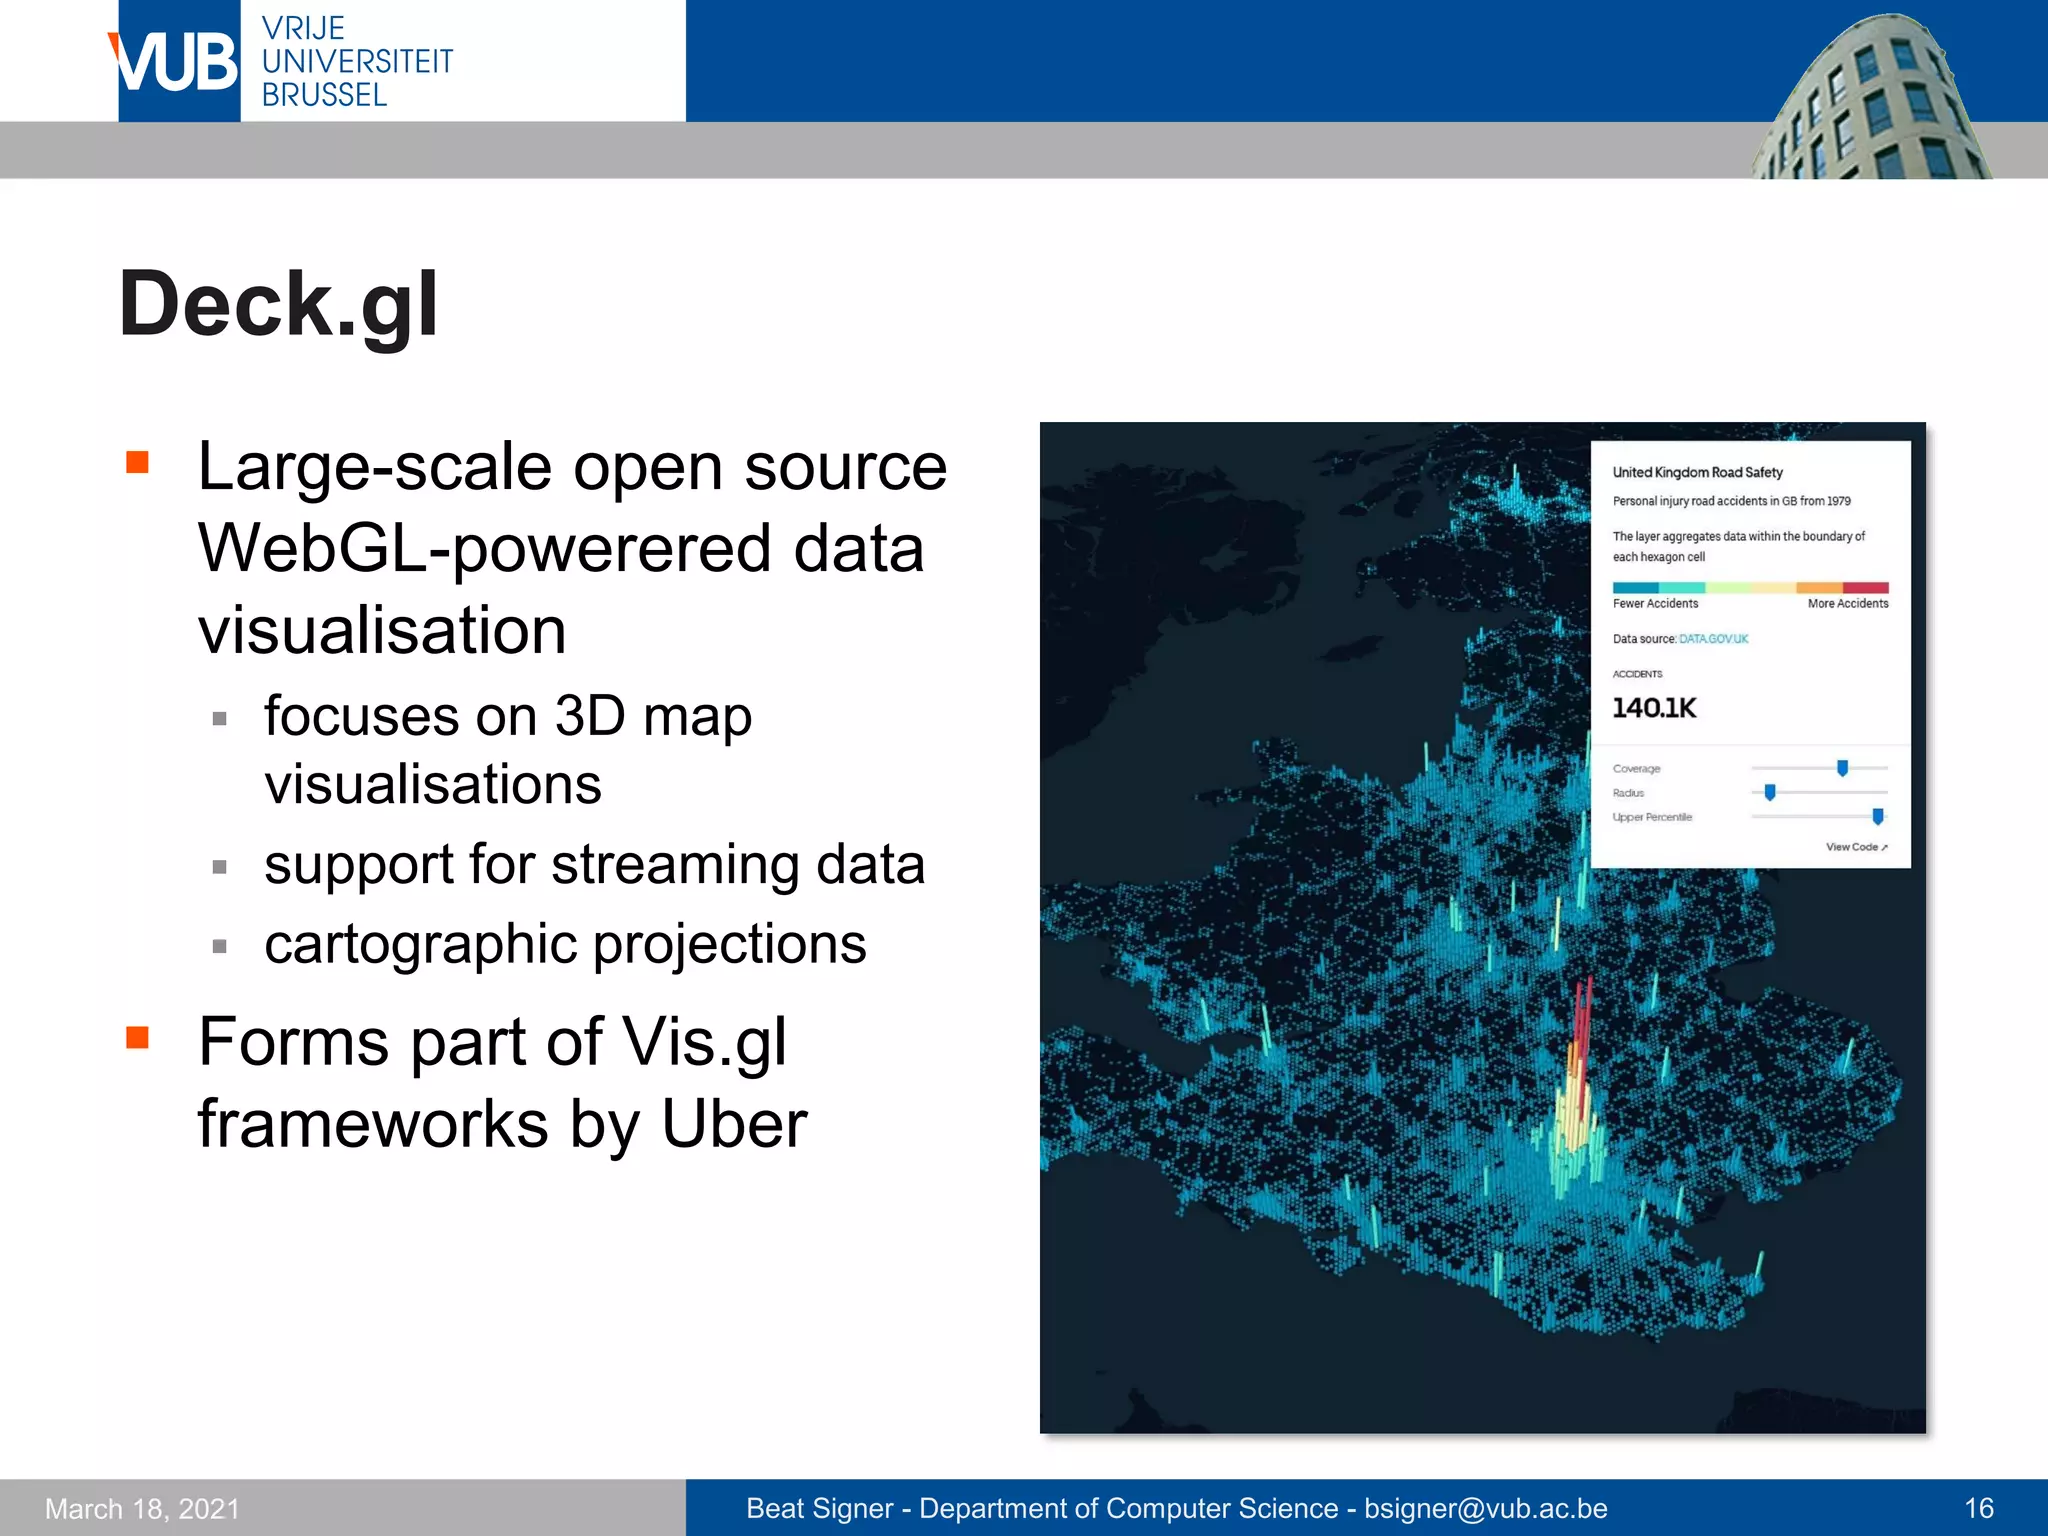
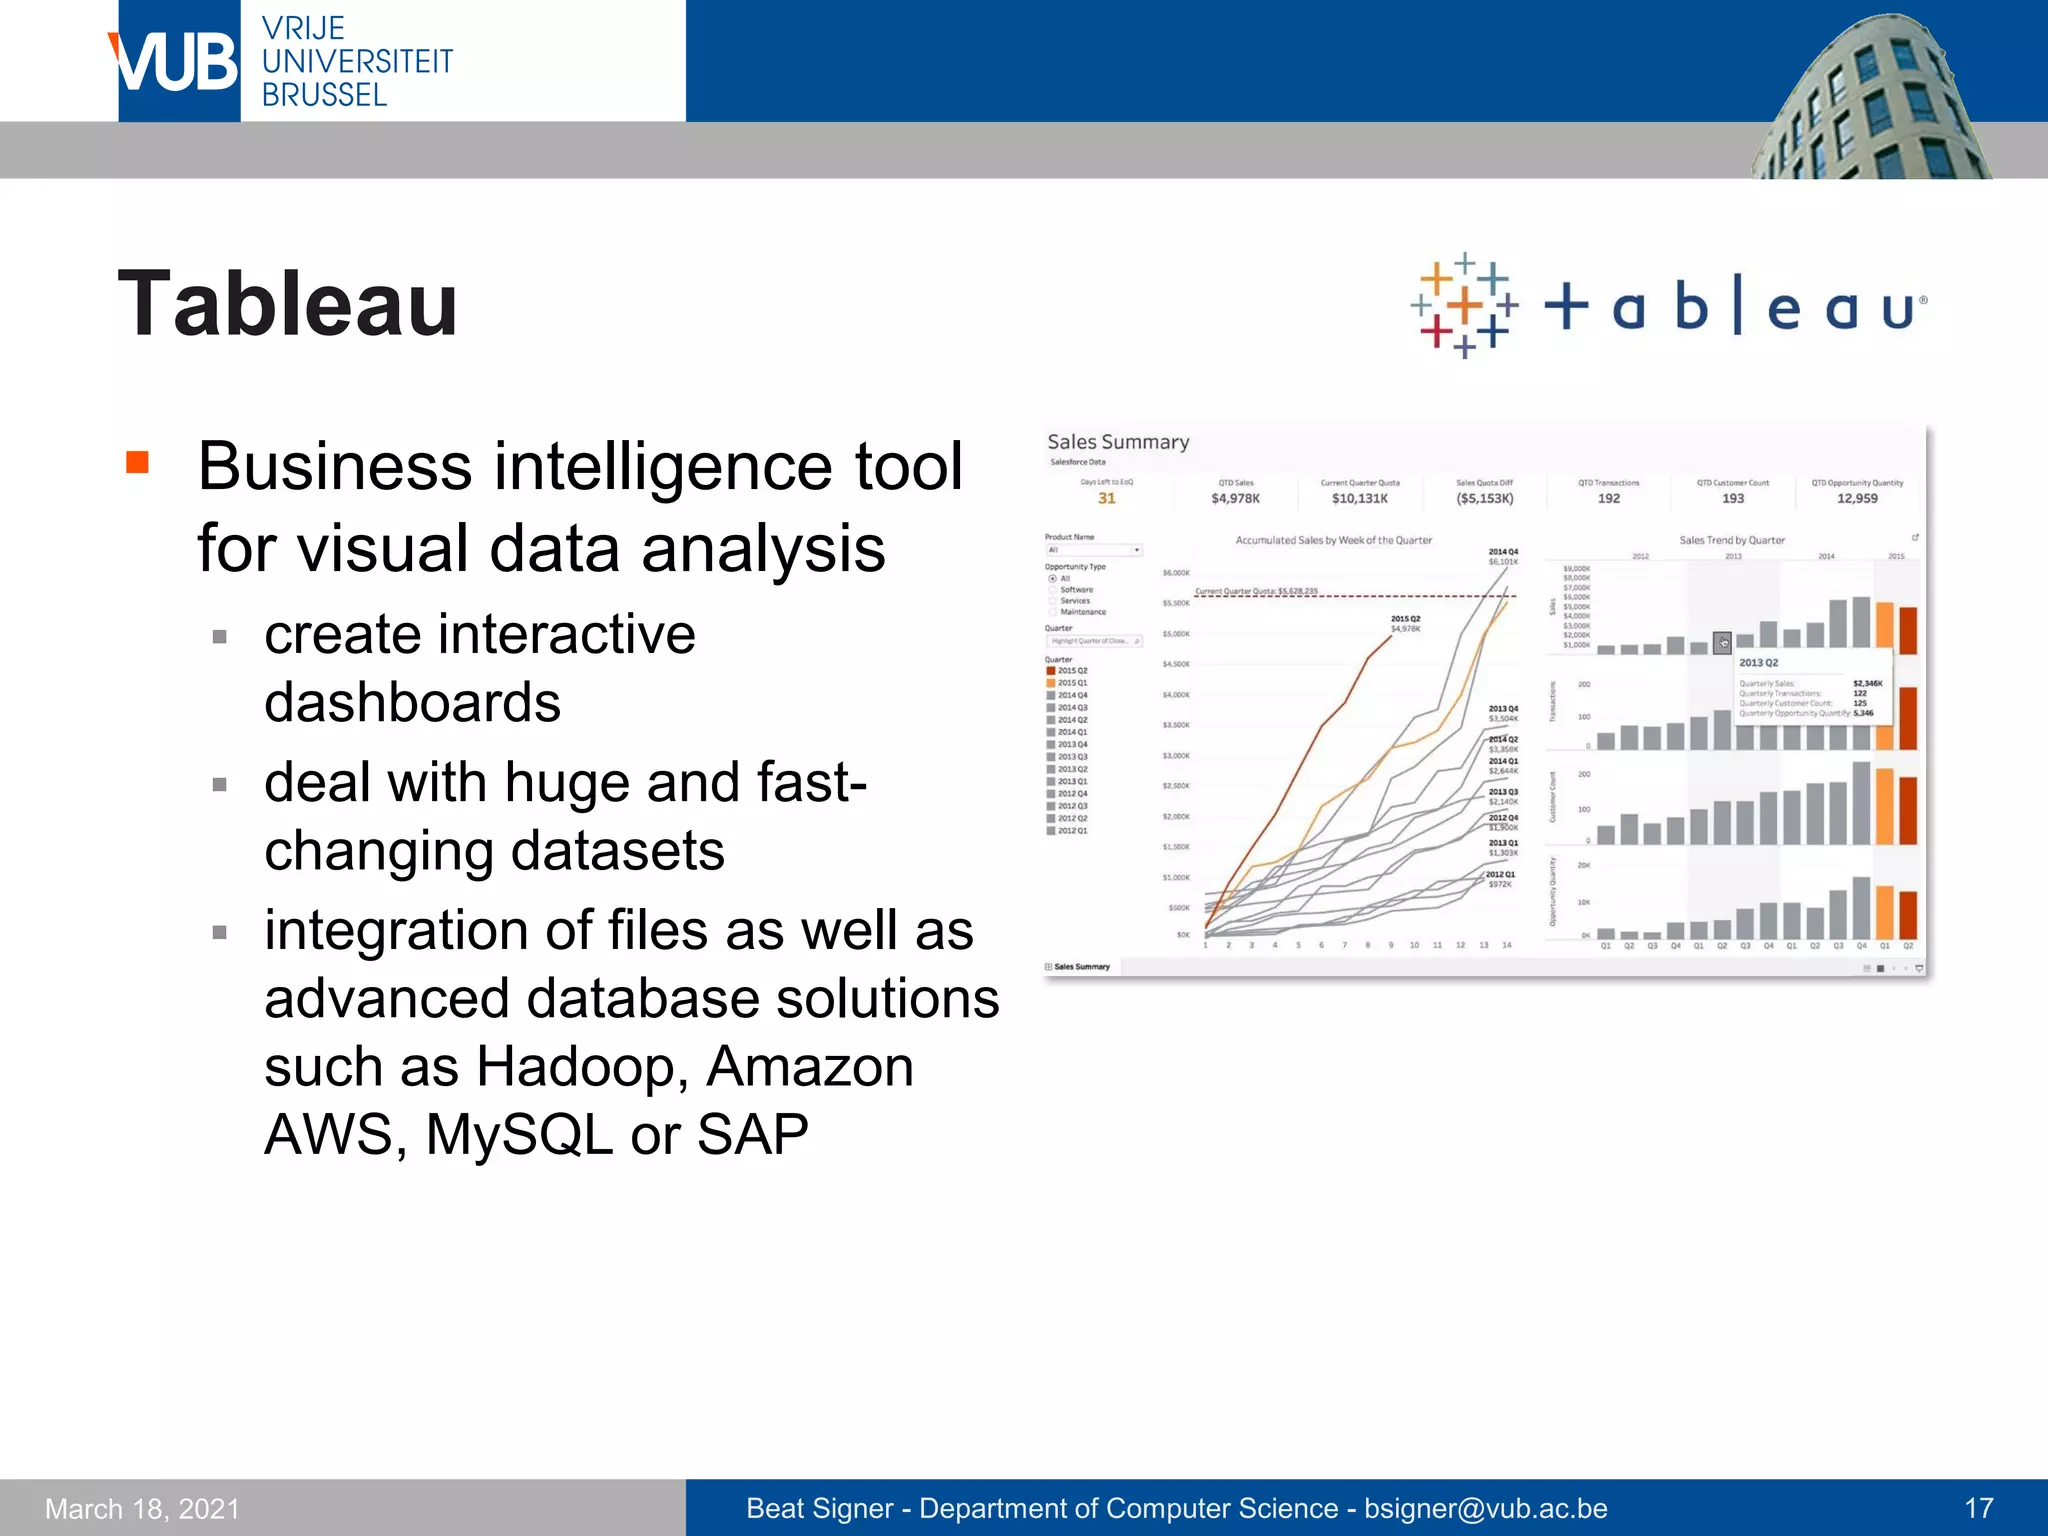
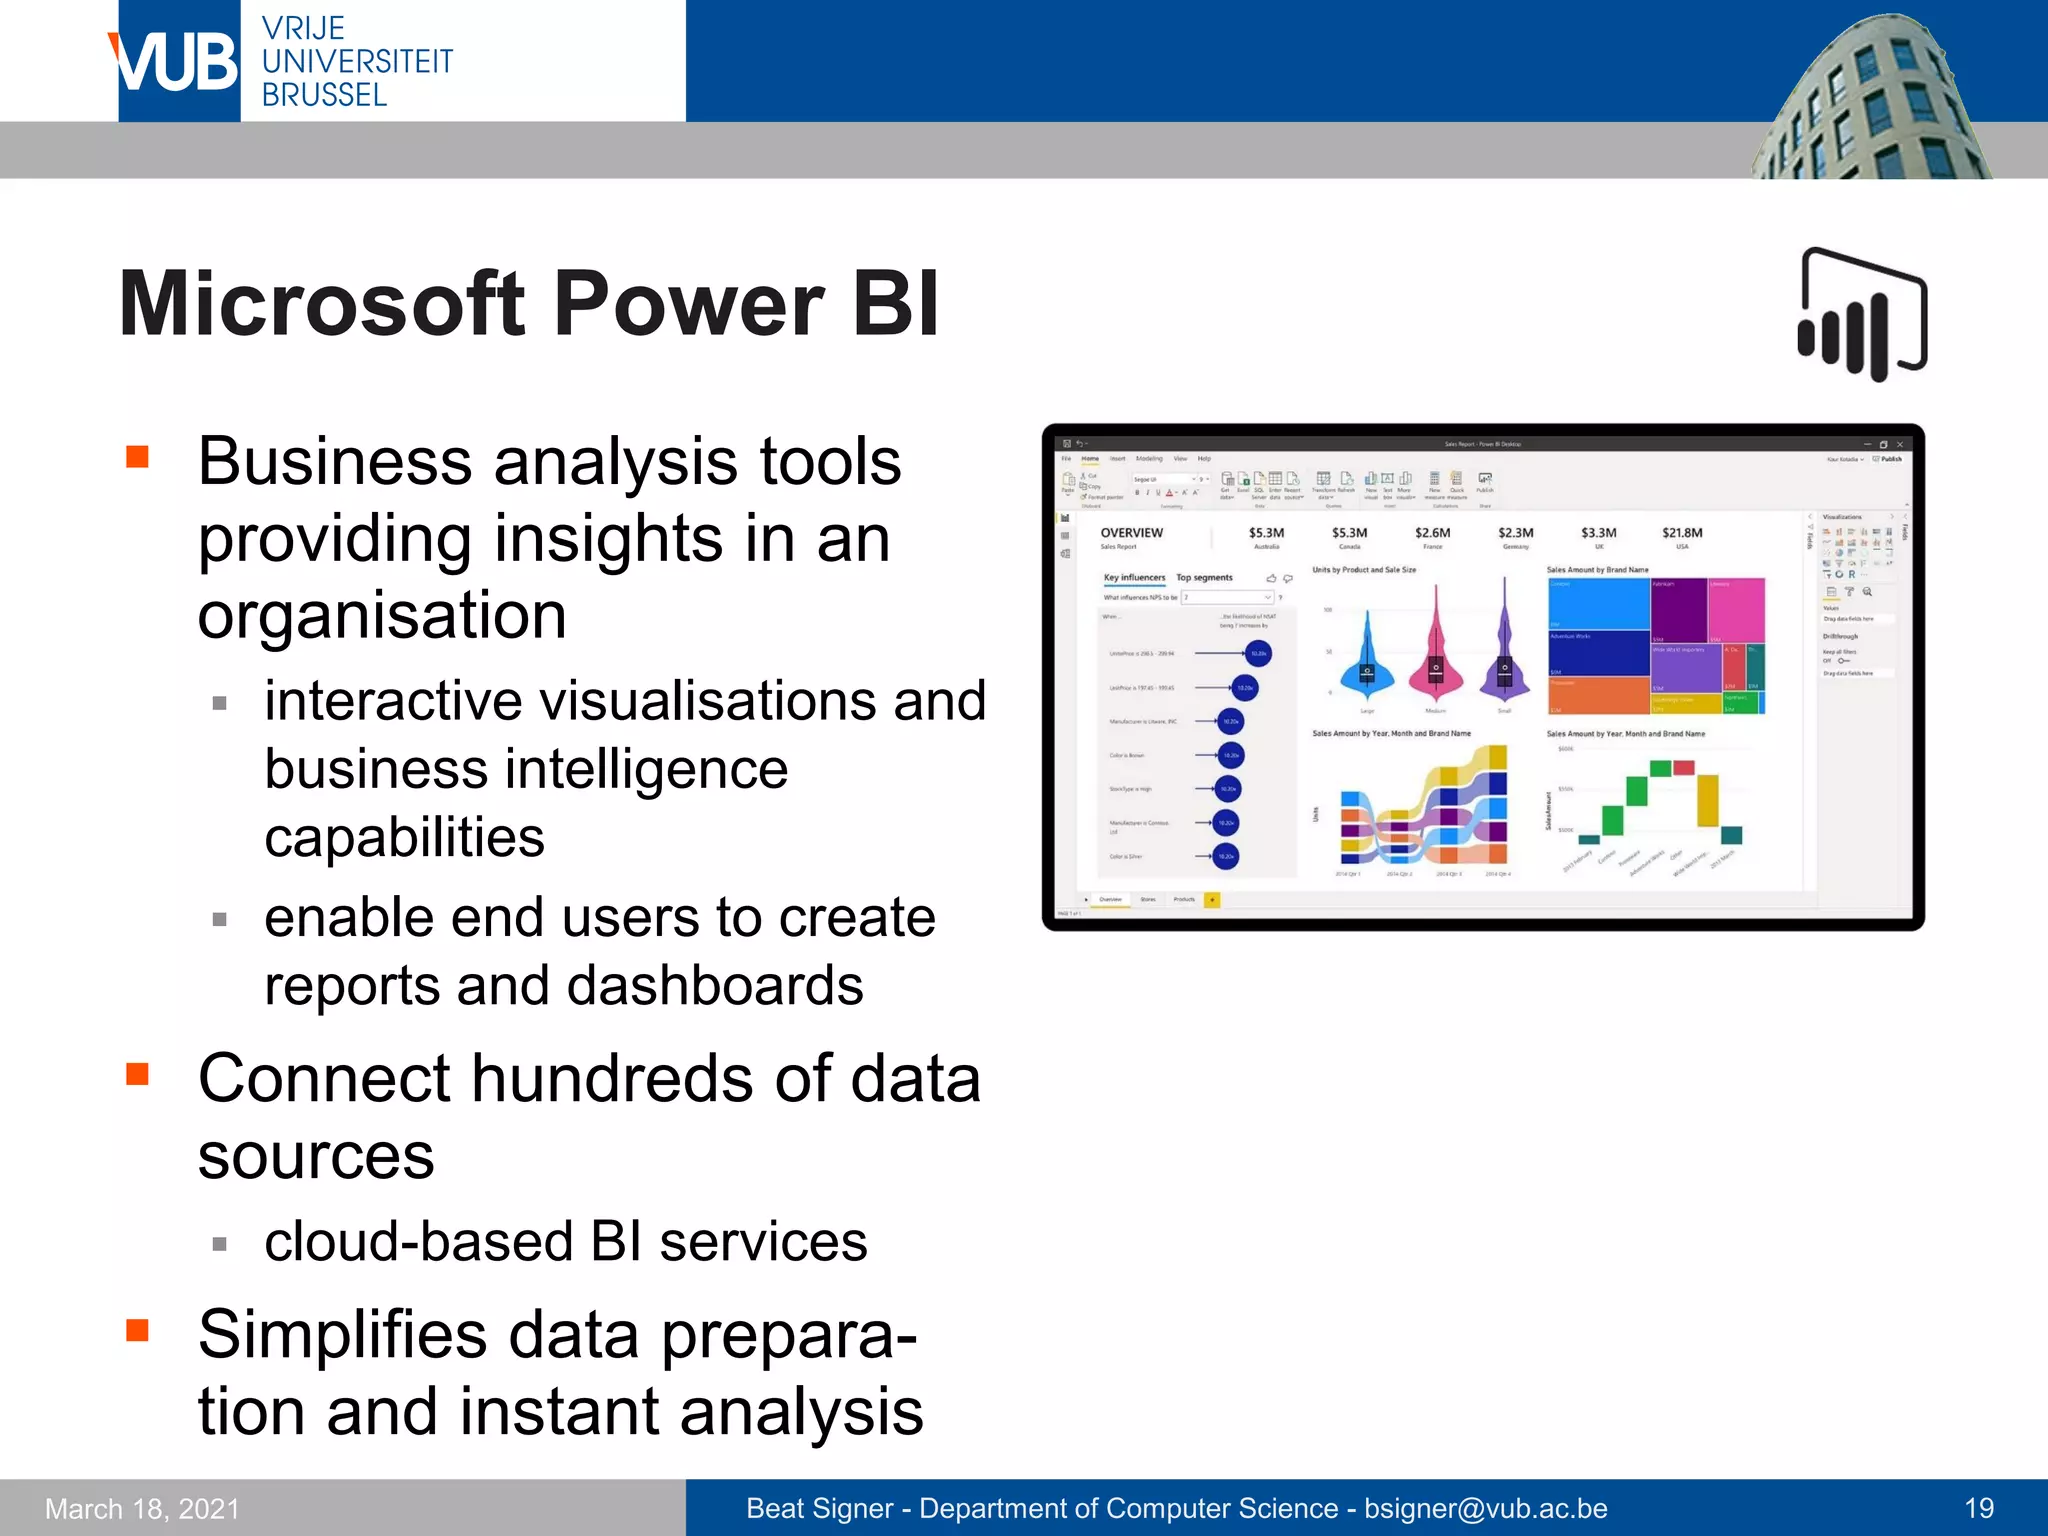


The document discusses various data visualization frameworks and tools used in programming languages such as R and Python for creating visual representations of large datasets. It highlights specific libraries like ggplot2, D3.js, and Dash, along with business intelligence tools like Tableau and Microsoft Power BI. Additionally, it references tutorials and resources for learning these technologies, aiming to assist designers and developers in effective data visualization.