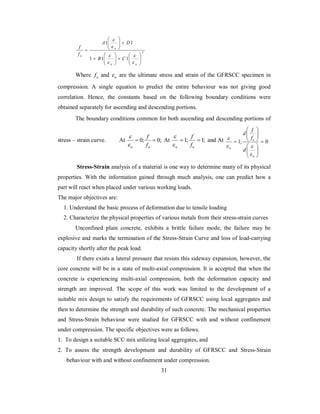
This dissertation by B. Venkataraju examines the stress-strain behavior of high strength glass fiber reinforced self-compacting concrete under axial compression with and without confinement. It includes an analysis of the advantages and characteristics of self-compacting concrete, along with an empirical equation to predict its behavior under compression. The research aims to contribute to the understanding and application of self-compacting concrete, especially in challenging construction environments.

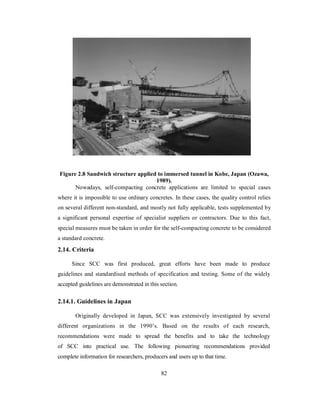
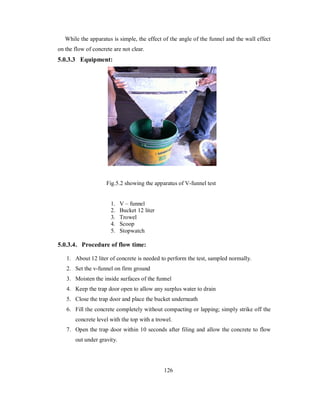
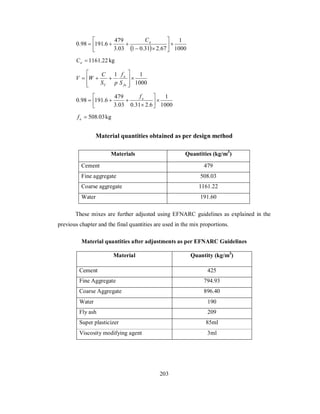
![CHAPTER 2: LITERATURE REVIEW…………………….................................38-86
2.0 General …………………………………...………………….……………………...38
2.1 Previous Research Work on Self-Compacting Concrete ……….…...………………38
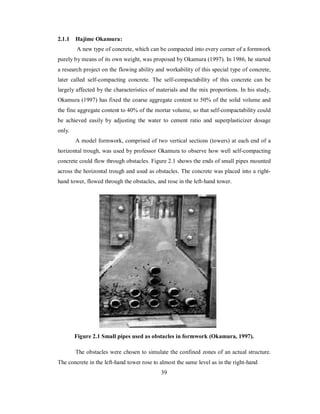
2.1.1 Hajime Okamura ……………………………………..….………………39
2.1.2 Kazumasa Ozawa ……………………………………..…………………41
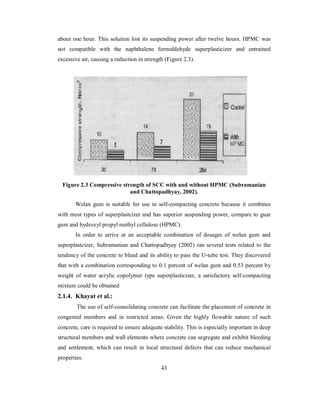
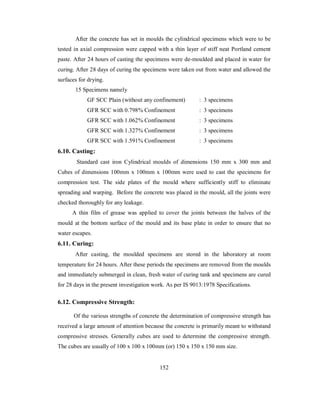
2.1.3 Subramanian and Chattopadhyay ………………………..………………41
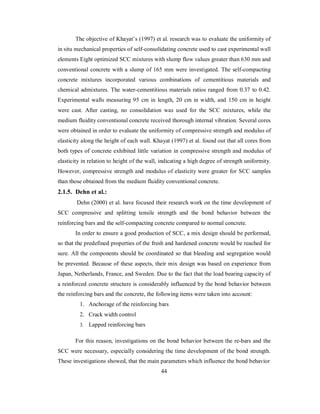
2.1.4. Khayat et al ……………………………………………….……………..43
2.1.5. Dehn et al. ……………………….……………………….……………...44
2.1.6. Kuroiwa ………………………………………………….………………45
2.1.7 Ferraris et al………………………………………………...…………….46
2.1.8 Anirwan Senu Guptha et al[2006] ……………………………………….49
2.1.9. ACI committee report No.226 [1987]…………………………..……......49
2.1.10. Gibbs, [1999] ………………………………………………….…………50
2.1.11. Manu Santhanam,[2008] ……………………………………..……...50
2.1.12. Hemant Sood[3] Et Al, [2009] …………………………………..………50
2.1.13. Kazim Turk[3] Et Al, [2007] ……………………………………...……..50
2.1.14. Srinivasa Rao.P, [2008] ……………………………………………...…..51
2.2 Constituent Materials for SCC ………………………………………………………51
2.2.1. Powder (Mixture of Portland cement and Filler)………………………...51
2.2.1.1 Cement …………………………………………………………..51
2.2.1.2 Filler ……………………………………………………………..52
2.2.2 Aggregates …………………………………………………………………54
2.2.3 Admixtures ………………………………………………………………...56
2.2.4 Ranges of the quantities of the Constituent Materials for SCC …………...57
2.3 Hardened Properties of SCC ………………………………………………………...58
2.3.1 Compressive, Tensile, and Bond Strength ………………………………...58
2.3.2 Modulus of Elasticity ……………………………………………………...59
2.3.3 Shrinkage and Creep ………………………………………………………59
2.3.4. Durability…………………………………………………………………...60
2.3.5 Water Absorption and Initial Surface Absorption ………………………...63
2.3.6 Water Permeability ………………………………………………………..63
2.3.7 Rapid Chloride Permeability ………………………………………………64
ix](https://image.slidesharecdn.com/m-141107032948-conversion-gate02/85/M-tech-thesis-11-320.jpg)

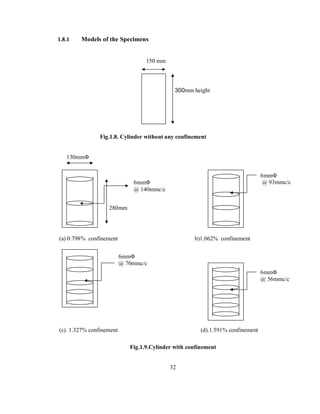

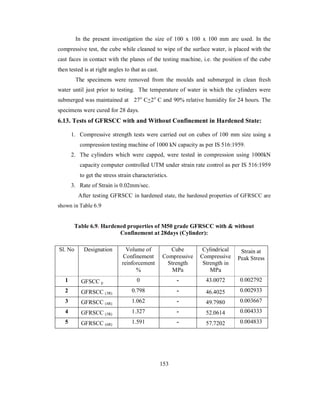
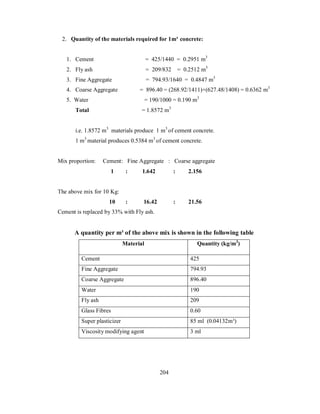
![compacting concrete. Due to the fact, that the values measured with the two types of
rheometers correlate relatively well on viscosity but not on yield stress, further
measurements are needed to determine if the correlation holds for other types of
aggregate and cementitious materials. Also, based on the data acquired, the viscosity and
the yield stress did not correlate with the V-funnel or the U-flow tests.
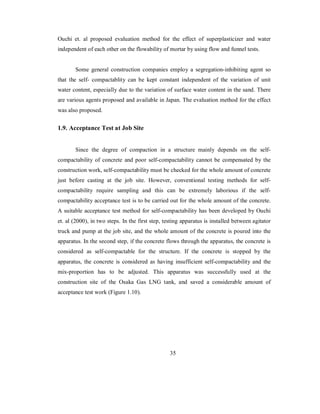
2.1.8 Anirwan Senu Guptha et al [2006]
The authors on the topic “Application based mix proportioning for self
compacting concrete” in their investigation attempted to arrive at optimum mix
proportions for various consistency class of SCC with locally available materials.
Adequate passing ability for all mixes was ensured by keeping the proportion of coarse
aggregates low as the aggregates had high degree of flakiness and elongation. Based on
the investigation they concluded that,
1. Six different consistency classes of SCC as per EFNARC-2005 were produced in
the laboratory using local available materials. All mixes satisfied the criteria set
forth by EFNARC, and showed good passing ability and segregation resistance.
2. Higher powder contents were needed to design SCC high flow combined with
stability. The high powder content mixtures also resulted in the highest
compressive strengths.
3. A good correlation was found in the initial V-Funnel flow time and the T-60 from
slump flow test.
2.1.9. ACI committee report No.226 [1987]
Has discussed the effects of Fly ash. The effect on the workability depends on the
fineness of Fly ash. The fineness and roundness of particles improve cohesion and
workability. Due to workability, there will be reduction in susceptibility of segregation
and bleeding which reduces temperature developed during curing in fresh concrete and
reduces permeability in the hardened concrete. This reduction reduces the damage of steel
corrosion, alkaline sulphite attack. The reports also discussed the specification for
material testing, quality assurance for Fly ash concrete and making use of good
proportion of Fly ash.
49](https://image.slidesharecdn.com/m-141107032948-conversion-gate02/85/M-tech-thesis-74-320.jpg)
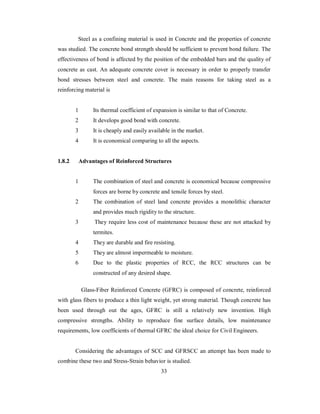
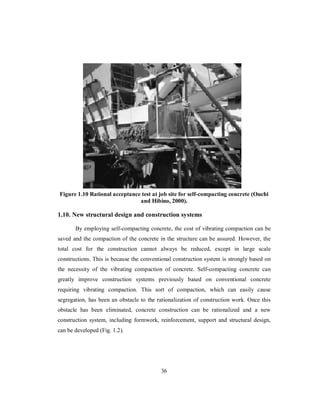
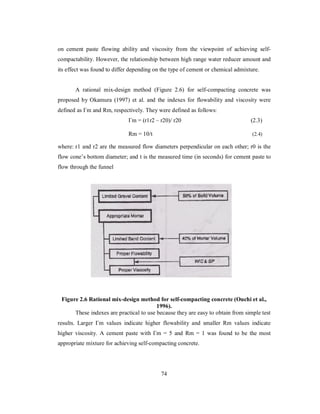
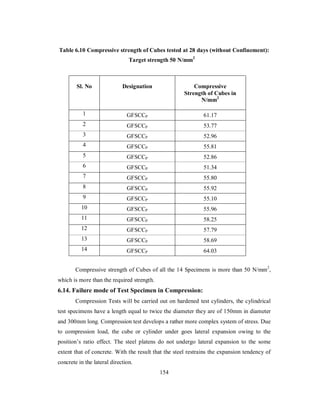
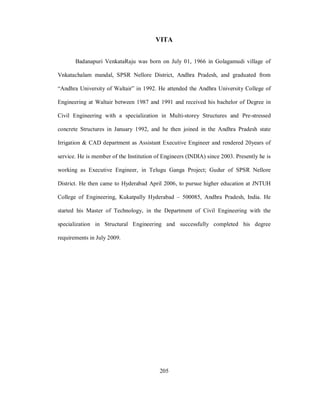
![2.1.10. Gibbs,[1999]
States that the following practical rules of thumb for the proportioning of self-compacting
concrete mixture exits. Coarse aggregate content should be limited to 71-81
N/mm3 (about 50% of the total volume)
1. 50% of the total volume.
2. Paste not less than 40% of the volume of the mixture.
3. Low sand content in the mortar (40-50% by volume).
4. Water/powder ratio not more than 0.5 (powder solids 0.0035 in 0.09mm).
2.1.11. Manu Santhanam,[2008]
In his article “Compatability issues between Cements and Water-reducing
Chemical admixtures”, describes the current level of knowledge world wide about the
issues of incompatibility cement and water-reducing chemical admixtures. Their
mechanism of action in concrete, test methods to evaluate the effectiveness of
plasticizers. Specific issues of incompatibility namely, loss of workability, alteration of
setting behaviour,reduced rates of strength gain, and change in long term behaviour and
role of the chemistry(of cement and admixture),the presence of other mineral and
chemical admixtures, and the proportioning of concrete are explained in detail.
2.1.12. Hemant Sood[3] Et Al, [2009]
In their experimental investigation “Incorporating European Standards for Testing
Self Compacting Concrete in Indian Conditions”, explained SCC using Fly ash and Rice
husk ash as mineral admixtures and testing rheological properties as per European
standards. He concluded that addition of Fly ash in SCC increases filling and passing
ability of concrete and improves overall workability, which is the prime important
characteristics of SCC.Utilisation of Fly ash and Rice husk as cement replacement avoids
the environmental and ecological damages caused by quarrying and exploitation of raw
materials like limestone for making cement.
2.1.13. Kazim Turk[3] Et Al, [2007]
In their experimental study “Capillarity water absorption of Concrete under
different Curing Conditions”, explains the influence of puzzolonic materials and curing
regimes on the mechanical properties and the Capillarity water absorption(sorptivity)
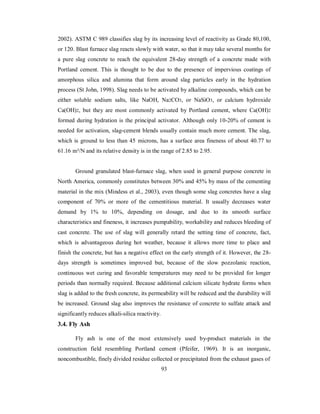
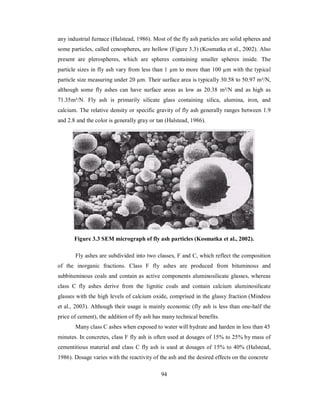
50](https://image.slidesharecdn.com/m-141107032948-conversion-gate02/85/M-tech-thesis-75-320.jpg)
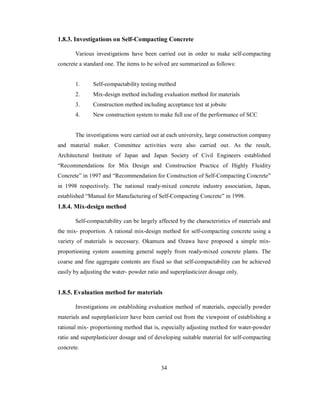
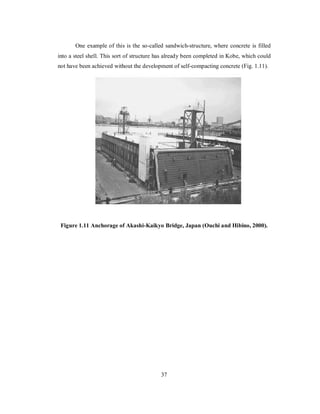
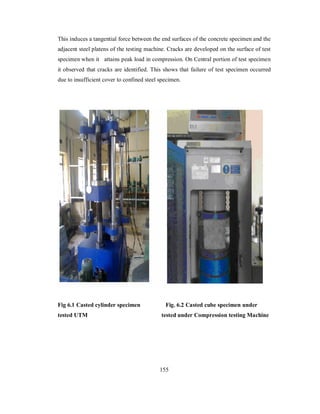
![Characteristics of Self Compacting concrete (SCC).He concluded that the Compressive
and tensile strengths of Self Compacting concrete were higher than those of PC concrete
for all testing ages and for all curing conditions and also proper curing and using
puzzolonic admixture such as Fly ash as cement component enhanced the resistivity of
concretes under water absorption significantly..
2.1.14. Srinivasa Rao.P, [2008]
In his paper “Strength properties of Glass Fibre Self Compacting concrete”
studied the properties of GFSCC using alkali-resistant glass fibres in various proportions
and compared the properties for controlled mixes of grade M30 and M35. He concluded
that there is an improvement in the compressive strength for both grades of GFSCC and is
observed to be 15% over Self-Compacted Concrete.
2.2. Constituent Materials of SCC
The constituent materials used for the production of SCC are the same as those for
conventionally vibrated normal concrete except that SCC contains lesser aggregate and
greater powder (cement and filler particles smaller than 0.125 mm). Fly ash, glass filler,
limestone powder, silica fume, etc are used as the filler materials. To improve the self-compactibility,
without segregation, a superplasticizer along with a stabilizer is added.
2.2.1. Powder (Mixture of Portland cement and Filler)
The term 'powder' used in SCC refers to a blended mix of cement and filler
particles smaller than 0.125 mm. The filler increases the paste volume required to achieve
the desirable workability of SCC. The addition of filler in an appropriate quantity
enhances both workability and durability without sacrificing early strength (Mata, 2004).
2.2.1.1 Cement
Cement used for SCC should not contain C3A content higher than 10% to avoid
the problems of poor workability retention (EFNARC, 2002). Selection of the type of
cement depends on the overall requirements for concrete, such as strength and durability.
51](https://image.slidesharecdn.com/m-141107032948-conversion-gate02/85/M-tech-thesis-76-320.jpg)
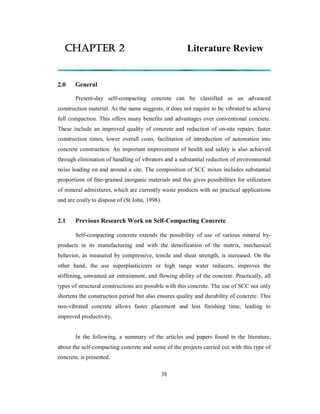
![3.8.1. The effect of fibres on workability
Fibres affect the characteristics of SCC in the fresh state. They are needle-like
particles that increase the resistance to flow and contribute to an internal structure in the
fresh state. Steel fibre reinforced concrete is stiffer than conventional concrete. In order to
optimize the performance of the single fibres, fibres need to be homogeneously
distributed; clustering of fibres has to be avoided. The effect of fibres on workability is
mainly due to four reasons First, the shape of the fibres is more elongated than the
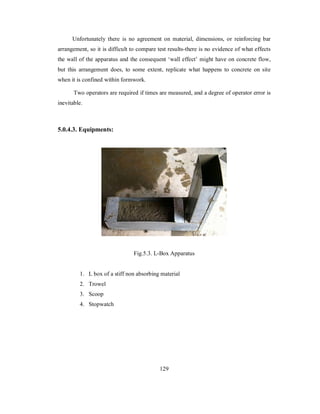
aggregates, the surface area at the same volume is higher. Second, stiff fibres change the
structure of the granular skeleton, whereas flexible fibres fill the space between them.
Stiff fibres push apart particles that are relatively large compared to the fibre length,
which increases the porosity of the granular skeleton. Third, the surface characteristics of
fibres differ from that of cement and aggregates, e.g. plastic fibres might be hydrophilic
or hydrophobic. Finally, steel fibres often are deformed (i.e. have hooked ends or are
wave-shaped) to improve the anchorage between them and the surrounding matrix. The
size of the fibres relative to the aggregates determines their distribution. To be effective in
the hardened state it is recommended to choose fibres not shorter than the maximum
aggregate size [Johnston, 1996; Vandewalle,1993]. Usually, the fibre length is 2-4 times
that of the maximum aggregate size.
3.8.2. Maximum fibre content
The maximum fibre content, at which a self-compacting concrete can be
produced, depends on the fibre type, the mixture composition, the mixing process and the
characteristics of the concrete in the fresh state. For plain concrete, the compaction
technique also affects this parameter. In order to determine the maximum fibre content of
SCFRC, different series of mixtures were tested and the fibre content was increased in
steps of 20 kg/m³. The ‘maximum fibre content’ is defined to be the highest possible
amount of steel fibres, which can be added to SCC. SCFRC is self-compacting below this
fibre content. The following criteria were applied to determine the maximum fibre
content a slump flow of at least 600 mm and a homogenous distribution of SCC and
fibres along the flow (slump flow test).
101](https://image.slidesharecdn.com/m-141107032948-conversion-gate02/85/M-tech-thesis-127-320.jpg)
![3. High strength concrete
4. Light weight concrete
It is an appropriate quantity may be added to improve the quality and durability of SCC.
4.0.3.2.4. Chemical Admixtures:
A ‘Chemical admixture’ is any chemical additive to the concrete mixture that
enhances the properties of the concrete in the fresh or hardened state. ACI-116R [2000]
defines the term admixture as ‘a material other than water, aggregates, hydraulic cement,
used as an ingredient of concrete or mortar, and added to the batch immediately before or
during its mixing’.
A number of types of Chemical admixtures are used for concrete. The general
purpose chemicals include those that reduce water demand for a given workability(‘water
reducers’),those entraining air in the concrete for providing resistance to freezing and
thawing action(‘air entrainers’),and those chemicals that control the setting time and
strength gain rate of concrete(‘accelerators’ and ‘retarders’).Apart from these chemicals,
there are others for special purposes-namely, Viscosity Modifying Agents, Shrinkage
Reducing Chemicals, Corrosion inhibiting admixtures, and alkali-silica reaction
mitigating admixtures.
A ‘water reducing chemical’, as the name implies, is used to reduce the water
content of a concrete mixture while maintaining a constant workability. The resultant
effect of the reduced water content is the increased strength and durability of concrete.
However, water reducers may also be employed to ‘plasticize’ the concrete,i.e.make
concrete flowable.In this case, the water content(or water to cement ratio)is held constant,
and the addition of the admixtures makes the concrete flow better, while the compressive
strength(which is a function of water to cement ratio),is not affected. Another use of
water reducers is to low the amount of cement (since water is proportionally reduced)
without affecting both strength and workability. This makes the concrete cheaper and
environmentally friendly, as less cement is consumed.
108](https://image.slidesharecdn.com/m-141107032948-conversion-gate02/85/M-tech-thesis-135-320.jpg)


![MTech Seminar Presentation [IIT-Bombay]](https://cdn.slidesharecdn.com/ss_thumbnails/seminar-presentation-final-140502111554-phpapp02-thumbnail.jpg?width=640&height=640&fit=bounds)


![Behaviour of frp confined normal and high strength concrete [autosaved]](https://cdn.slidesharecdn.com/ss_thumbnails/behaviouroffrp-confinednormalandhighstrengthconcreteautosaved-140303104936-phpapp01-thumbnail.jpg?width=640&height=640&fit=bounds)


![Self_compacting_concrete_with_metakaolin[1].pptx](https://cdn.slidesharecdn.com/ss_thumbnails/selfcompactingconcretewithmetakaolin1-221228060813-0eb26699-thumbnail.jpg?width=640&height=640&fit=bounds)


