Downloaded 167 times

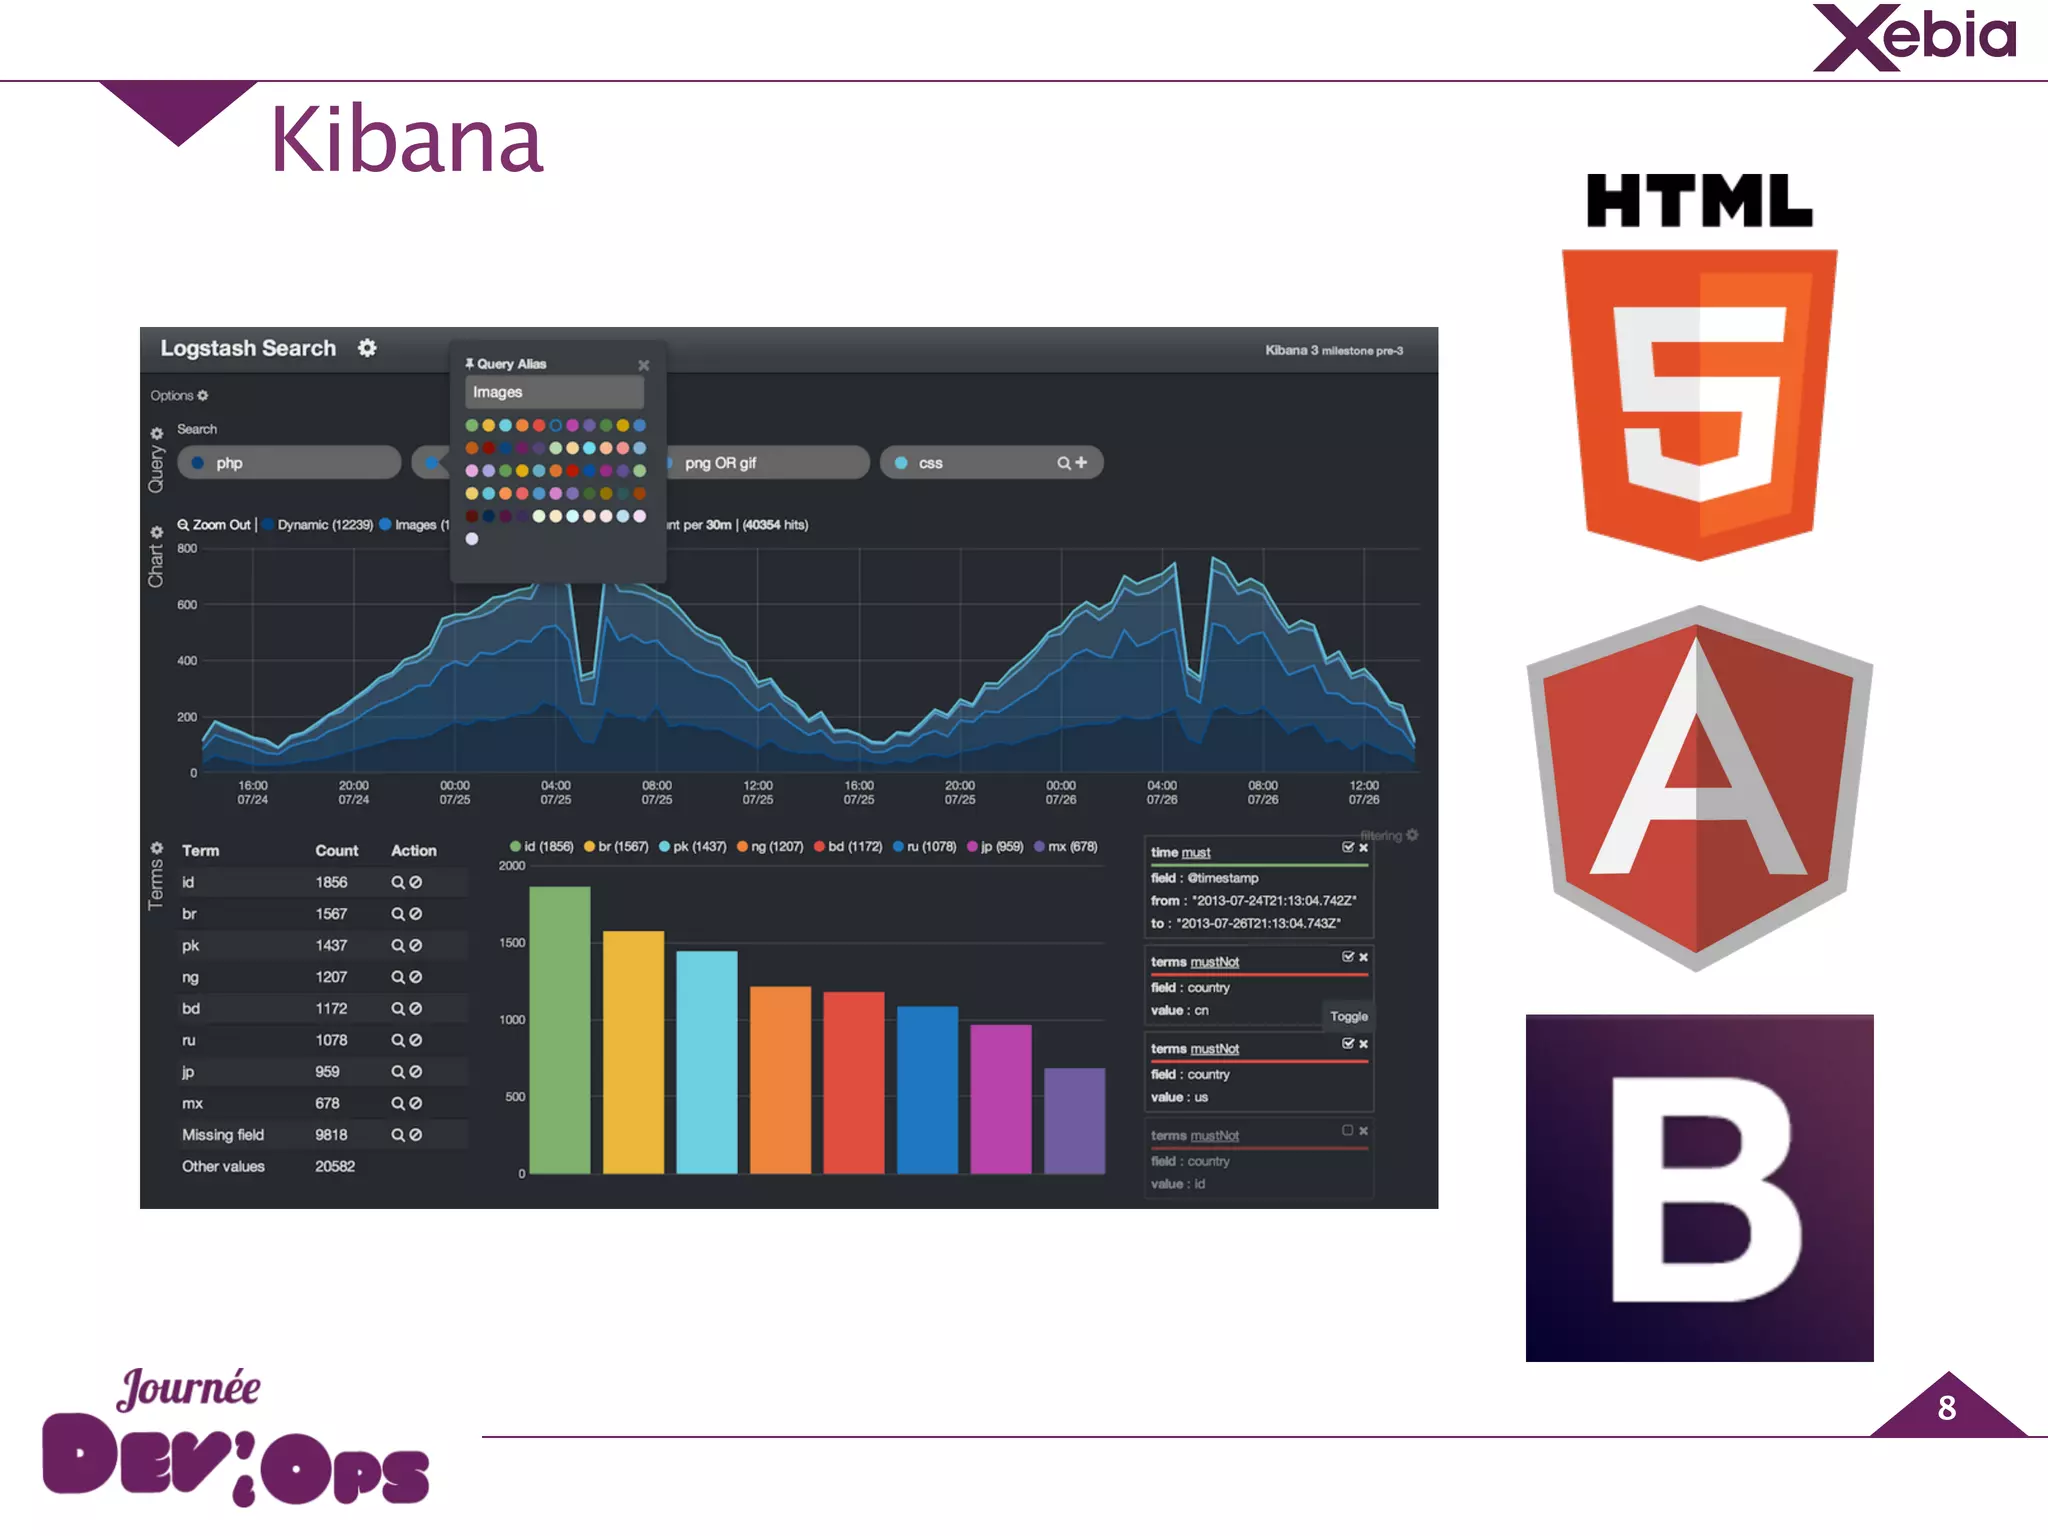
![Logstash - Patterns
14
USERNAME [a-zA-Z0-9._-]+!
USER %{USERNAME}!
INT (?:[+-]?(?:[0-9]+))!
WORD bw+b!
NOTSPACE S+!
DATA .*?!
GREEDYDATA .*!
HTTPDATE %{MONTHDAY}/%{MONTH}/%{YEAR}:%{TIME} %{INT}!
COMBINEDAPACHELOG %{IPORHOST:clientip} …
https://github.com/logstash/logstash/blob/master/patterns](https://image.slidesharecdn.com/devopsday-140625064622-phpapp02/75/Journee-DevOps-Des-dashboards-pour-tous-avec-ElasticSearch-Logstash-et-Kibana-14-2048.jpg)
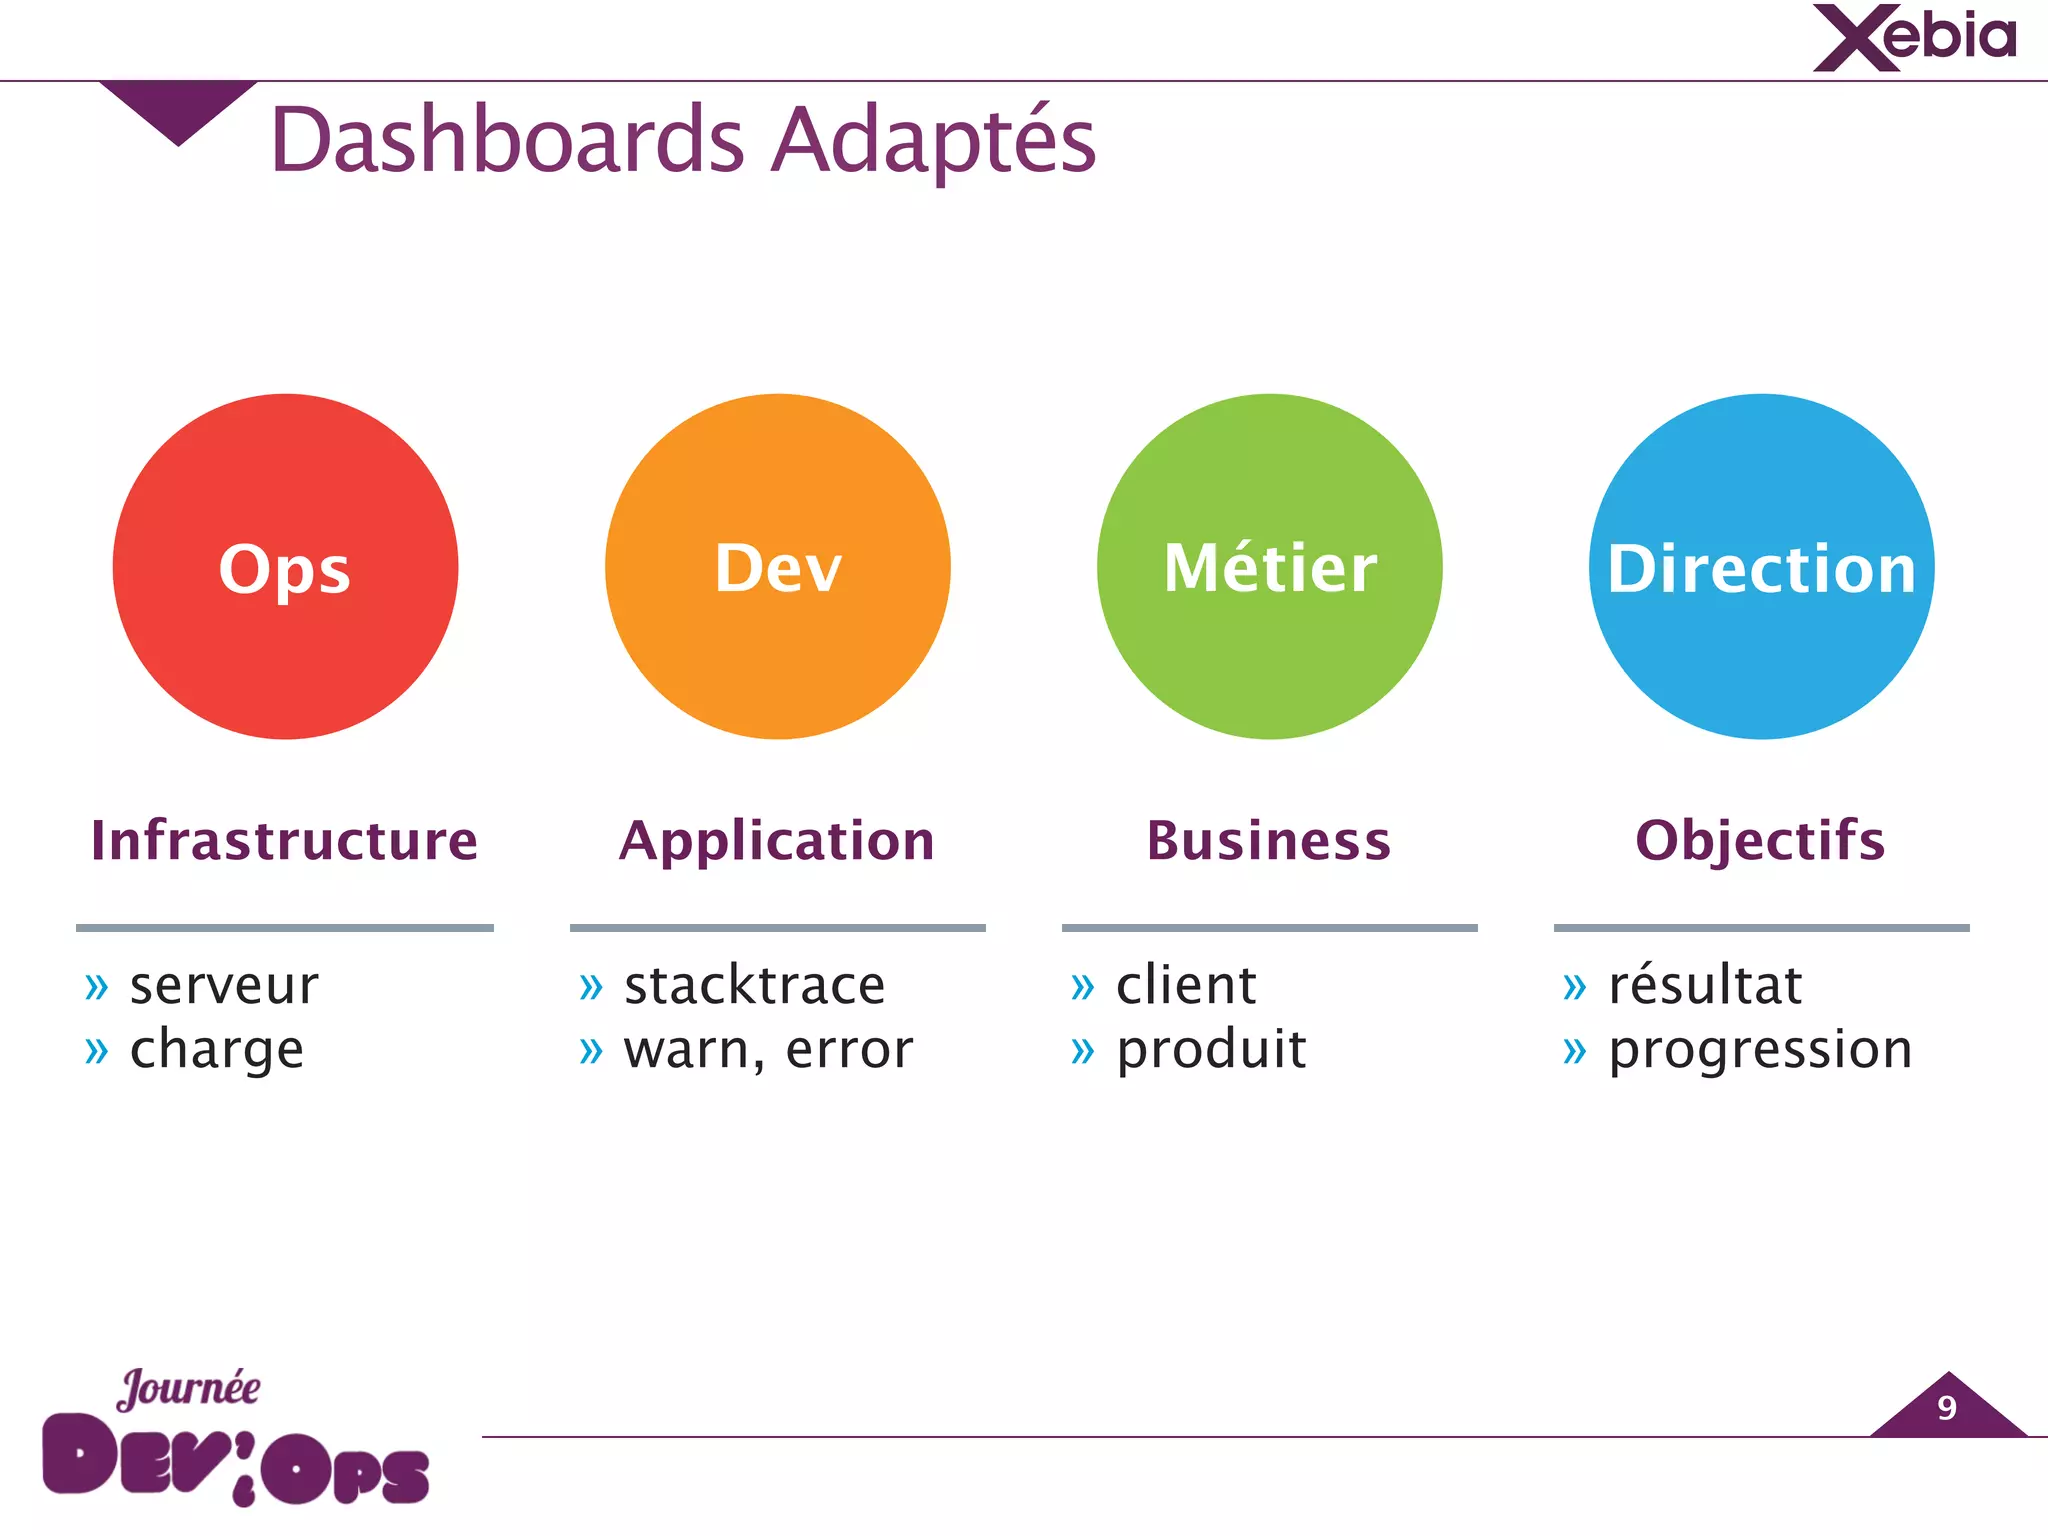
![Logstash - Filtre Grok
15
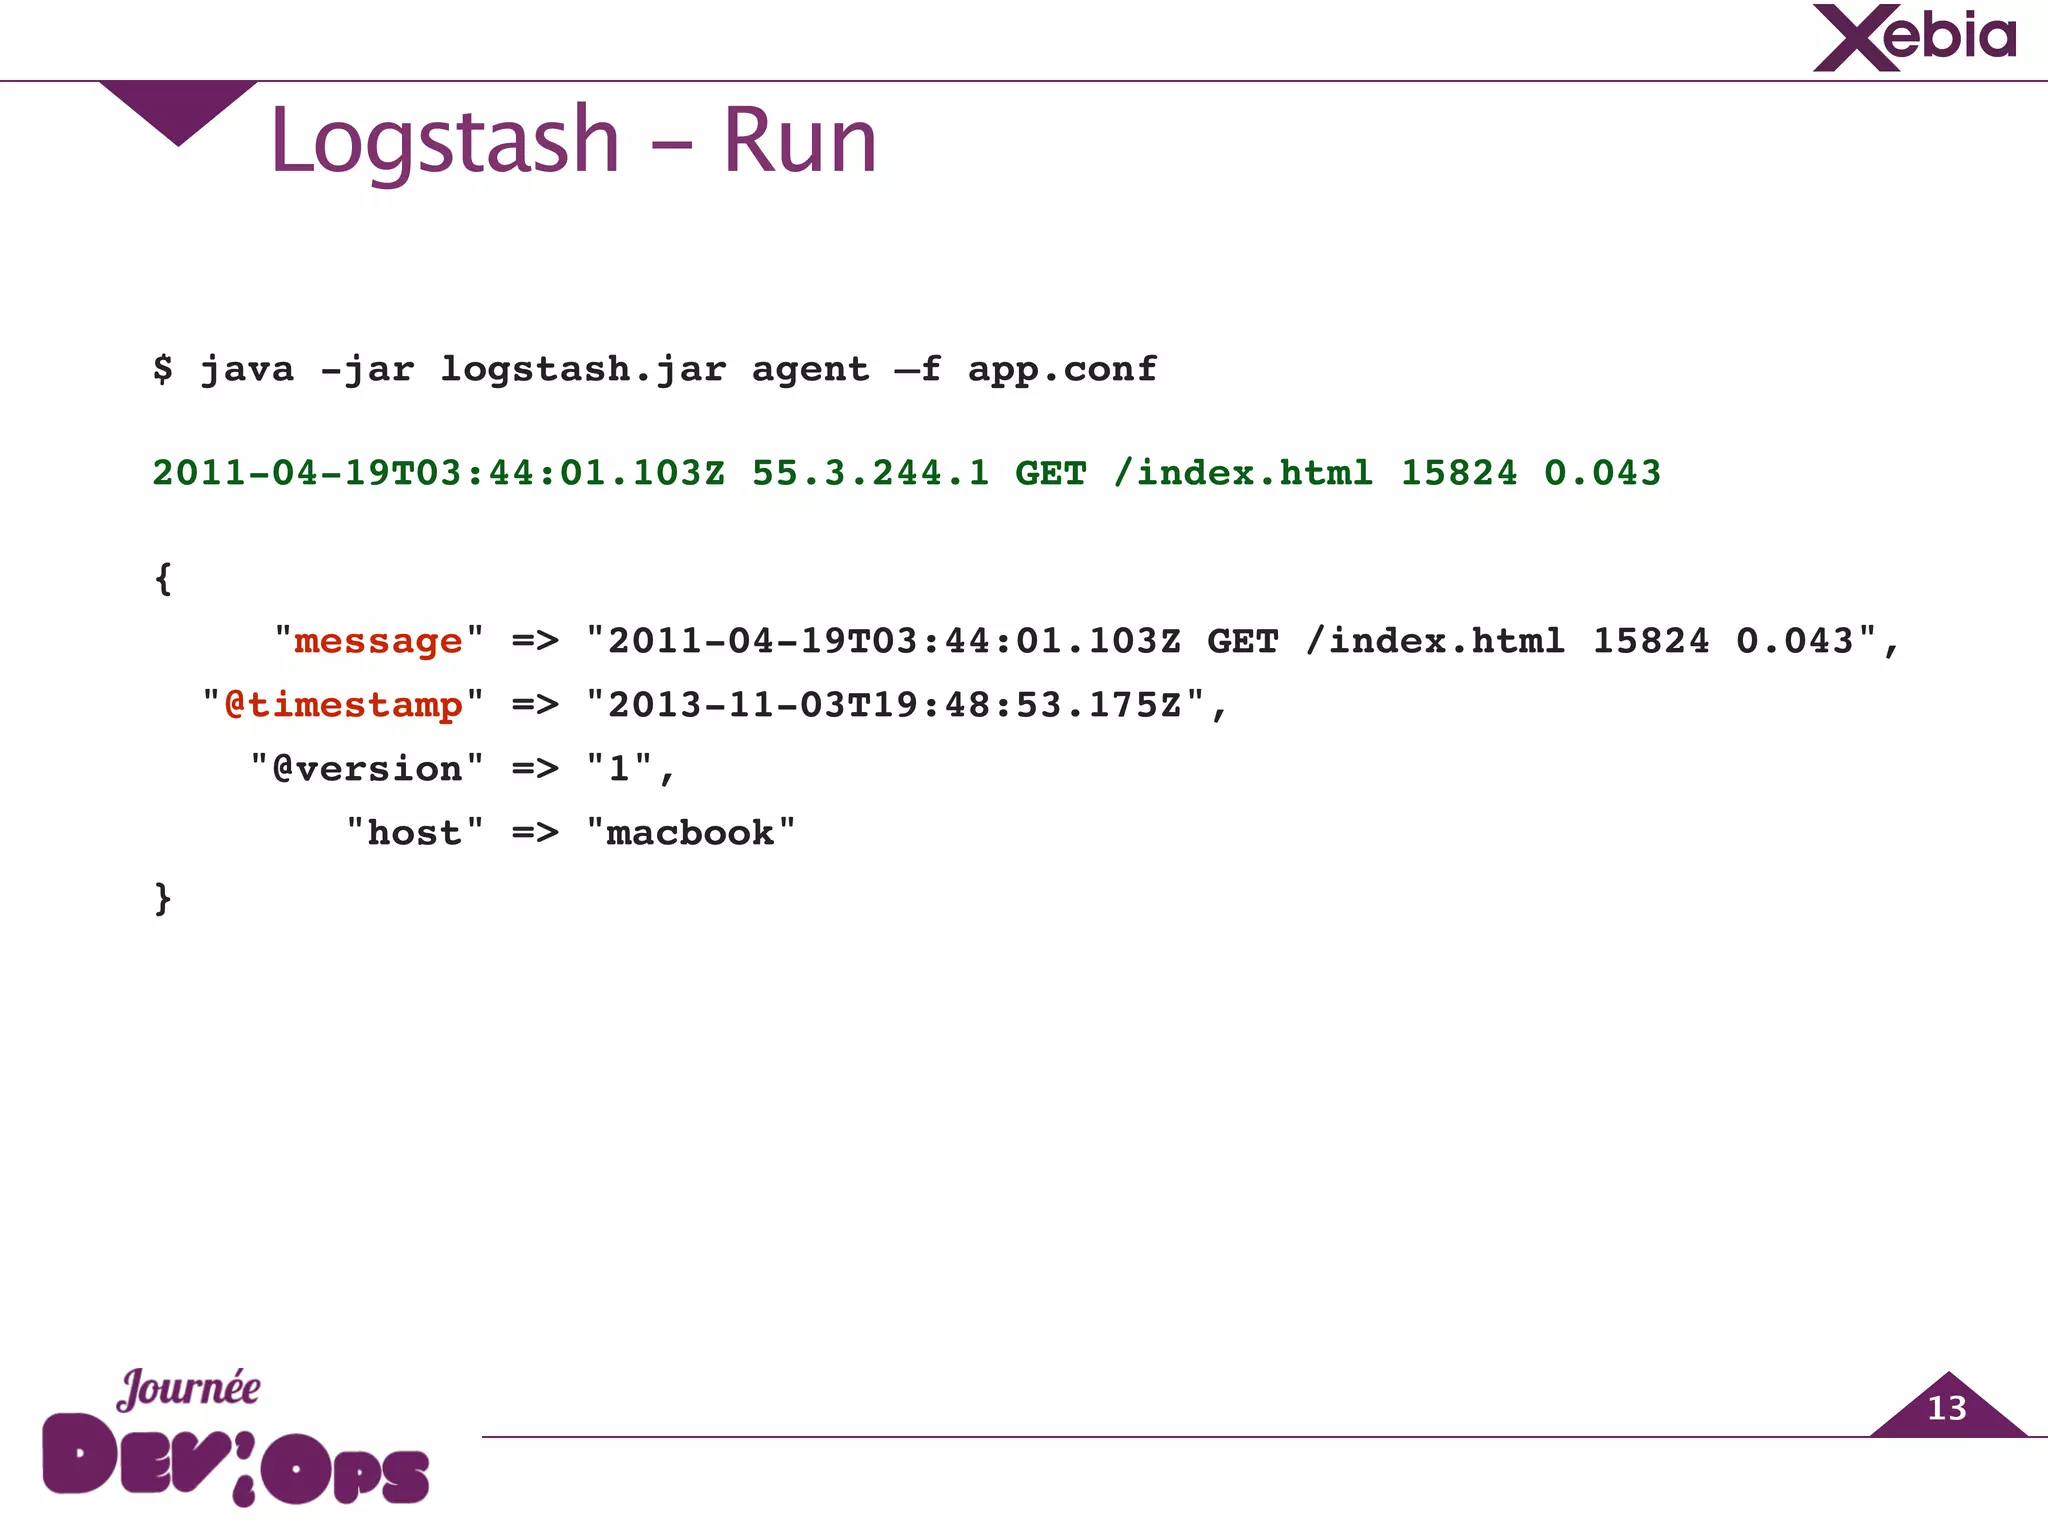
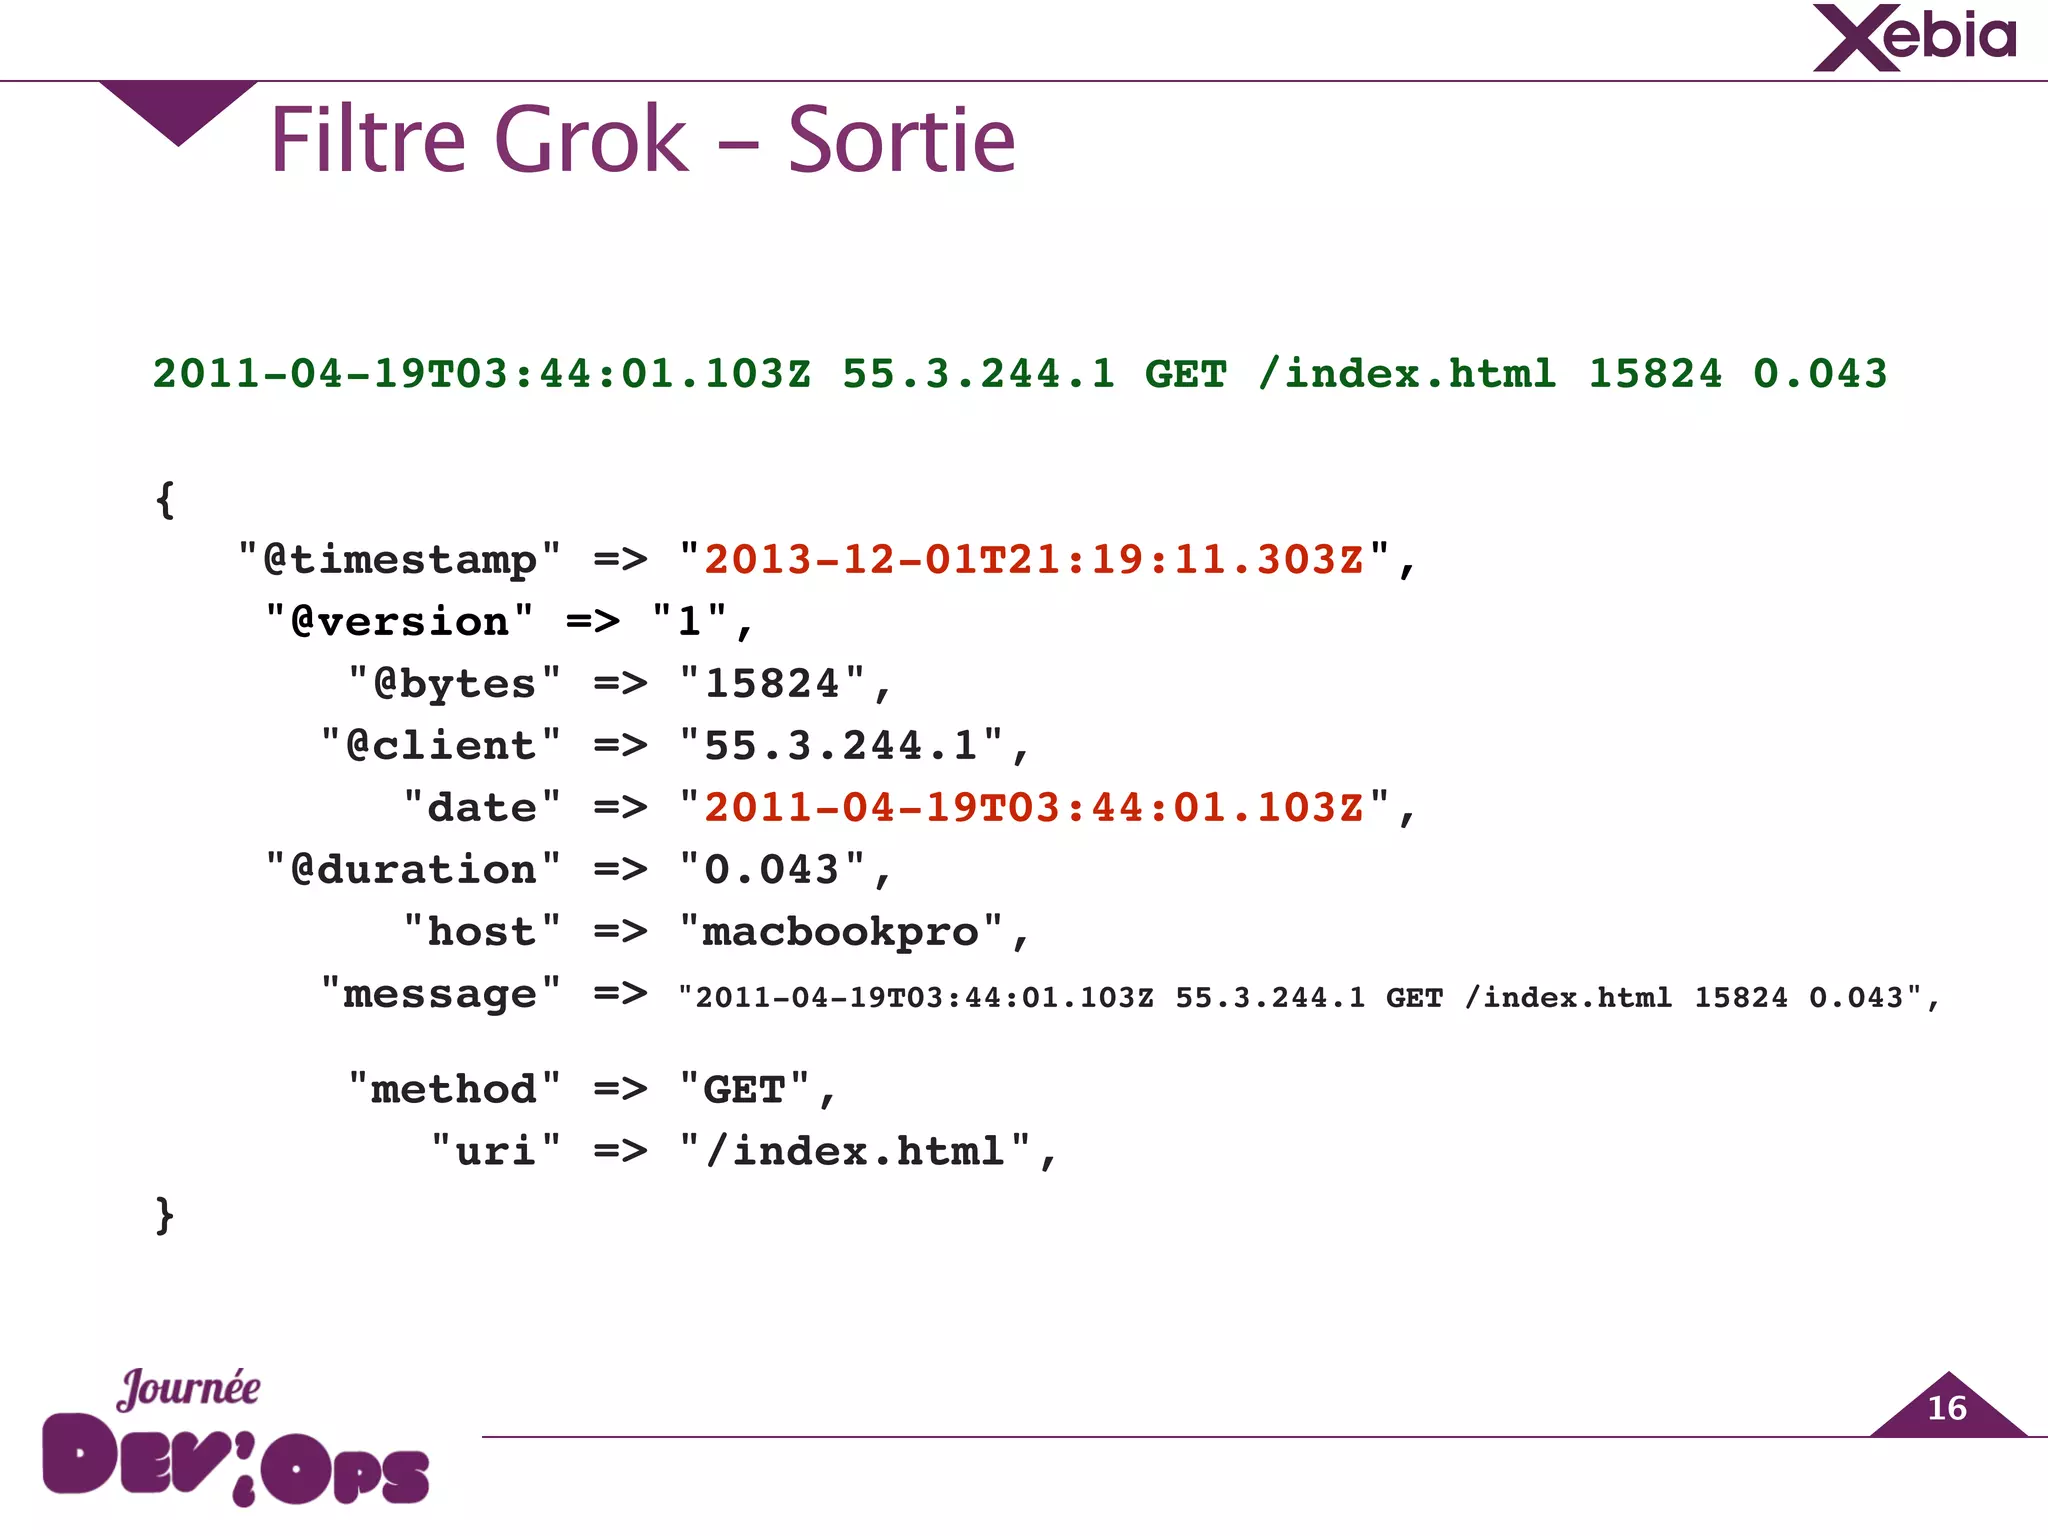
2011-04-19T03:44:01.103Z 55.3.244.1 GET /index.html 15824 0.043!
filter {
grok {
match =>
[ "message",
"%{TIMESTAMP_ISO8601:date} %{IP:client} %{WORD:method}
%{URIPATHPARAM:uri} %{NUMBER:bytes} %{NUMBER:duration}"
]
}
}](https://image.slidesharecdn.com/devopsday-140625064622-phpapp02/75/Journee-DevOps-Des-dashboards-pour-tous-avec-ElasticSearch-Logstash-et-Kibana-15-2048.jpg)
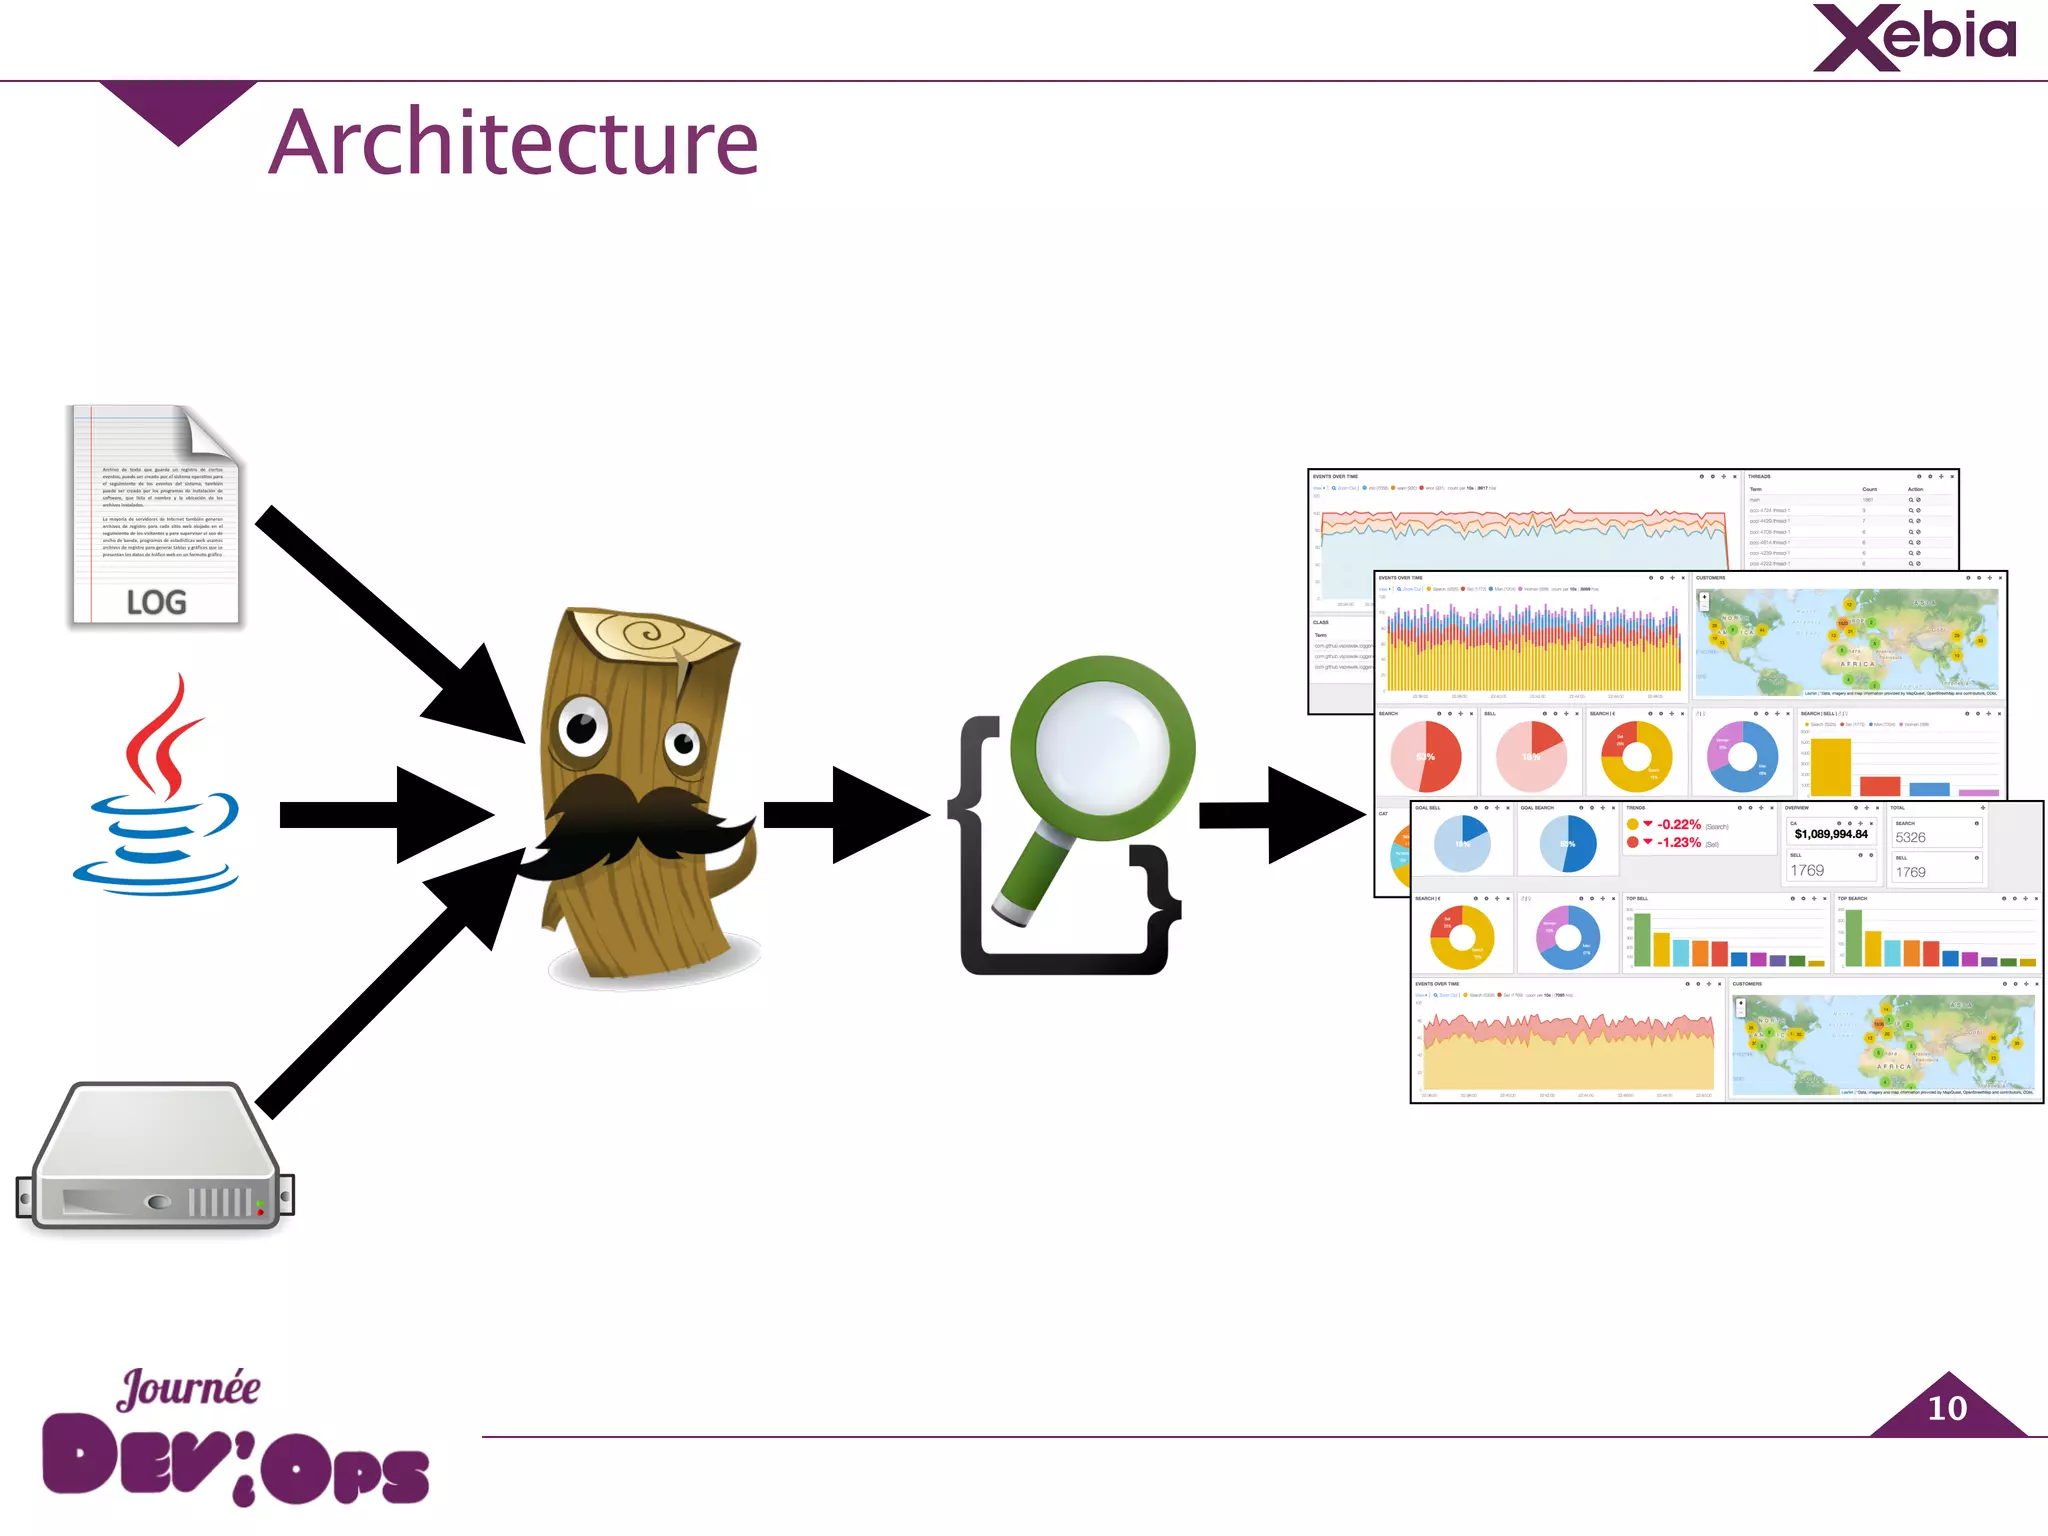
![Filtre Date - @Timestamp
17
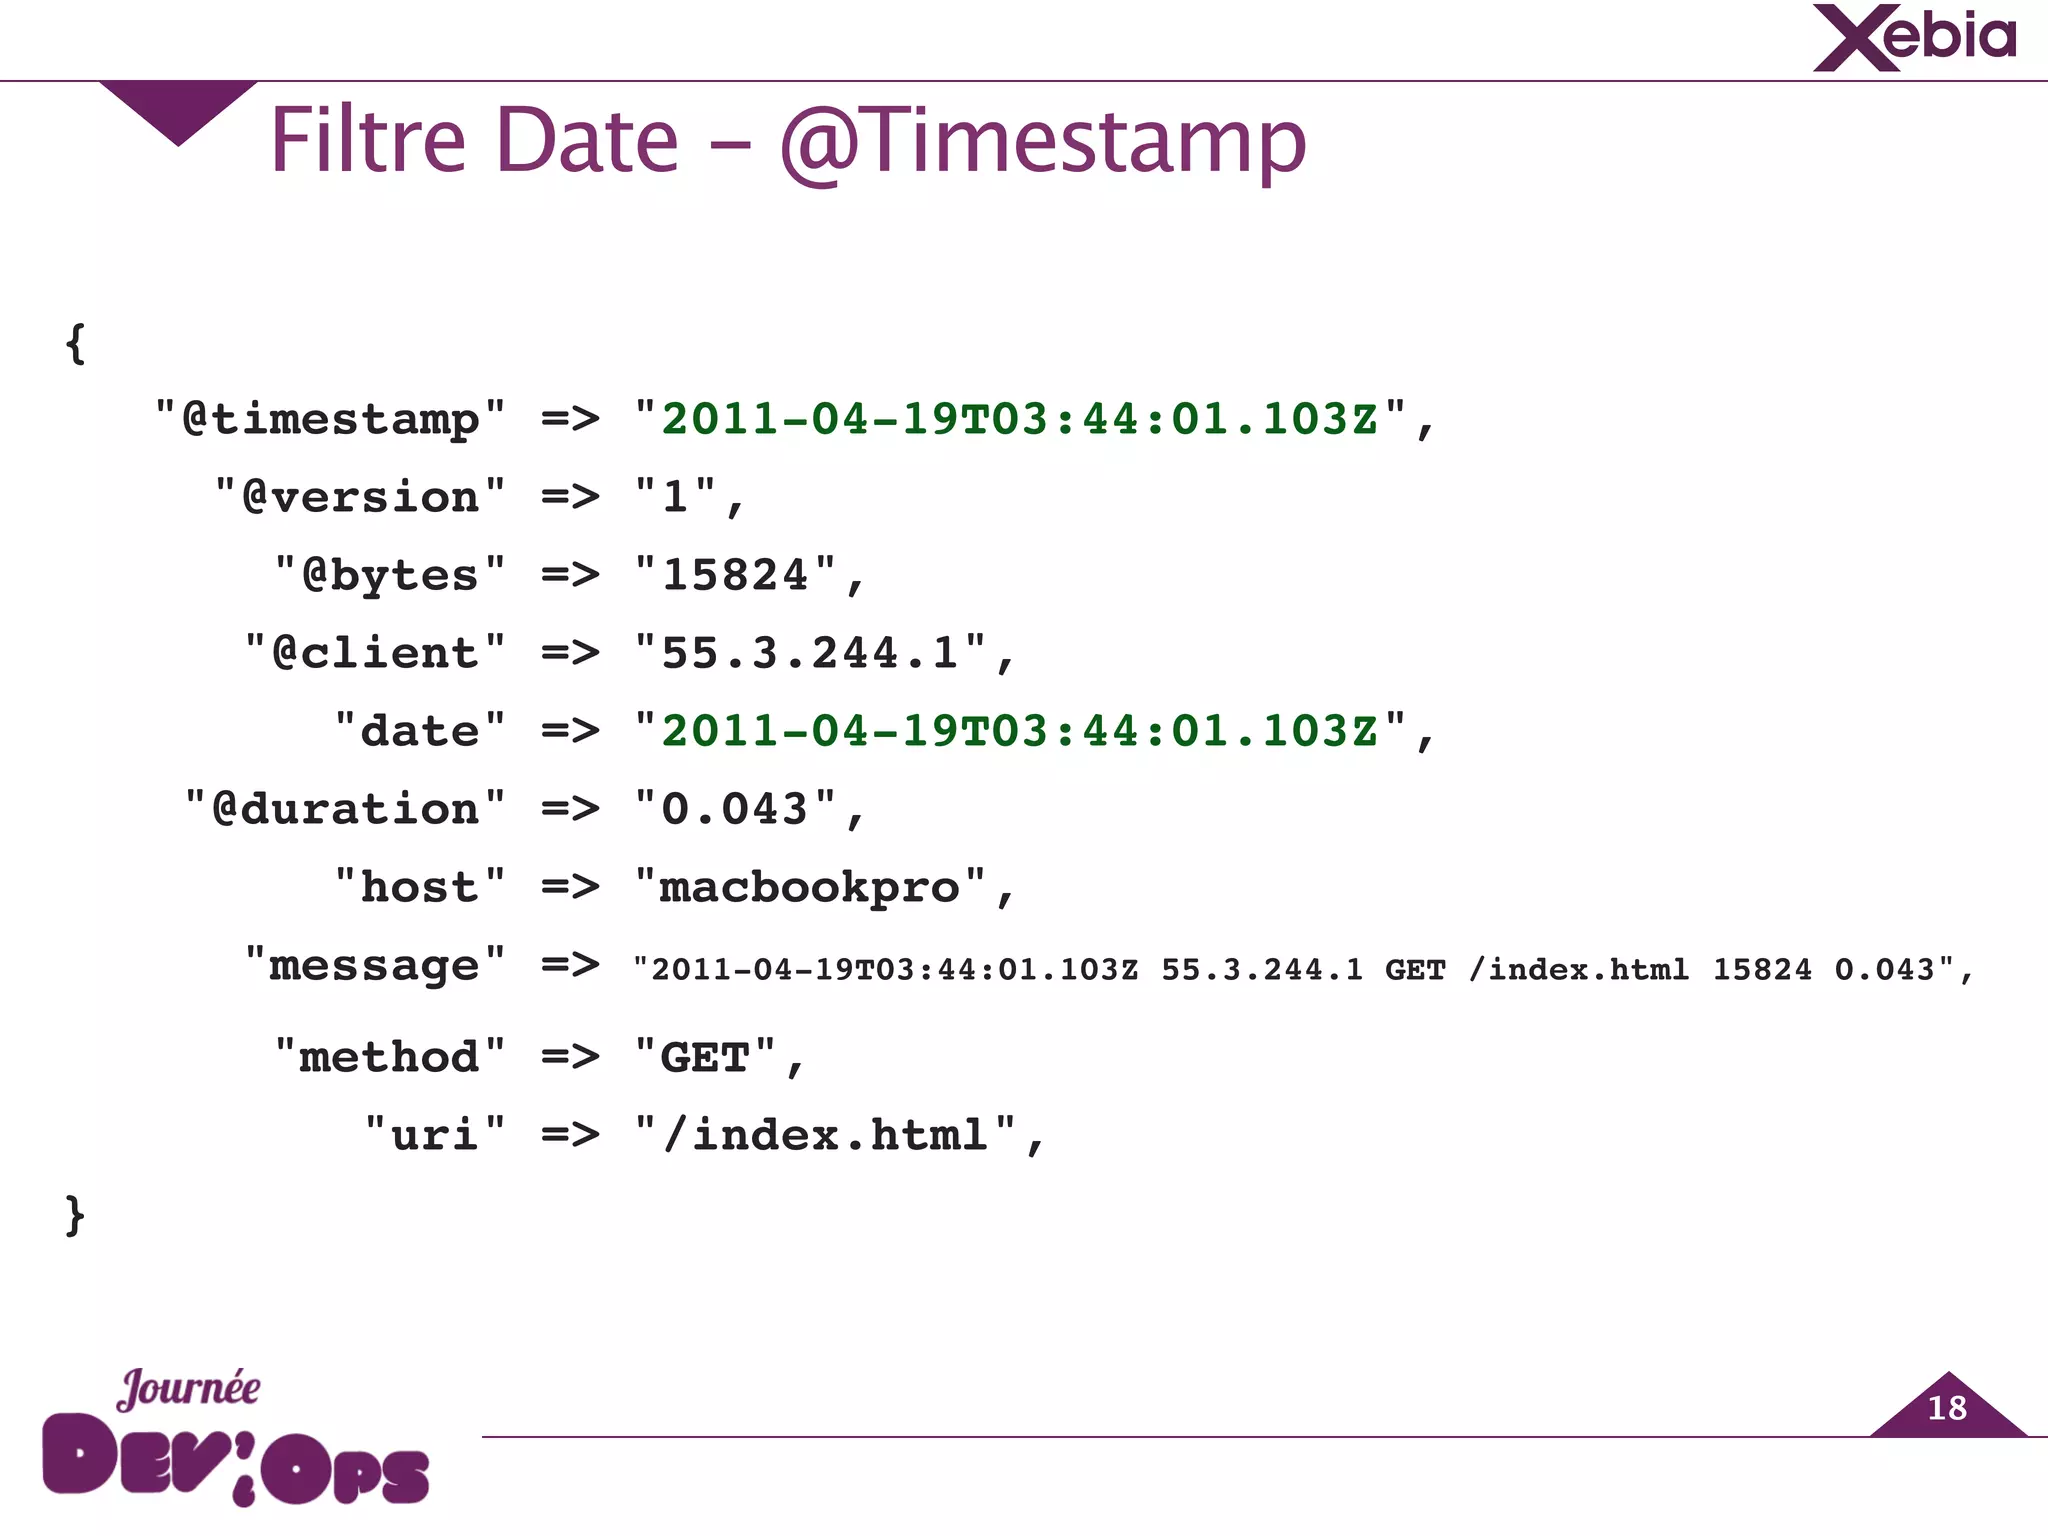
filter {!
date {!
match => [ "date", "ISO8601" ],!
}!
}!](https://image.slidesharecdn.com/devopsday-140625064622-phpapp02/75/Journee-DevOps-Des-dashboards-pour-tous-avec-ElasticSearch-Logstash-et-Kibana-17-2048.jpg)
![Logstash - Syslog configuration
47
input {
udp {
port => "5514"
}
}
!
filter {
grok {
patterns_dir => "./patterns"
match => ["message","%{LOGBACK_SYSLOG}"]
}
}
!
filter {
date {
match => ["log_date","dd-MM-YYYY HH:mm:ss.SSS"]
}
}
!
output {
elasticsearch {}
}](https://image.slidesharecdn.com/devopsday-140625064622-phpapp02/75/Journee-DevOps-Des-dashboards-pour-tous-avec-ElasticSearch-Logstash-et-Kibana-47-2048.jpg)
![Logstash - Pattern
48
!
!
!
!
LOG_DATE %{MONTHDAY}-%{MONTHNUM}-%{YEAR} %{HOUR}:%{MINUTE}:%{SECOND}.[0-9]{3}
!
SYSLOG_BASE %{SYSLOG5424PRI}%{SYSLOGTIMESTAMP:syslog_timestamp} %{SYSLOGHOST:syslog_host}
SYSLOG %{SYSLOG_BASE} %{GREEDYDATA:syslog_message}
!
LOGBACK_SYSLOG_BASE %{SYSLOG_BASE} %{LOG_DATE:log_date} [%{NOTSPACE:thread}] %{LOGLEVEL:log_level} %{NOTSPACE:classname}
LOGBACK_SYSLOG %{LOGBACK_SYSLOG_BASE} %{GREEDYDATA:log_msg}](https://image.slidesharecdn.com/devopsday-140625064622-phpapp02/75/Journee-DevOps-Des-dashboards-pour-tous-avec-ElasticSearch-Logstash-et-Kibana-48-2048.jpg)

![GeekShop - Format Logs
53
09-06-2014 21:27:42.228 [pool-32-thread-1] INFO
com.github.vspiewak.loggenerator.SearchRequest -
id=317&ua=Mozilla/5.0 (X11; Linux x86_64) AppleWebKit/534.24
(KHTML, like Gecko) Chrome/11.0.696.65 Safari/
534.24&ip=94.228.34.210&category=Mobile!
!
09-06-2014 21:27:42.227 [pool-32-thread-1] INFO
com.github.vspiewak.loggenerator.SellRequest - id=313&ua=Mozilla/
5.0 (Windows; U; Windows NT 6.1; en-US; rv:1.9.2.17) Gecko/
20110420 Firefox/
3.6.17&ip=202.46.52.35&email=client314@gmail.com&sex=M&brand=Appl
e&name=iPod Touch&model=iPod Touch - Jaune - Disque
32Go&category=Baladeur&color=Jaune&options=Disque
32Go&price=329.0](https://image.slidesharecdn.com/devopsday-140625064622-phpapp02/75/Journee-DevOps-Des-dashboards-pour-tous-avec-ElasticSearch-Logstash-et-Kibana-53-2048.jpg)
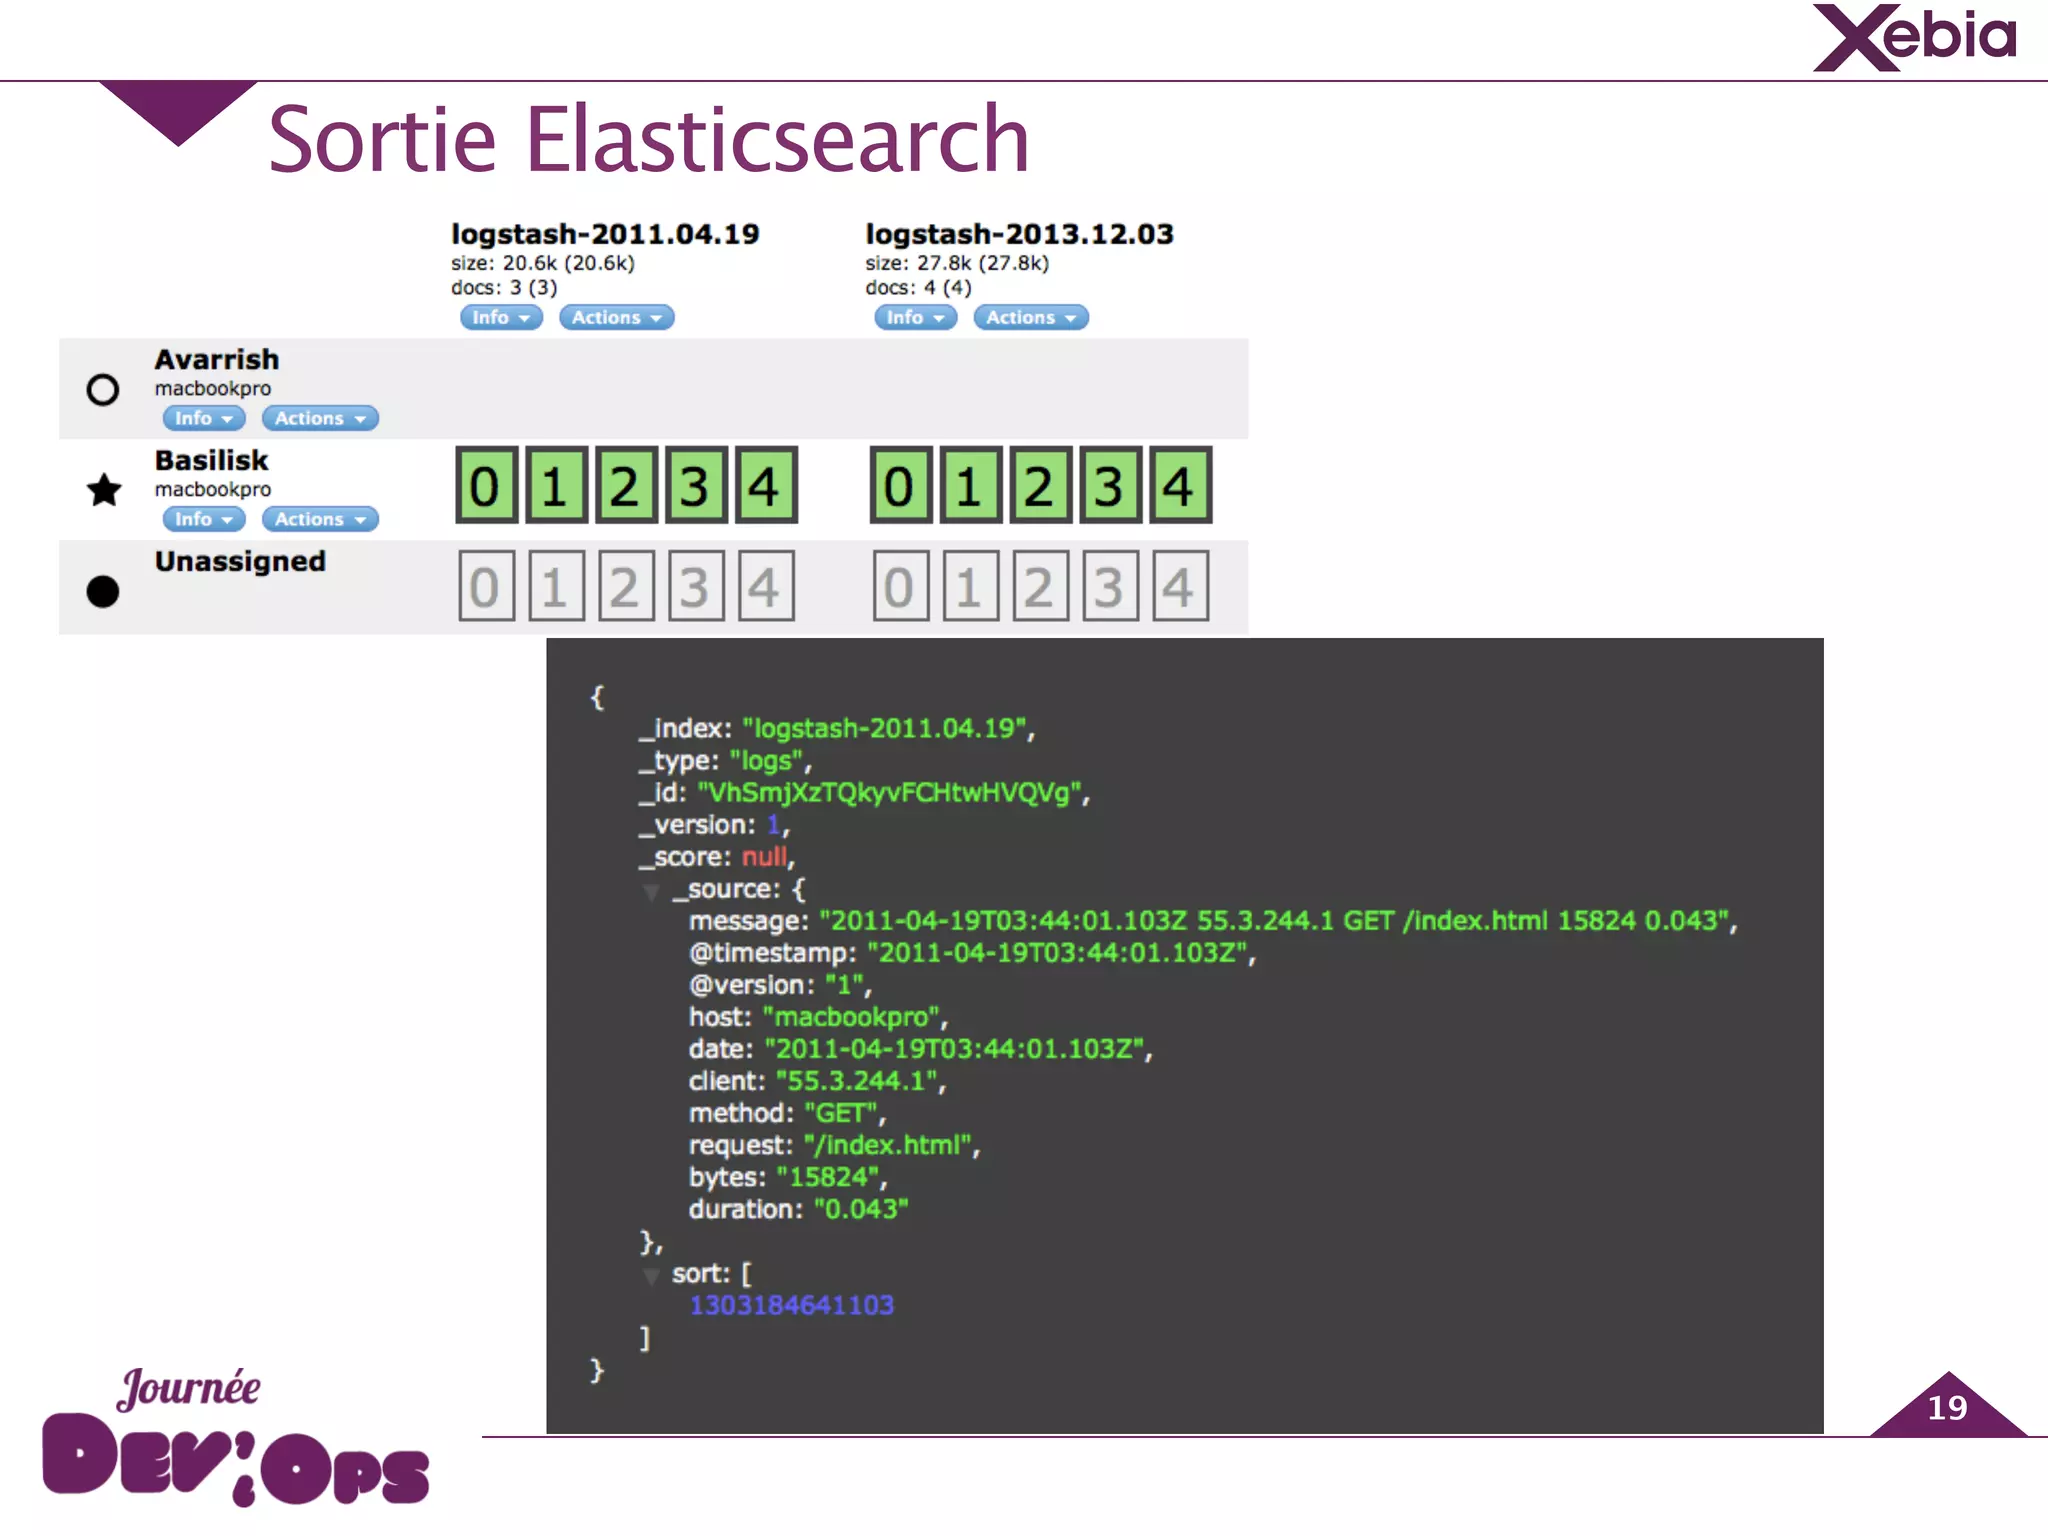
![GeekShop - Après Logstash
54
{!
"_index": "logstash-2014.06.09",!
"_type": "app-log",!
"_id": "gaQXRn9mROiAGjhBZ2h2Og",!
"_version": 1,!
"found": true,!
"_source": {!
"message": "09-06-2014 21:27:42.228 [pool-32-thread-1] INFO com.github.vspiewak.loggenerator.SearchRequest - id=317&ua=Mozilla/5.0 (X11;
Linux x86_64) AppleWebKit/534.24 (KHTML, like Gecko) Chrome/11.0.696.65 Safari/534.24&ip=94.228.34.210&category=Mobile",!
"@version": "1",!
"@timestamp": "2014-06-09T19:27:42.228Z",!
"type": "app-log",!
"host": "precise64",!
"path": "/home/vagrant/app.log",!
"log_date": "09-06-2014 21:27:42.228",!
"thread": "pool-32-thread-1",!
"log_level": "INFO",!
"classname": "com.github.vspiewak.loggenerator.SearchRequest",!
"log_msg": "- id=317&ua=Mozilla/5.0 (X11; Linux x86_64) AppleWebKit/534.24 (KHTML, like Gecko) Chrome/11.0.696.65 Safari/
534.24&ip=94.228.34.210&category=Mobile",!
"id": 317,!
"ua": "Mozilla/5.0 (X11; Linux x86_64) AppleWebKit/534.24 (KHTML, like Gecko) Chrome/11.0.696.65 Safari/534.24",!
"ip": "94.228.34.210",!
"category": "Mobile",!
"tags": [!
"search"!
],!
"geoip": {!
"ip": "94.228.34.210",!
"country_code2": "GB",!
"country_code3": "GBR",!
"country_name": "United Kingdom",!
"continent_code": "EU",!
"latitude": 51.5,!
"longitude": -0.12999999999999545,!
"timezone": "Europe/London",!
"location": [!
-0.12999999999999545,!
51.5!
]!
},!
"useragent": {!
"name": "Chrome",!
"os": "Linux",!
"os_name": "Linux",!
"device": "Other",!
"major": "11",!
"minor": "0",!
"patch": "696"!
}!
}!
}](https://image.slidesharecdn.com/devopsday-140625064622-phpapp02/75/Journee-DevOps-Des-dashboards-pour-tous-avec-ElasticSearch-Logstash-et-Kibana-54-2048.jpg)

![Vagrant VM
72
!
• config.vm.box = "hashicorp/precise64"
!
• config.vm.network "forwarded_port", guest: 80, host: 10080
• config.vm.network "forwarded_port", guest: 9200, host: 19200
!
• config.ssh.forward_x11 = true
!
• vb.customize ["modifyvm", :id, "--ioapic", "on", "--cpuexecutioncap", "40", "--
cpus", "2", "--memory", "1024" ]
!
• bootstrap.sh](https://image.slidesharecdn.com/devopsday-140625064622-phpapp02/75/Journee-DevOps-Des-dashboards-pour-tous-avec-ElasticSearch-Logstash-et-Kibana-72-2048.jpg)


This document presents an overview of monitoring systems and log management using the ELK stack (Elasticsearch, Logstash, Kibana) and related tools. It covers various topics including data input/output in Logstash, configuring Logstash for application logs, system monitoring with Collectd, and JMX monitoring for Java applications. Additionally, it addresses the creation of business intelligence dashboards and the significance of log analysis for understanding user behavior.