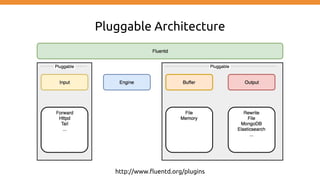
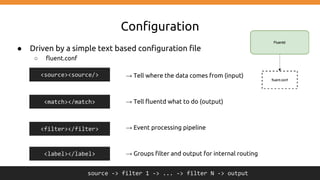
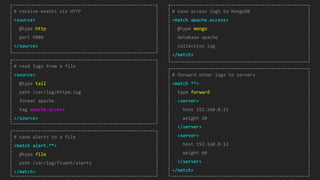
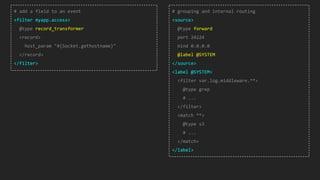
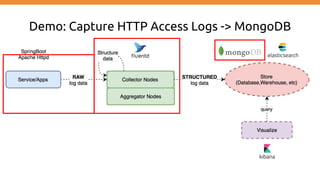
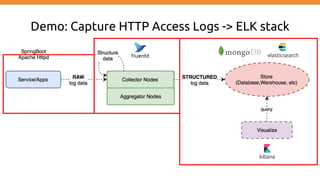
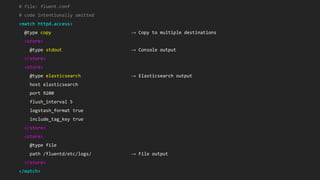
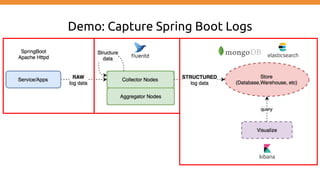
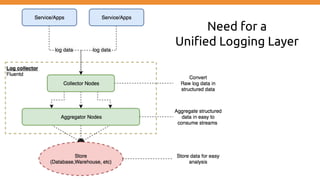
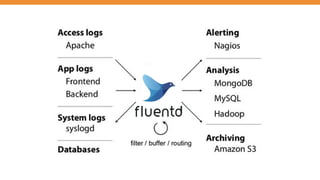
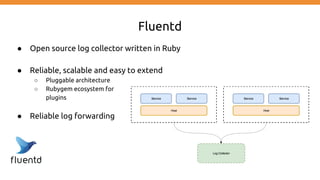
This document discusses using Fluentd to collect distributed application logging in a containerized environment. It provides an overview of Fluentd, including its pluggable architecture and configuration. It then demonstrates capturing logging from Docker containers and HTTP services and storing the logs in MongoDB and Elasticsearch as part of the ELK stack. It shows filtering and parsing logs from a Spring Boot application. Finally, it discusses setting up Fluentd for high availability.


![● Based on patterns or “calculated” metrics → send out events
○ Trigger alert and send notifications
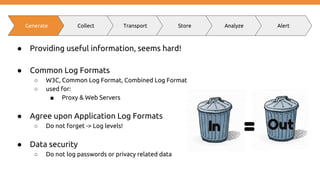
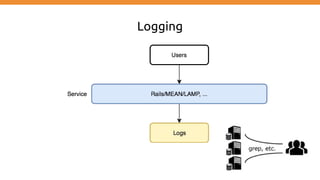
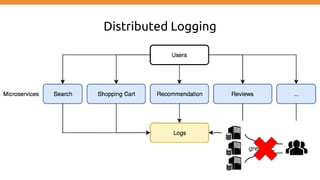
● Logging != Monitoring
○ Logging -> recording to diagnose a system
○ Monitoring -> observation, checking and recording
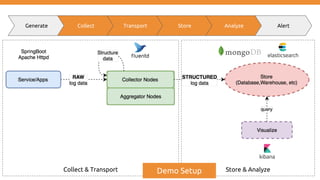
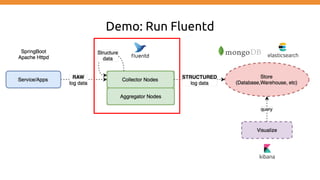
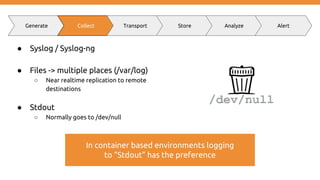
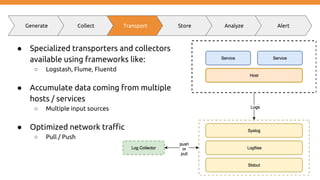
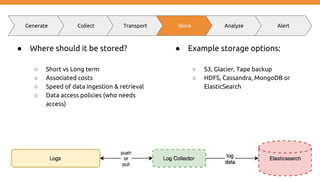
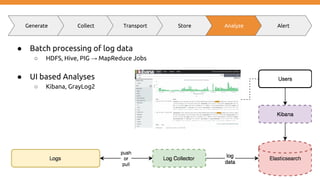
Generate Collect Transport Store Analyze Alert
http_requests_total{method="post",code="200"} 1027 1395066363000
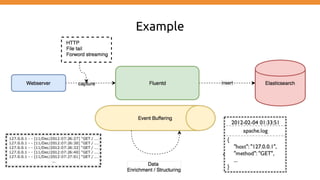
127.0.0.1 - frank [10/Oct/2000:13:55:36 -0700] "GET /apache_pb.gif HTTP/1.0" 200 2326](https://image.slidesharecdn.com/collectdistributedapplicationloggingusingfluentdefkstack-170602124646/85/Collect-distributed-application-logging-using-fluentd-EFK-stack-12-320.jpg)

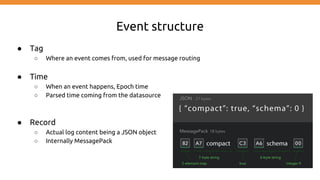
![Event example
192.168.0.1 - - [28/Feb/2013:12:00:00 +0900] "GET / HTTP/1.1" 200 777
tag:: apache.access # set by configuration
time: 1362020400 # 28/Feb/2013:12:00:00 +0900
record: {"user":"-","method":"GET","code":200,"size":777,"host":"192.168.0.1","path":"/"}](https://image.slidesharecdn.com/collectdistributedapplicationloggingusingfluentdefkstack-170602124646/85/Collect-distributed-application-logging-using-fluentd-EFK-stack-24-320.jpg)