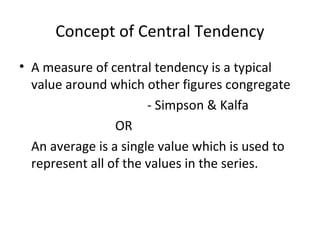
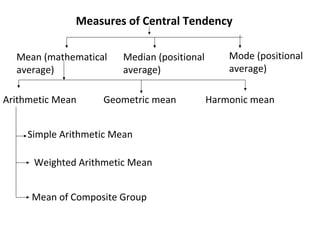
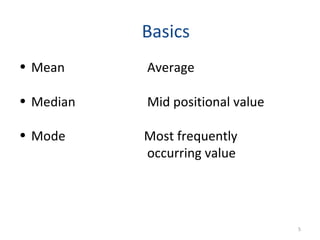
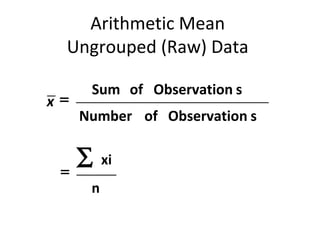
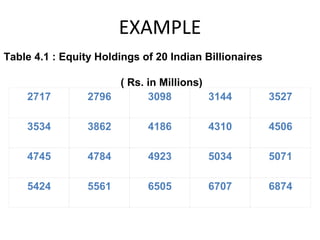
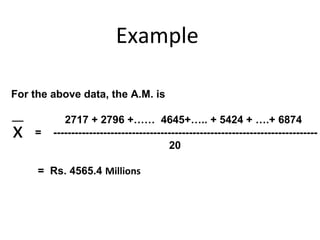
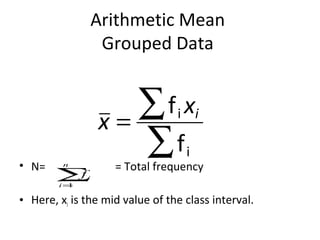
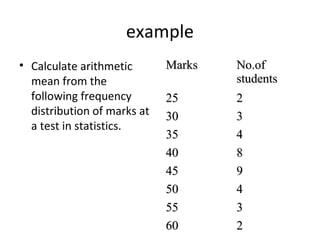
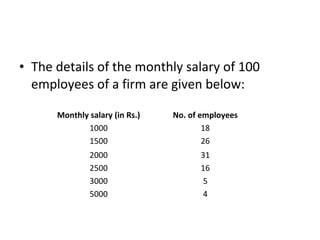
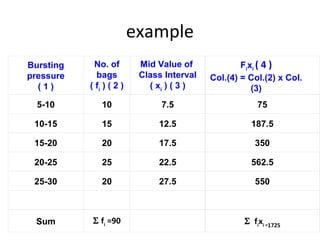
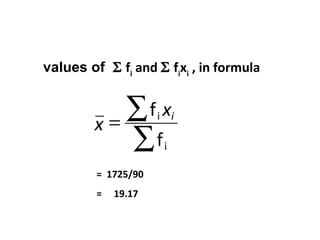
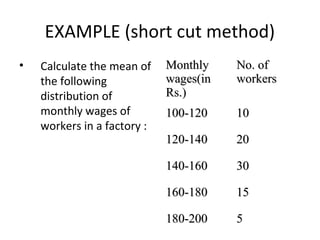
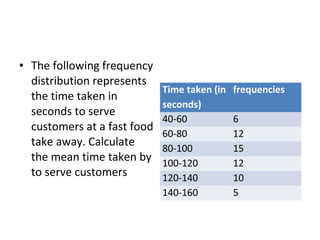
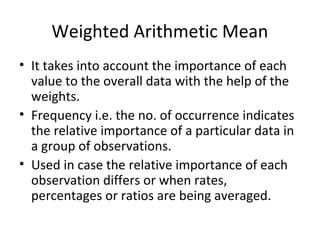
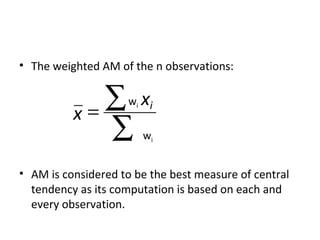
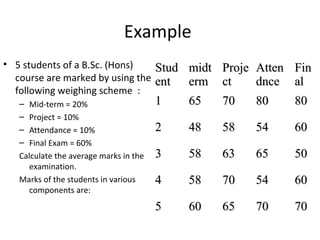
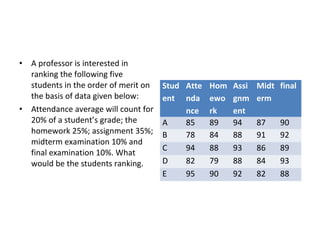
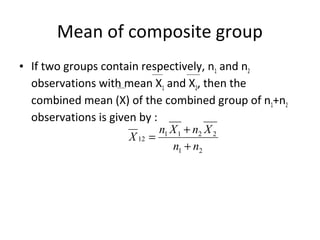
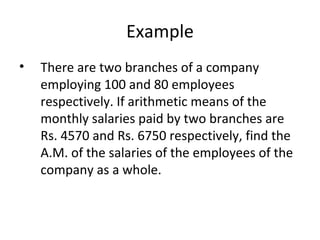
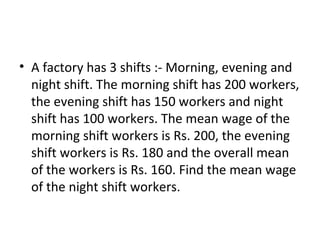
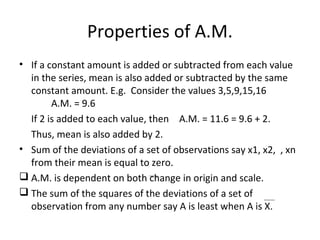
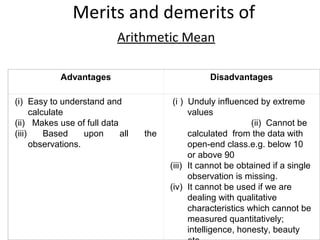
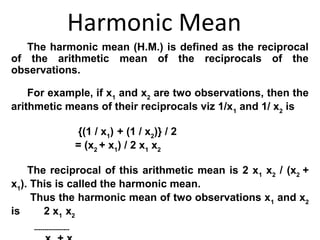
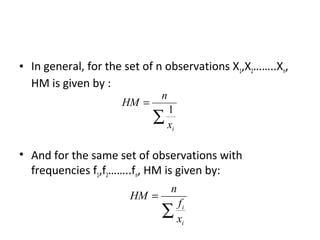
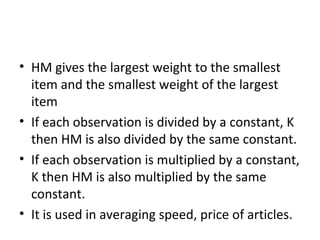
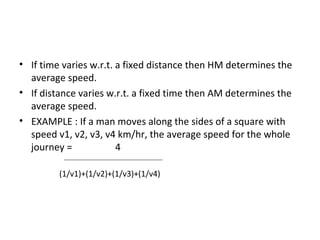
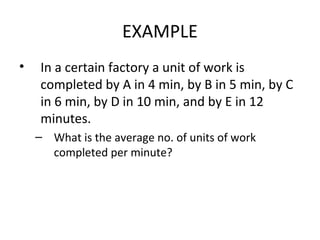
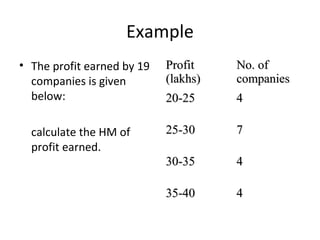
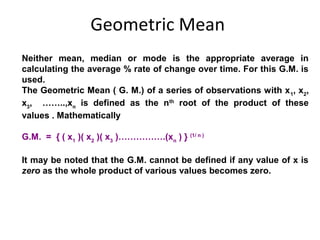
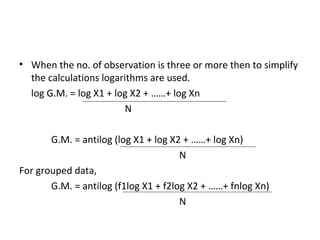
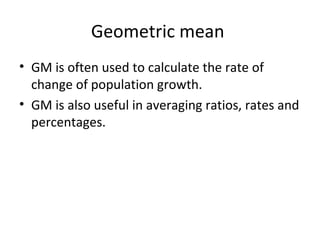
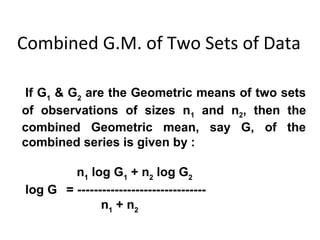
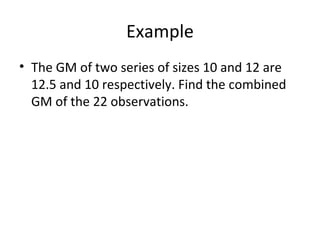
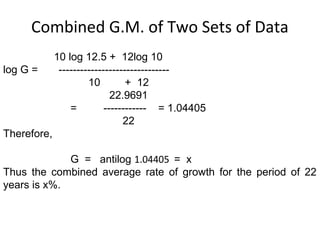
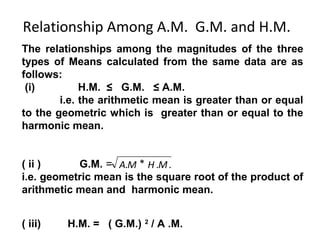
3. Concept of Central Tendency
• A measure of central tendency is a typical
value around which other figures congregate
- Simpson & Kalfa
OR
An average is a single value which is used to
represent all of the values in the series.
4. Measures of Central Tendency
Mean (mathematical Median (positional Mode (positional
average) average) average)
Arithmetic Mean Geometric mean Harmonic mean
Simple Arithmetic Mean
Weighted Arithmetic Mean
Mean of Composite Group
5. Basics
• Mean Average
• Median Mid positional value
• Mode Most frequently
occurring value
5
7. EXAMPLE
Table 4.1 : Equity Holdings of 20 Indian Billionaires
( Rs. in Millions)
2717 2796 3098 3144 3527
3534 3862 4186 4310 4506
4745 4784 4923 5034 5071
5424 5561 6505 6707 6874
8. Example
For the above data, the A.M. is
2717 + 2796 +…… 4645+….. + 5424 + ….+ 6874
x = --------------------------------------------------------------------------
20
= Rs. 4565.4 Millions
9. Arithmetic Mean
Grouped Data
x=
∑f x i i
• N= n
∑f i
= Total frequency
∑f
i=1
i
• Here, xi is the mid value of the class interval.
10. example
• Calculate arithmetic Marks No.of
mean from the students
following frequency 25 2
distribution of marks at 30 3
a test in statistics.
35 4
40 8
45 9
50 4
55 3
60 2
11. • The details of the monthly salary of 100
employees of a firm are given below:
Monthly salary (in Rs.) No. of employees
1000 18
1500 26
2000 31
2500 16
3000 5
5000 4
12. • In grouped data, the middle value of each group is
the representative of the group bz when the data are
grouped, the exact frequency with which each value
of the variable occurs in the distribution is unknown.
• We only know the limits within which a certain
number of frequencies occur.
• So, we make an assumption that the frequencies
within each class are distributed uniformly over the
range of class interval.
13. Example
• A company manufactures polythene bags. The
bags are evaluated on the basis of their
strength by buyers. The strength depends on
their bursting pressures. The following data
relates to the bursting pressure recorded in a
sample of 90 bags. Find the average bursting
pressure.
14. example
Bursting No. of Mid Value of Fixi ( 4 )
pressure bags Class Interval Col.(4) = Col.(2) x Col.
(1) ( fi ) ( 2 ) ( xi ) ( 3 ) (3)
5-10 10 7.5 75
10-15 15 12.5 187.5
15-20 20 17.5 350
20-25 25 22.5 562.5
25-30 20 27.5 550
Sum Σ fi =90 Σ fixi =1725
15. values of Σ fi and Σ fixi , in formula
x=
∑f x i i
∑f i
= 1725/90
= 19.17
16. EXAMPLE (short cut method)
• Calculate the mean of Monthly No. of
the following wages(in workers
distribution of Rs.)
monthly wages of 100-120 10
workers in a factory :
120-140 20
140-160 30
160-180 15
180-200 5
17. • The following frequency
distribution represents
Time taken (in frequencies
the time taken in
seconds)
seconds to serve
40-60 6
customers at a fast food
60-80 12
take away. Calculate 80-100 15
the mean time taken by 100-120 12
to serve customers 120-140 10
140-160 5
18. Weighted Arithmetic Mean
• It takes into account the importance of each
value to the overall data with the help of the
weights.
• Frequency i.e. the no. of occurrence indicates
the relative importance of a particular data in
a group of observations.
• Used in case the relative importance of each
observation differs or when rates,
percentages or ratios are being averaged.
19. • The weighted AM of the n observations:
x=
∑ x wi i
∑ wi
• AM is considered to be the best measure of central
tendency as its computation is based on each and
every observation.
20. Example
• 5 students of a B.Sc. (Hons) Stud midt Proje Atten Fin
course are marked by using the ent erm ct dnce al
following weighing scheme :
– Mid-term = 20% 1 65 70 80 80
– Project = 10%
– Attendance = 10% 2 48 58 54 60
– Final Exam = 60%
Calculate the average marks in the 3 58 63 65 50
examination.
Marks of the students in various 4 58 70 54 60
components are:
5 60 65 70 70
21. • A professor is interested in
ranking the following five
students in the order of merit on Stud Atte Hom Assi Midt final
the basis of data given below: ent nda ewo gnm erm
• Attendance average will count for nce rk ent
20% of a student’s grade; the A 85 89 94 87 90
homework 25%; assignment 35%; B 78 84 88 91 92
midterm examination 10% and
C 94 88 93 86 89
final examination 10%. What
would be the students ranking. D 82 79 88 84 93
E 95 90 92 82 88
22. Mean of composite group
• If two groups contain respectively, n1 and n2
observations with mean X1 and X2, then the
combined mean (X) of the combined group of n1+n2
observations is given by :
n1 X 1 + n2 X 2
X 12 =
n1 + n2
23. Example
• There are two branches of a company
employing 100 and 80 employees
respectively. If arithmetic means of the
monthly salaries paid by two branches are
Rs. 4570 and Rs. 6750 respectively, find the
A.M. of the salaries of the employees of the
company as a whole.
24. • A factory has 3 shifts :- Morning, evening and
night shift. The morning shift has 200 workers,
the evening shift has 150 workers and night
shift has 100 workers. The mean wage of the
morning shift workers is Rs. 200, the evening
shift workers is Rs. 180 and the overall mean
of the workers is Rs. 160. Find the mean wage
of the night shift workers.
25. Properties of A.M.
• If a constant amount is added or subtracted from each value
in the series, mean is also added or subtracted by the same
constant amount. E.g. Consider the values 3,5,9,15,16
A.M. = 9.6
If 2 is added to each value, then A.M. = 11.6 = 9.6 + 2.
Thus, mean is also added by 2.
• Sum of the deviations of a set of observations say x1, x2, , xn
from their mean is equal to zero.
A.M. is dependent on both change in origin and scale.
The sum of the squares of the deviations of a set of
observation from any number say A is least when A is X.
26. Merits and demerits of
Arithmetic Mean
Advantages Disadvantages
(i) Easy to understand and (i ) Unduly influenced by extreme
calculate values
(ii) Makes use of full data (ii) Cannot be
(iii) Based upon all the calculated from the data with
observations. open-end class.e.g. below 10
or above 90
(iii) It cannot be obtained if a single
observation is missing.
(iv) It cannot be used if we are
dealing with qualitative
characteristics which cannot be
measured quantitatively;
intelligence, honesty, beauty
27. Harmonic Mean
The harmonic mean (H.M.) is defined as the reciprocal
of the arithmetic mean of the reciprocals of the
observations.
For example, if x1 and x2 are two observations, then the
arithmetic means of their reciprocals viz 1/x1 and 1/ x2 is
{(1 / x1) + (1 / x2)} / 2
= (x2 + x1) / 2 x1 x2
The reciprocal of this arithmetic mean is 2 x1 x2 / (x2 +
x1). This is called the harmonic mean.
Thus the harmonic mean of two observations x1 and x2
is 2 x1 x2
-----------------
28. • In general, for the set of n observations X1,X2……..Xn,
HM is given by :
n
HM =
1
∑x
i
• And for the same set of observations with
frequencies f1,f2……..fn, HM is given by:
n
HM =
fi
∑x
i
29. • HM gives the largest weight to the smallest
item and the smallest weight of the largest
item
• If each observation is divided by a constant, K
then HM is also divided by the same constant.
• If each observation is multiplied by a constant,
K then HM is also multiplied by the same
constant.
• It is used in averaging speed, price of articles.
30. • If time varies w.r.t. a fixed distance then HM determines the
average speed.
• If distance varies w.r.t. a fixed time then AM determines the
average speed.
• EXAMPLE : If a man moves along the sides of a square with
speed v1, v2, v3, v4 km/hr, the average speed for the whole
journey = 4
(1/v1)+(1/v2)+(1/v3)+(1/v4)
31. EXAMPLE
• In a certain factory a unit of work is
completed by A in 4 min, by B in 5 min, by C
in 6 min, by D in 10 min, and by E in 12
minutes.
– What is the average no. of units of work
completed per minute?
32. Example
• The profit earned by 19 Profit No. of
companies is given (lakhs) companies
below: 20-25 4
calculate the HM of 25-30 7
profit earned.
30-35 4
35-40 4
33. Geometric Mean
Neither mean, median or mode is the appropriate average in
calculating the average % rate of change over time. For this G.M. is
used.
The Geometric Mean ( G. M.) of a series of observations with x 1, x2,
x3, ……..,xn is defined as the nth root of the product of these
values . Mathematically
G.M. = { ( x1 )( x2 )( x3 )…………….(xn ) } (1/ n )
It may be noted that the G.M. cannot be defined if any value of x is
zero as the whole product of various values becomes zero.
34. • When the no. of observation is three or more then to simplify
the calculations logarithms are used.
log G.M. = log X1 + log X2 + ……+ log Xn
N
G.M. = antilog (log X1 + log X2 + ……+ log Xn)
N
For grouped data,
G.M. = antilog (f1log X1 + f2log X2 + ……+ fnlog Xn)
N
35. Geometric mean
• GM is often used to calculate the rate of
change of population growth.
• GM is also useful in averaging ratios, rates and
percentages.
36. EXAMPLE
• A machinery is assumed to depreciate 44% in value in first
year, 15% in second year and 10% in next three years, each
percentage being calculated on diminishing value. What is
the average % of depreciation for the entire period?
• Compared to the previous year the overhead expenses
went up by 32% in 2002; they increased by 40% in the next
year and by 50% in the following year. Calculate the
average rate of increase in the overhead expenses over the
three years.
37. Example
• The annual rate of growth for a factory for 5 years is
7%,8%,4%,6%,10%respectively.What is the average rate
of growth per annum for this period.
• The price of the commodity increased by 8% from 1993
to 1994,12%from 1994 to 1995 and 76% from 1995 to
1996.the average price increase from 1993 to 1996 is
quoted as 28.64% and not 32%.Explain and verify the
result.
37
38. Combined G.M. of Two Sets of Data
If G1 & G2 are the Geometric means of two sets
of observations of sizes n1 and n2, then the
combined Geometric mean, say G, of the
combined series is given by :
n1 log G1 + n2 log G2
log G = -------------------------------
n1 + n2
39. Example
• The GM of two series of sizes 10 and 12 are
12.5 and 10 respectively. Find the combined
GM of the 22 observations.
40. Combined G.M. of Two Sets of Data
10 log 12.5 + 12log 10
log G = -------------------------------
10 + 12
22.9691
= ------------ = 1.04405
22
Therefore,
G = antilog 1.04405 = x
Thus the combined average rate of growth for the period of 22
years is x%.
41. Relationship Among A.M. G.M. and H.M.
The relationships among the magnitudes of the three
types of Means calculated from the same data are as
follows:
(i) H.M. ≤ G.M. ≤ A.M.
i.e. the arithmetic mean is greater than or equal
to the geometric which is greater than or equal to the
harmonic mean.
( ii ) G.M. = A.M * H .M .
i.e. geometric mean is the square root of the product of
arithmetic mean and harmonic mean.
( iii) H.M. = ( G.M.) 2 / A .M.