Download to read offline
![Roll No. ......................
Total No. of Questions : 13] [Total No. of Pages : 03
Paper ID [B0204]
(Please fill this Paper ID in OMR Sheet)
MBA/PGDBM (104) (S05) (Old) (Sem. - 1st )
QUANTITATIVE TECHNIQUES
Time : 03 Hours Maximum Marks : 75
Instruction to Candidates:
1) Section - A is Compulsory.
2) Attempt any Nine questions from Section - B.
Section - A
(15 × 2 = 30)
Q1)
a) Equivalent sets.
b) Linear and Quadratic equations.
c) Arithmetical Progression and Geometric Progression.
d) Matrix Inverse.
e) Mean deviation.
f) Harmonic mean and Geometric mean.
g) Partial and multiple correlation.
h) Mathematical Induction.
i) Secular trend Vs periodic movement of time series.
j) Conditional probability.
k) Null and alternative hypotheses.
l) Poisson distribution.
m) Principles of Mathematical Induction.
n) Kurtosis Vs Skewness.
o) t - test.
D-19 P.T.O.](https://image.slidesharecdn.com/b0204-110330141235-phpapp01/85/B0204-1-320.jpg)
![Roll No. ......................
Total No. of Questions : 13] [Total No. of Pages : 03
Paper ID [B0204]
(Please fill this Paper ID in OMR Sheet)
MBA/PGDBM (104) (S05) (Old) (Sem. - 1st )
QUANTITATIVE TECHNIQUES
Time : 03 Hours Maximum Marks : 75
Instruction to Candidates:
1) Section - A is Compulsory.
2) Attempt any Nine questions from Section - B.
Section - A
(15 × 2 = 30)
Q1)
a) Equivalent sets.
b) Linear and Quadratic equations.
c) Arithmetical Progression and Geometric Progression.
d) Matrix Inverse.
e) Mean deviation.
f) Harmonic mean and Geometric mean.
g) Partial and multiple correlation.
h) Mathematical Induction.
i) Secular trend Vs periodic movement of time series.
j) Conditional probability.
k) Null and alternative hypotheses.
l) Poisson distribution.
m) Principles of Mathematical Induction.
n) Kurtosis Vs Skewness.
o) t - test.
D-19 P.T.O.](https://image.slidesharecdn.com/b0204-110330141235-phpapp01/75/B0204-1-2048.jpg)
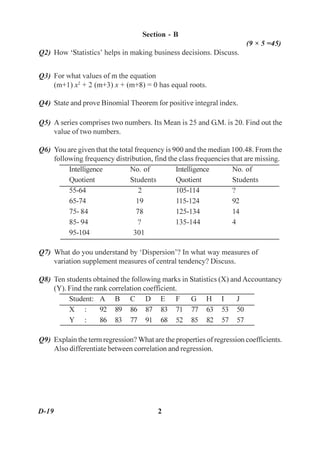
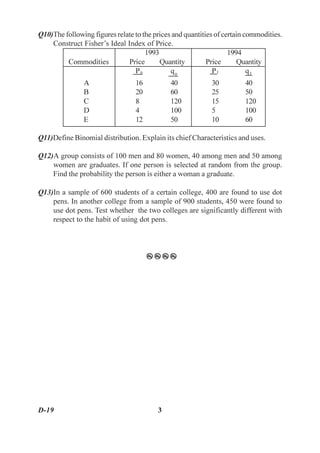

This document contains instructions and questions for a Quantitative Techniques exam consisting of two sections - Section A and Section B. Section A contains 15 multiple choice questions covering topics like equivalent sets, linear/quadratic equations, arithmetic/geometric progressions, matrix inverse, and more. Section B contains 9 long answer questions asking students to discuss how statistics helps with business decisions, state and prove the binomial theorem, calculate values based on mean and geometric mean, construct Fisher's ideal price index using price and quantity data, and more. Students have 3 hours to complete the exam which is worth a total of 75 marks.


