The document provides an overview of decision trees, a supervised machine learning algorithm used for classification and regression tasks, characterized by a flowchart-like structure with nodes, branches, and leaves. It explains how decision trees function, including splitting data based on features, metrics for selection like Gini impurity and information gain, and examples of their application in various domains such as healthcare and finance. Additionally, it discusses the advantages and limitations of decision trees, including issues like overfitting, instability, and challenges with complex patterns.


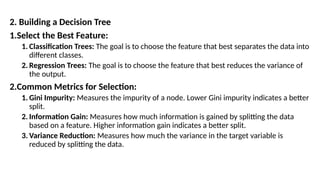
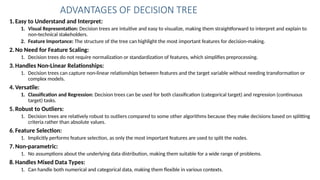
![Visual Representation of a Simple Decision Tree:
[Weather]
/ |
Sunny Overcast Rainy
/ /
Humidity - Wind -
/ /
High Normal Strong Weak
/ /
Don't Play Play Don't Play Play](https://image.slidesharecdn.com/aimachinelearning-31140523010-bds302-240828170448-5063fabd/85/Ai-Machine-learning-31140523010-BDS302-pptx-6-320.jpg)

![Yellow_Colorful_Animated_Illustration_Science_Theme_Presentation_(1)[1].pptx](https://cdn.slidesharecdn.com/ss_thumbnails/yellowcolorfulanimatedillustrationsciencethemepresentation11-251014055343-ae23ba9f-thumbnail.jpg?width=640&height=640&fit=bounds)


![[Women in Data Science Meetup ATX] Decision Trees](https://cdn.slidesharecdn.com/ss_thumbnails/decisiontrees-161118165341-thumbnail.jpg?width=640&height=640&fit=bounds)


