Downloaded 43 times


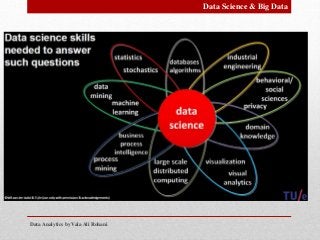
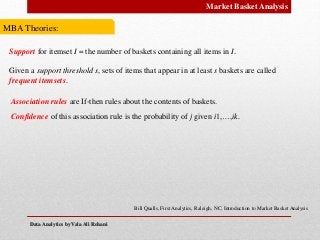
![SNA Main Centrality Metrics
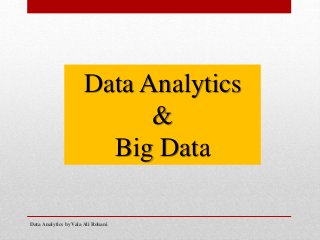
Betweenness
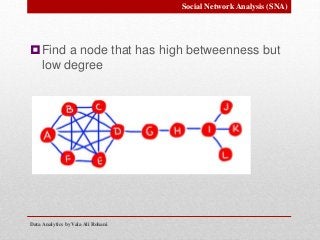
Betweenness centrality identifies an entity's position within a network in terms of its
ability to make connections to other pairs or groups in a network.
CB (i) = gjk (i)/gjk
j<k
å
CB
'
(i) = CB (i )/[(n -1)(n -2)/2]
Data Analytics by Vala Ali Rohani
Social Network Analysis (SNA)](https://image.slidesharecdn.com/daslidesvala-150402043245-conversion-gate01/85/Data-Analytics-25-320.jpg?cb=1427949228)
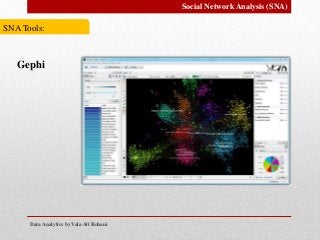
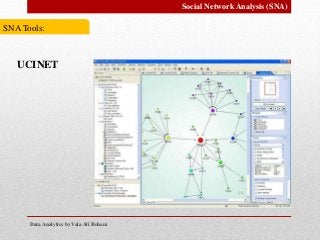

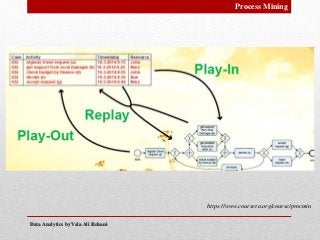
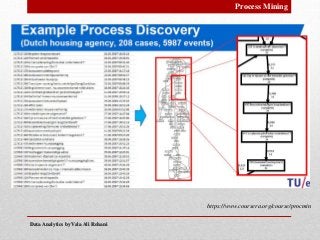


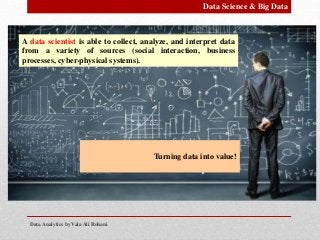
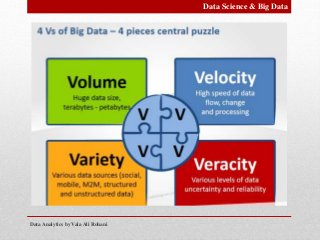
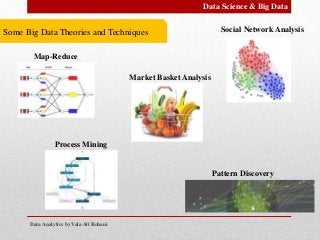
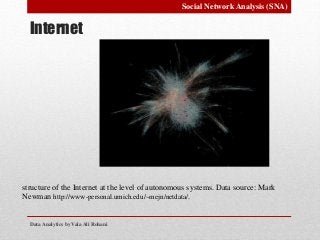
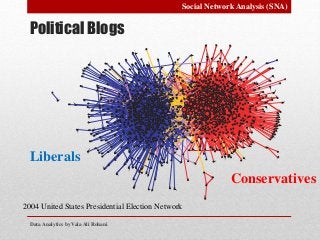
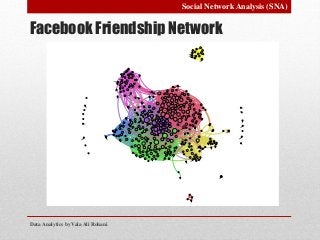
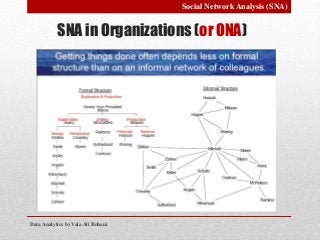
Dr. Vala Ali Rohani is a postdoctoral scholar with expertise in social network analysis and data science, presenting various data analytics concepts including big data, process mining, and market basket analysis. The document discusses the importance of data science tools, social network analysis methodologies, and market basket analysis techniques for understanding data-driven behaviors and optimizing processes. Additionally, it highlights the vast amounts of data generated today and the need for effective analytics to derive actionable insights.


![Introduction to Social Media Analytics [CSDC8023] And SMA LAB[CSDL8023].pptx](https://cdn.slidesharecdn.com/ss_thumbnails/introductiontosocialmediaanalyticscsdc8023andsmalabcsdl8023-251230171645-9740a41c-thumbnail.jpg?width=640&height=640&fit=bounds)


![제 23회 보아즈(BOAZ) 빅데이터 컨퍼런스 - [MBOAX] : ABSA를 활용한 소비자 반응 분석 기반 운영 효율화 대시보드 설계](https://cdn.slidesharecdn.com/ss_thumbnails/3-1boaz23rdconferencemboax-260203102709-9d519923-thumbnail.jpg?width=640&height=640&fit=bounds)


