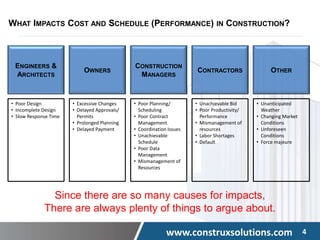
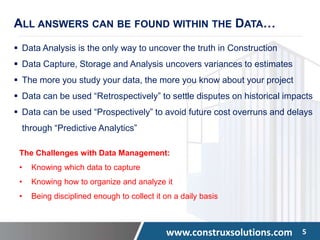
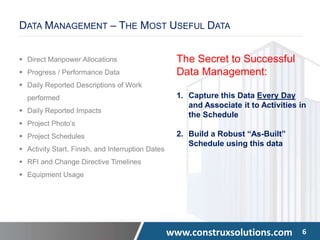
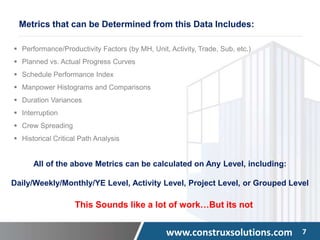
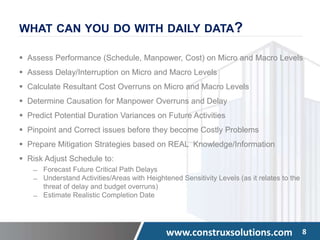
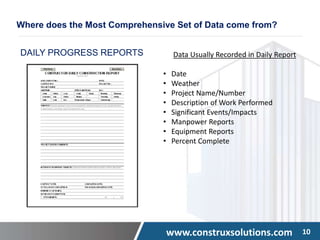
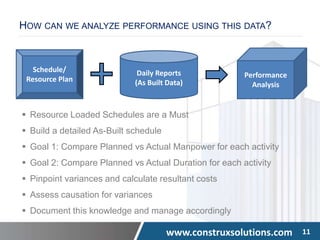
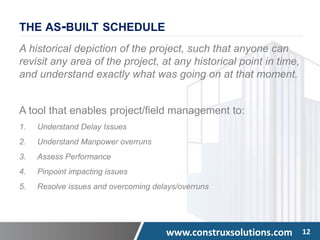
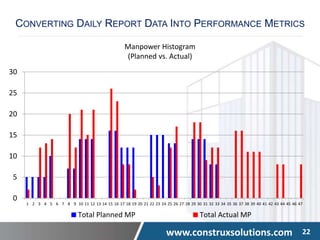
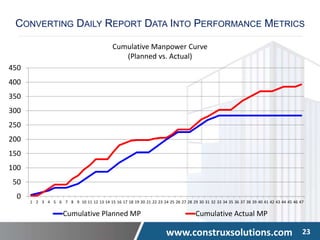
ANALYZING DATA, PERFORMANCE AND IMPACTS
IN CONSTRUCTION
Presented By: Michael A. Pink
www.construxsolutions.com 2
ABOUT THE PRESENTER: MICHAEL PINK
 Founder of Construx Solutions, LLC
 Inventor of the SmartPM Technology
 15 Years of Advisory Experience in Commercial Construction Industry
 Specialization in Project Controls, Risk Management, Dispute Avoidance
 Advisory Board Member for the School of Building Construction at GT
 Certified Planning and Scheduling Professional
 Certified Cost Engineer
www.construxsolutions.com 3
COURSE OBJECTIVES
 Impacts Explained – What Impacts a Construction Project?
 Data Management – Which Data to Capture and Why
 What can be done with this Data?
 Daily Progress Reporting and the “As-Built” Schedule
 Analyzing As-Built Data to Understand Impacts
www.construxsolutions.com 4
ENGINEERS &
ARCHITECTS
OWNERS
CONSTRUCTION
MANAGERS
CONTRACTORS OTHER
• Poor Design
• Incomplete Design
• Slow Response Time
• Excessive Changes
• Delayed Approvals/
Permits
• Prolonged Planning
• Delayed Payment
• Poor Planning/
Scheduling
• Poor Contract
Management
• Coordination Issues
• Unachievable
Schedule
• Poor Data
Management
• Mismanagement of
Resources
• Unachievable Bid
• Poor Productivity/
Performance
• Mismanagement of
resources
• Labor Shortages
• Default
• Unanticipated
Weather
• Changing Market
Conditions
• Unforeseen
Conditions
• Force majeure
WHAT IMPACTS COST AND SCHEDULE (PERFORMANCE) IN CONSTRUCTION?
Since there are so many causes for impacts,
There are always plenty of things to argue about.
www.construxsolutions.com 5
ALL ANSWERS CAN BE FOUND WITHIN THE DATA…
 Data Analysis is the only way to uncover the truth in Construction
 Data Capture, Storage and Analysis uncovers variances to estimates
 The more you study your data, the more you know about your project
 Data can be used “Retrospectively” to settle disputes on historical impacts
 Data can be used “Prospectively” to avoid future cost overruns and delays
through “Predictive Analytics”
The Challenges with Data Management:
• Knowing which data to capture
• Knowing how to organize and analyze it
• Being disciplined enough to collect it on a daily basis
www.construxsolutions.com 6
DATA MANAGEMENT – THE MOST USEFUL DATA
 Direct Manpower Allocations
 Progress / Performance Data
 Daily Reported Descriptions of Work
performed
 Daily Reported Impacts
 Project Photo’s
 Project Schedules
 Activity Start, Finish, and Interruption Dates
 RFI and Change Directive Timelines
 Equipment Usage
The Secret to Successful
Data Management:
1. Capture this Data Every Day
and Associate it to Activities in
the Schedule
2. Build a Robust “As-Built”
Schedule using this data
www.construxsolutions.com 7
Metrics that can be Determined from this Data Includes:
 Performance/Productivity Factors (by MH, Unit, Activity, Trade, Sub, etc.)
 Planned vs. Actual Progress Curves
 Schedule Performance Index
 Manpower Histograms and Comparisons
 Duration Variances
 Interruption
 Crew Spreading
 Historical Critical Path Analysis
All of the above Metrics can be calculated on Any Level, including:
Daily/Weekly/Monthly/YE Level, Activity Level, Project Level, or Grouped Level
This Sounds like a lot of work…But its not
www.construxsolutions.com 8
WHAT CAN YOU DO WITH DAILY DATA?
 Assess Performance (Schedule, Manpower, Cost) on Micro and Macro Levels
 Assess Delay/Interruption on Micro and Macro Levels
 Calculate Resultant Cost Overruns on Micro and Macro Levels
 Determine Causation for Manpower Overruns and Delay
 Predict Potential Duration Variances on Future Activities
 Pinpoint and Correct issues before they become Costly Problems
 Prepare Mitigation Strategies based on REAL Knowledge/Information
 Risk Adjust Schedule to:
̶ Forecast Future Critical Path Delays
̶ Understand Activities/Areas with Heightened Sensitivity Levels (as it relates to the
threat of delay and budget overruns)
̶ Estimate Realistic Completion Date
www.construxsolutions.com 9
Questions at this Point?
www.construxsolutions.com 10
DAILY PROGRESS REPORTS Data Usually Recorded in Daily Report
• Date
• Weather
• Project Name/Number
• Description of Work Performed
• Significant Events/Impacts
• Manpower Reports
• Equipment Reports
• Percent Complete
Where does the Most Comprehensive Set of Data come from?
www.construxsolutions.com 11
HOW CAN WE ANALYZE PERFORMANCE USING THIS DATA?
 Resource Loaded Schedules are a Must
 Build a detailed As-Built schedule
 Goal 1: Compare Planned vs Actual Manpower for each activity
 Goal 2: Compare Planned vs Actual Duration for each activity
 Pinpoint variances and calculate resultant costs
 Assess causation for variances
 Document this knowledge and manage accordingly
Performance
Analysis
Daily Reports
(As Built Data)
Schedule/
Resource Plan
www.construxsolutions.com 12
THE AS-BUILT SCHEDULE
A historical depiction of the project, such that anyone can
revisit any area of the project, at any historical point in time,
and understand exactly what was going on at that moment.
A tool that enables project/field management to:
1. Understand Delay Issues
2. Understand Manpower overruns
3. Assess Performance
4. Pinpoint impacting issues
5. Resolve issues and overcoming delays/overruns
www.construxsolutions.com 13
 Is An Organized and Visual Database that will:
̶ Help Lower the Risk of Project Delays
̶ Help Lower the Risk of Budget Overruns
̶ Provide Transparency of Project Issues and Resultant Impacts
̶ Enable Contractors to Prove Impacts Out of Their Control
̶ Enable Contractors to Learn from their own Mistakes
̶ Provide Better Overall Knowledge of Project
 Minimizes the Chance of a Dispute
 Will Result in Better Margins/Returns through Accountability
THE AS-BUILT SCHEDULE
www.construxsolutions.com 14
GOALS OF AN AS-BUILT SCHEDULE
1. Becomes the basis for comparison against the original project plan
2. Have the ability to assess variances for all activities for manpower, time,
material, work performed, equipment and cost.
3. Enables project management to understand who was working where and
when, what were they doing, what kind of progress was made and what
impacted progress.
4. To relate project correspondence to work activities in order to better
understand causation for deviations.
5. To perform better with these insights.
6. To be paid what is legitimately owed to you.
www.construxsolutions.com 15
Useful Documents in Generating a Robust As-Built Schedule
 Detailed “Daily” Work Reports
 Equipment Logs
 Timesheets
 Project Photo’s
 Project Schedules
 Payment Applications
 Weekly/Monthly Progress Reports
 Change Order’s / Logs
 Material Delivery Reports/Logs
 Inspection Reports / Logs
 RFI’s / Logs
 Submittal’s / Logs
 Project Letters/Correspondence
Impact Analysis Causation Analysis
www.construxsolutions.com 16
Questions at this Point?
www.construxsolutions.com 17
Case Study:
Building and Analyzing an As-Built Schedule
www.construxsolutions.com 18
STEPS
1. Locate the approved baseline schedule
2. Create a visual basis for comparison
3. Log/track actual data for all days worked across all activities
4. Cross Reference Visual with Database
5. Study variances between planned and actual data
6. Highlight significant variances and study causation
7. Respond in the appropriate manner
www.construxsolutions.com 19
SETTING UP THE AS PLANNED SCHEDULE INTO A VISUAL DATABASE
STEP 1: SETTING UP PLANNED SCHEDULE IN A DATABASE PROGRAM
www.construxsolutions.com 20
ADDING DAILY REPORT DATA INTO A VISUAL DATABASE
www.construxsolutions.com 21
CONVERTING DAILY REPORT DATA INTO PERFORMANCE METRICS
STEP 3: STUDY/COMPARE METRICS
www.construxsolutions.com 22
0
5
10
15
20
25
30
1 2 3 4 5 6 7 8 9 10 11 12 13 14 15 16 17 18 19 20 21 22 23 24 25 26 27 28 29 30 31 32 33 34 35 36 37 38 39 40 41 42 43 44 45 46 47
Total Planned MP Total Actual MP
Manpower Histogram
(Planned vs. Actual)
CONVERTING DAILY REPORT DATA INTO PERFORMANCE METRICS
www.construxsolutions.com 23
0
50
100
150
200
250
300
350
400
450
1 2 3 4 5 6 7 8 9 10 11 12 13 14 15 16 17 18 19 20 21 22 23 24 25 26 27 28 29 30 31 32 33 34 35 36 37 38 39 40 41 42 43 44 45 46 47
Cumulative Planned MP Cumulative Actual MP
Cumulative Manpower Curve
(Planned vs. Actual)
CONVERTING DAILY REPORT DATA INTO PERFORMANCE METRICS
www.construxsolutions.com 24
ADDITIONAL COMMENTS
1. This is a very simple example
2. Ways to make a more complex version more simple:
 Summarize the Schedule to a Level 1 or 2 version
 Incorporate a process of capturing data every day
3. If this is performed in real time, risk analysis can be
easily incorporated
4. This is definitely useful in avoiding disputes
www.construxsolutions.com 25
WHY IS THIS MY RECOMMENDED APPROACH…
• Because looking at things as it relates to the schedule just makes
sense…
– The schedule is the vehicle for managing labor, equipment and materials in construction;
– If you don’t align cost with the plan, it becomes “apples to oranges” (more difficult) when
reviewing variances, delays and overruns;
– If you just study cost, you will only know that you have cost variances, you won’t be certain
as to why. If you don’t know why, with certainty, you remain at risk.
– Daily Reports can easily align with the schedule, because that is how projects are essentially
managed;
– At the schedule level, data can be studied in “bite size” chunks, which is enough not get
bogged down, overwhelmed or confused by multiple ongoing issues; Once complete, it can
be summarized;
• It’s a process that is proven to work…
‒ It’s how people are successful in delay, impact and inefficiency analysis
‒ It’s how people are successful in predicting future durations, labor & equipment overruns,
end dates, impacts, critical path’s, outcomes; The things that drive cost.
www.construxsolutions.com 26
DISPUTE AVOIDANCE
 Study the As-Built, Understand issues on Granular Levels
 Discuss Delays and Causation with Stakeholders
 Collaborate in Order to Mitigate Realistically
 Incorporate Issues into the Schedule Update
 Work towards Resolution in Real Time
www.construxsolutions.com 27
PRESENTED BY: MICHAEL PINK
Contact Info:
C: 404 277 4387
O: 404 329 3000
mpink@construxsolutions.com
Feel free to contact me directly if
you have any additional questions
Sign up for our upcoming courses:
— CPM Scheduling Best Practices
— Data Management and Performance Analysis
— Delay Analysis in Construction
— Construction Claims Review/Prep
Follow us on LinkedIn for more info.

Analyzing data, performance and impacts in construction

  • 1.
    ANALYZING DATA, PERFORMANCEAND IMPACTS IN CONSTRUCTION Presented By: Michael A. Pink
  • 2.
    www.construxsolutions.com 2 ABOUT THEPRESENTER: MICHAEL PINK  Founder of Construx Solutions, LLC  Inventor of the SmartPM Technology  15 Years of Advisory Experience in Commercial Construction Industry  Specialization in Project Controls, Risk Management, Dispute Avoidance  Advisory Board Member for the School of Building Construction at GT  Certified Planning and Scheduling Professional  Certified Cost Engineer
  • 3.
    www.construxsolutions.com 3 COURSE OBJECTIVES Impacts Explained – What Impacts a Construction Project?  Data Management – Which Data to Capture and Why  What can be done with this Data?  Daily Progress Reporting and the “As-Built” Schedule  Analyzing As-Built Data to Understand Impacts
  • 4.
    www.construxsolutions.com 4 ENGINEERS & ARCHITECTS OWNERS CONSTRUCTION MANAGERS CONTRACTORSOTHER • Poor Design • Incomplete Design • Slow Response Time • Excessive Changes • Delayed Approvals/ Permits • Prolonged Planning • Delayed Payment • Poor Planning/ Scheduling • Poor Contract Management • Coordination Issues • Unachievable Schedule • Poor Data Management • Mismanagement of Resources • Unachievable Bid • Poor Productivity/ Performance • Mismanagement of resources • Labor Shortages • Default • Unanticipated Weather • Changing Market Conditions • Unforeseen Conditions • Force majeure WHAT IMPACTS COST AND SCHEDULE (PERFORMANCE) IN CONSTRUCTION? Since there are so many causes for impacts, There are always plenty of things to argue about.
  • 5.
    www.construxsolutions.com 5 ALL ANSWERSCAN BE FOUND WITHIN THE DATA…  Data Analysis is the only way to uncover the truth in Construction  Data Capture, Storage and Analysis uncovers variances to estimates  The more you study your data, the more you know about your project  Data can be used “Retrospectively” to settle disputes on historical impacts  Data can be used “Prospectively” to avoid future cost overruns and delays through “Predictive Analytics” The Challenges with Data Management: • Knowing which data to capture • Knowing how to organize and analyze it • Being disciplined enough to collect it on a daily basis
  • 6.
    www.construxsolutions.com 6 DATA MANAGEMENT– THE MOST USEFUL DATA  Direct Manpower Allocations  Progress / Performance Data  Daily Reported Descriptions of Work performed  Daily Reported Impacts  Project Photo’s  Project Schedules  Activity Start, Finish, and Interruption Dates  RFI and Change Directive Timelines  Equipment Usage The Secret to Successful Data Management: 1. Capture this Data Every Day and Associate it to Activities in the Schedule 2. Build a Robust “As-Built” Schedule using this data
  • 7.
    www.construxsolutions.com 7 Metrics thatcan be Determined from this Data Includes:  Performance/Productivity Factors (by MH, Unit, Activity, Trade, Sub, etc.)  Planned vs. Actual Progress Curves  Schedule Performance Index  Manpower Histograms and Comparisons  Duration Variances  Interruption  Crew Spreading  Historical Critical Path Analysis All of the above Metrics can be calculated on Any Level, including: Daily/Weekly/Monthly/YE Level, Activity Level, Project Level, or Grouped Level This Sounds like a lot of work…But its not
  • 8.
    www.construxsolutions.com 8 WHAT CANYOU DO WITH DAILY DATA?  Assess Performance (Schedule, Manpower, Cost) on Micro and Macro Levels  Assess Delay/Interruption on Micro and Macro Levels  Calculate Resultant Cost Overruns on Micro and Macro Levels  Determine Causation for Manpower Overruns and Delay  Predict Potential Duration Variances on Future Activities  Pinpoint and Correct issues before they become Costly Problems  Prepare Mitigation Strategies based on REAL Knowledge/Information  Risk Adjust Schedule to: ̶ Forecast Future Critical Path Delays ̶ Understand Activities/Areas with Heightened Sensitivity Levels (as it relates to the threat of delay and budget overruns) ̶ Estimate Realistic Completion Date
  • 9.
  • 10.
    www.construxsolutions.com 10 DAILY PROGRESSREPORTS Data Usually Recorded in Daily Report • Date • Weather • Project Name/Number • Description of Work Performed • Significant Events/Impacts • Manpower Reports • Equipment Reports • Percent Complete Where does the Most Comprehensive Set of Data come from?
  • 11.
    www.construxsolutions.com 11 HOW CANWE ANALYZE PERFORMANCE USING THIS DATA?  Resource Loaded Schedules are a Must  Build a detailed As-Built schedule  Goal 1: Compare Planned vs Actual Manpower for each activity  Goal 2: Compare Planned vs Actual Duration for each activity  Pinpoint variances and calculate resultant costs  Assess causation for variances  Document this knowledge and manage accordingly Performance Analysis Daily Reports (As Built Data) Schedule/ Resource Plan
  • 12.
    www.construxsolutions.com 12 THE AS-BUILTSCHEDULE A historical depiction of the project, such that anyone can revisit any area of the project, at any historical point in time, and understand exactly what was going on at that moment. A tool that enables project/field management to: 1. Understand Delay Issues 2. Understand Manpower overruns 3. Assess Performance 4. Pinpoint impacting issues 5. Resolve issues and overcoming delays/overruns
  • 13.
    www.construxsolutions.com 13  IsAn Organized and Visual Database that will: ̶ Help Lower the Risk of Project Delays ̶ Help Lower the Risk of Budget Overruns ̶ Provide Transparency of Project Issues and Resultant Impacts ̶ Enable Contractors to Prove Impacts Out of Their Control ̶ Enable Contractors to Learn from their own Mistakes ̶ Provide Better Overall Knowledge of Project  Minimizes the Chance of a Dispute  Will Result in Better Margins/Returns through Accountability THE AS-BUILT SCHEDULE
  • 14.
    www.construxsolutions.com 14 GOALS OFAN AS-BUILT SCHEDULE 1. Becomes the basis for comparison against the original project plan 2. Have the ability to assess variances for all activities for manpower, time, material, work performed, equipment and cost. 3. Enables project management to understand who was working where and when, what were they doing, what kind of progress was made and what impacted progress. 4. To relate project correspondence to work activities in order to better understand causation for deviations. 5. To perform better with these insights. 6. To be paid what is legitimately owed to you.
  • 15.
    www.construxsolutions.com 15 Useful Documentsin Generating a Robust As-Built Schedule  Detailed “Daily” Work Reports  Equipment Logs  Timesheets  Project Photo’s  Project Schedules  Payment Applications  Weekly/Monthly Progress Reports  Change Order’s / Logs  Material Delivery Reports/Logs  Inspection Reports / Logs  RFI’s / Logs  Submittal’s / Logs  Project Letters/Correspondence Impact Analysis Causation Analysis
  • 16.
  • 17.
    www.construxsolutions.com 17 Case Study: Buildingand Analyzing an As-Built Schedule
  • 18.
    www.construxsolutions.com 18 STEPS 1. Locatethe approved baseline schedule 2. Create a visual basis for comparison 3. Log/track actual data for all days worked across all activities 4. Cross Reference Visual with Database 5. Study variances between planned and actual data 6. Highlight significant variances and study causation 7. Respond in the appropriate manner
  • 19.
    www.construxsolutions.com 19 SETTING UPTHE AS PLANNED SCHEDULE INTO A VISUAL DATABASE STEP 1: SETTING UP PLANNED SCHEDULE IN A DATABASE PROGRAM
  • 20.
    www.construxsolutions.com 20 ADDING DAILYREPORT DATA INTO A VISUAL DATABASE
  • 21.
    www.construxsolutions.com 21 CONVERTING DAILYREPORT DATA INTO PERFORMANCE METRICS STEP 3: STUDY/COMPARE METRICS
  • 22.
    www.construxsolutions.com 22 0 5 10 15 20 25 30 1 23 4 5 6 7 8 9 10 11 12 13 14 15 16 17 18 19 20 21 22 23 24 25 26 27 28 29 30 31 32 33 34 35 36 37 38 39 40 41 42 43 44 45 46 47 Total Planned MP Total Actual MP Manpower Histogram (Planned vs. Actual) CONVERTING DAILY REPORT DATA INTO PERFORMANCE METRICS
  • 23.
    www.construxsolutions.com 23 0 50 100 150 200 250 300 350 400 450 1 23 4 5 6 7 8 9 10 11 12 13 14 15 16 17 18 19 20 21 22 23 24 25 26 27 28 29 30 31 32 33 34 35 36 37 38 39 40 41 42 43 44 45 46 47 Cumulative Planned MP Cumulative Actual MP Cumulative Manpower Curve (Planned vs. Actual) CONVERTING DAILY REPORT DATA INTO PERFORMANCE METRICS
  • 24.
    www.construxsolutions.com 24 ADDITIONAL COMMENTS 1.This is a very simple example 2. Ways to make a more complex version more simple:  Summarize the Schedule to a Level 1 or 2 version  Incorporate a process of capturing data every day 3. If this is performed in real time, risk analysis can be easily incorporated 4. This is definitely useful in avoiding disputes
  • 25.
    www.construxsolutions.com 25 WHY ISTHIS MY RECOMMENDED APPROACH… • Because looking at things as it relates to the schedule just makes sense… – The schedule is the vehicle for managing labor, equipment and materials in construction; – If you don’t align cost with the plan, it becomes “apples to oranges” (more difficult) when reviewing variances, delays and overruns; – If you just study cost, you will only know that you have cost variances, you won’t be certain as to why. If you don’t know why, with certainty, you remain at risk. – Daily Reports can easily align with the schedule, because that is how projects are essentially managed; – At the schedule level, data can be studied in “bite size” chunks, which is enough not get bogged down, overwhelmed or confused by multiple ongoing issues; Once complete, it can be summarized; • It’s a process that is proven to work… ‒ It’s how people are successful in delay, impact and inefficiency analysis ‒ It’s how people are successful in predicting future durations, labor & equipment overruns, end dates, impacts, critical path’s, outcomes; The things that drive cost.
  • 26.
    www.construxsolutions.com 26 DISPUTE AVOIDANCE Study the As-Built, Understand issues on Granular Levels  Discuss Delays and Causation with Stakeholders  Collaborate in Order to Mitigate Realistically  Incorporate Issues into the Schedule Update  Work towards Resolution in Real Time
  • 27.
    www.construxsolutions.com 27 PRESENTED BY:MICHAEL PINK Contact Info: C: 404 277 4387 O: 404 329 3000 mpink@construxsolutions.com Feel free to contact me directly if you have any additional questions Sign up for our upcoming courses: — CPM Scheduling Best Practices — Data Management and Performance Analysis — Delay Analysis in Construction — Construction Claims Review/Prep Follow us on LinkedIn for more info.