SlideShare a Scribd company logo
Prepared by


Mobile Email Opens Report
1st Half of 2012


 50%


 40%

                                                     36%


 30%
                                        27%


 20%                       20%


               13%

 10%


              Q4 2010   Q1/Q2 2011   Q3/Q4 2011   Q1/Q2 2012
Mobile Email Opens Report | 1st Half 2012 | © 2012 Knotice, Ltd. All Rights Reserved | www.knotice.com | 1-800-801-4194 Page 1


 Mobile Email Opens Report
 1st Half 2012
 By Knotice
 September 2012

 About This Report
 Knotice (pronounced “notice”) provides advanced data management to support highly targeted marketing
 communications through today’s primary direct digital channels of email, mobile, online advertising and the Web. As a
 result of Knotice’s native unified platform capabilities, the company is also able to offer an advanced level of actionable
 analytics, deriving key insights on timely and relevant topics – in this case, the degree of email open activity occurring
 on mobile devices for permission-based email marketing campaigns.

 As with Knotice’s previous Mobile Email Opens Reports, the mobile email open rate is a measurement of email opens
 occurring on mobile devices (including phones and tablets) compared to the opens occurring on desktop computers
 (including laptops). The mobile email open rate is not a measurement of mobile email opens compared to all emails
 delivered. This Mobile Email Opens Report for the first half of 2012 (Q1/Q2) has been updated to document not only
 the rate of email opens occurring on mobile devices in the U.S. (with differentiation between mobile phone and tablet
 activity), we also take a close look at open rates based on hours after the time of send.

 Also included are mobile click-rate metrics by device. Tracking the share of opens occurring on mobile devices is a
 specific metric not widely found in the email marketing industry. Supplementing the open metrics with click data offers
 us a clearer picture of how mobile users are truly engaging with email – from the initial decision to open the email, to
 the very important decision to take action on the message. The mobile click rate we are including in this report is a
 measurement of email clicks occurring on mobile devices compared to the email opens occurring on mobile devices.
 This equates to the click-to-open (CTO) rate with which email marketers are well versed.

 As you review the data, it’s important to note how an email open is recorded as mobile, which is based on downloading
 email images. Image download (i.e., “show images”) is not always a default setting for every operating system
 (including some Android devices) or mobile email client. This means the reported number of opens may be lower than
 the actual number of users viewing or reading the email. Data collected over time allows for benchmarks for
 comparison.


 Overall mobile email opens by device and operating system (OS)
 The following represents the percentage of all email opens occurring by mobile operating system (OS) or mobile
 device, based on a composite cross sampling of approximately 807 million emails sent across 11 industry segments in
 the first 6 months of 2012. In this report, mobile devices have been broken down into two distinct categories: “phones”
 and “tablets.” Email opens occurring on phones continue to outpace those occurring on tablets by roughly 3 to 1, with
 mobile phones representing 25.85% of all email opens and tablets 10.16%.

 This first table includes percentages for phone, tablet and desktop email opens in Q1 and Q2 2012. The following rows
 reference similar percentages in Q3 and Q4 2011, the first half of 2011 as well as Q4 2010, for comparison.


                               Phones – Q1/Q2 2012                                   Tablets – Q1/Q2 2012            Desktop

      iPhone   Android   BlackBerry   Palm    Windows     Other     Total    iPad    Android    Other       Total     Total

      19.71%    5.88%      0.02%      0.04%    0.06%     0.14%     25.85%    9.63%    0.43%     0.10%       10.16%   63.99%
Mobile Email Opens Report | 1st Half 2012 | © 2012 Knotice, Ltd. All Rights Reserved | www.knotice.com | 1-800-801-4194 Page 2


                                            Phones – Q3/Q4 2011                                               Tablets – Q3/Q4 2011                   Desktop

            iPhone      Android     BlackBerry       Palm      Windows         Other     Total         iPad      Android     Other        Total       Total

            15.69%      4.69%            0.02%       0.12%        0.02%        0.09%     20.63%       6.54%      0.17%      0.05%         6.76%      72.61%

                                                   Mobile - Q1/Q2 2011                                                       Desktop - Q1/Q2 2011

               iPhone             iPad       Android        Windows       BlackBerry   Palm       Total            Windows        Mac       Linux      Total

               12.78%             3.92%          3.15%       0.05%          0.01%      0.22%      20.13%           65.72%        13.87%     0.17%     79.76%

                                                    Mobile - Q4 2010                                                             Desktop - Q4 2010

               iPhone             iPad       Android        Windows       BlackBerry   Palm       Total            Windows        Mac       Linux      Total

                8.74%             2.00%          1.92%       0.31%          0.15%      0.25%      13.37%           70.27%        16.19%     0.18%     86.64%


 Mobile opens jump to 36% of all email opens in early 2012
 In the first half of 2012, steady growth in mobile email open rates continued. During that time, 36.01% of all emails
 were opened on a mobile device (phones and/or tablets), which is an increase of 32% from late 2011 numbers of
 27.39%. This shows the steady, strong increase in mobile open rates continues, which lends further evidence to the
 accelerating rate of mobile adoption as previously forecast.

   Percentages of Emails Opened                                    % on Mobile                        % on Desktop

       st
   1 Half 2012 Opens                                                  36.01%                            63.99%
       nd
   2        Half 2011 Opens                                           27.39%                            72.61%
       st
   1 Half 2011 Opens                                                  20.24%                            79.76%


 Mobile is a dynamic environment made up of different combinations of devices, OS, and browsers. Although the
 above chart is technically blending mobile devices (iPhone and iPad) with operating systems (Android), we believe this
 is the most intuitive and useful way to look at the data for summary purposes.


 iOS continues to dominate mobile opens
 Mobile devices using iOS continue to dominate overall mobile email activity. In the first half of 2012, the iPhone and
 iPad represented 29.34% of all email opens, compared with less than 5% of all opens occurring on Android phones or
 tablets. While the share of email opens occurring on Android devices did increase, the overall email open activity
 doesn’t quite map to the operating system’s high adoption rate and number-one market position. This can be attributed
 to the manner in which a mobile open is recorded based on images downloaded as mentioned earlier.

   Operating Systems                                     Phone                             Tablets                       Total

   iOS                                                   19.71%                               9.63%                   29.34%

   Android                                               5.88%                                0.43%                    6.31%

 iOS and Android, the two dominant mobile operating systems in the US, account for 99.19% of all mobile email opens.
 The remaining tables included in this report will display only the iOS and Android operating system data, unless
 otherwise noted.
Mobile Email Opens Report | 1st Half 2012 | © 2012 Knotice, Ltd. All Rights Reserved | www.knotice.com | 1-800-801-4194 Page 3


 Mobile email opens by industry:
 Retail and consumer services see highest mobile engagement
 Among the industry categories tracked in this report, Consumer Services and Financial Services saw the highest
 mobile open rates overall.

   Email Opens Q1/Q2       Percent of All Email Opens: Phones        Percent of All Email Opens: Tablets      % Desktop

   BY INDUSTRY             iPhone        Andoid         Total       iOS           Android           Total       Total

   Association            14.66%         2.37%         17.03%      6.62%           0.15%            6.77%      76.20%

   B2B                    11.43%         2.33%         13.76%      2.43%           0.11%            2.54%      83.70%

   Cable & Telco          19.71%         6.00%         25.71%      9.71%           0.43%           10.14%      64.15%

   Consumer Products      17.90%         4.85%         22.75%      6.13%           0.29%            6.42%      69.83%

   Consumer Services      23.79%         10.20%        33.99%      7.77%           0.41%            8.18%      57.83%

   Education              19.92%         3.00%         22.92%      9.02%           0.22%            9.24%      67.84%

   Entertainment          18.86%         7.62%         26.48%      6.20%           0.62%            6.82%      66.07%

   Financial Services     25.82%         6.90%         32.72%      6.98%           0.43%            7.41%      59.87%

   Health Care            11.45%         2.15%         13.60%      2.38%           0.10%            2.48%      83.92%

   Hospitality            19.74%         4.04%         23.78%      9.68%           0.47%           10.15%      66.07%

   Retail                 20.39%         4.04%         24.43%     10.65%           0.48%           11.13%      64.44%


 Breaking down the mobile email opens data by industry segment provides some interesting insights. Categories such
 as Consumer Products (29.17%, up from 20.83%), Retail (35.56%, up from 28.42%), Cable & Telco (35.85%, up from
 27.52%), Consumer Services (42.17%, up from 35.39%) and Entertainment (33.30%, up from 27.24%) saw significant
 increases in mobile open rates when compared to the second half of 2011. It’s important to note how much customer
 behavior and the brand relationship influences the penetration of mobile by segment.


 Mobile email click activity by industry
 The chart below displays the ratio of all email clicks occurring across phone, tablet and desktop platforms, relative to
 the email open rates for each. It also displays the comparative click-to-open (CTO) rates, which is the ratio of unique
 clicks as a percentage of unique opens.

 For those unfamiliar with the concepts of CTOs and click-thru rates (CTR), the CTO rate is expressed as a percentage
 of unique click-thrus on links within an email to the total number of unique opens of that email. This helps marketers
 measure the relative effectiveness of the content of an email message in driving targeted traffic to the brand’s website
 or landing page. The click-thru rate (CTR) is the ratio (or percentage) of unique clicks on links within an email to the
 total number of messages delivered. CTO compares to number of opens while CTR compares to number of emails
 sent.

 Much like mobile open rates, the click-thru rates for phones and tablets have increased dramatically over the last half-
 year. However, it is clear the share of email clicks occurring on phones and tablets (and the respective CTO rates) lag
 far behind the desktop platform. The clear majority of email clicks are still occurring on desktop devices. Percentages
 in the table below reflect all devices and types.
Mobile Email Opens Report | 1st Half 2012 | © 2012 Knotice, Ltd. All Rights Reserved | www.knotice.com | 1-800-801-4194 Page 4


   Q1/Q2 2012             Email Click Activity on Phones *   Email Click Activity on Tablets *   Email Click Activity on Desktop

   BY INDUSTRY           % Opens     % Clicks     CTO%       % Opens      % Clicks     CTO%      % Opens     % Clicks    CTO%

   Association             17.14%      7.34%       8.64%      6.83%         3.87%      11.44%    76.02%       88.79%     23.57%

   B2B                     13.86%      4.55%       4.12%      2.56%         1.03%      5.06%     83.57%       94.42%     14.18%

   Cable & Telco           26.03%     16.50%       5.51%      10.25%        7.20%      6.11%     63.73%       76.30%     10.42%

   Consumer Products       23.10%     15.15%      12.28%      6.50%         4.83%      13.90%    70.41%       80.03%     21.28%

   Consumer Services       34.45%     23.88%       5.71%      8.36%         4.72%      4.66%     57.19%       71.40%     10.29%

   Education               23.40%      9.38%       2.17%      9.34%         7.69%      4.46%     67.26%       82.93%     6.68%

   Entertainment           27.06%     15.70%       6.73%      7.01%         4.78%      7.91%     65.93%       79.52%     14.00%

   Financial Services      32.97%     20.21%      15.01%      7.54%         6.71%      21.80%    59.50%       73.08%     30.07%

   Health Care             13.68%      4.87%       9.47%      2.50%         1.07%      11.39%    83.82%       94.06%     29.86%

   Hospitality             24.12%     14.76%      10.34%      10.24%        6.78%      11.19%    65.65%       78.47%     20.21%

   Retail                  24.70%     13.83%       7.77%      11.22%        6.67%      8.26%     64.08%       79.50%     17.23%
                 * Percentages based on all device types measured, not exclusively Android and iOS. 


 It is interesting to note that the CTO rates are relatively consistent between phone and tablet platforms, at least in
 comparison to the CTO rates for desktop, which are often twice as high.

 We can still attribute the lag in mobile and tablet click rates to the fact that most email marketers are not yet optimizing
 email content for mobile users. Optimization for mobile devices should include everything from how the email renders
 for mobile devices to streamlining text, making calls-to-action and buttons extremely clear, and more. When more
 email marketers begin employing tactics such as these in their mobile optimization efforts, we can expect to see click
 rates on mobile devices begin to climb.

 A look at the trends and it’s obvious that email is rapidly approaching the point when mobile email opens exceed those
 opened on desktop. It’s worth noting that 36% of emails from retailers are opened exclusively on mobile, so it’s obvious
 that mobile optimization remains a priority. We anticipate that percentage of mobile opens to increase as device
 adoption rates continue to climb.


 Approaching the “mobile tipping point”
 With the overall share of email opens occurring on mobile now at 36% across all industries (increasing from 27% six
 months ago), it is our projection that the share of mobile opens will exceed 50% for most marketers within the next 6 to
 12 months. Considering most brands included in this study are not actively optimizing their programs or designing
 emails with mobile users in mind, overall program and campaign performance may be negatively impacted more and
 more with each passing month. It is imperative that email and mobile marketers begin planning with urgency for that
 point in time when mobile users will be the majority audience.

 Case in point: Retail fashion apparel brand
 Several brands within our study have already passed the mobile tipping point. For one apparel retailer joining the study
 in 2012, they quickly discovered that over 60% of all their email opens are on mobile devices. In fact, the total number
 of opens from iPhone and iPod devices (38.5%) is greater than the number of opens from desktop computers (37.5%),
 while another 16% of opens are from Android phones. This retailer has just learned that their traditional desktop-
 minded approach to email design is upside-down, based on strategies defined around what is now a minority
 audience.
Mobile Email Opens Report | 1st Half 2012 | © 2012 Knotice, Ltd. All Rights Reserved | www.knotice.com | 1-800-801-4194 Page 5


 When are mobile opens occurring?
 Share of mobile opens by time of day
 As illustrated in previous versions of this report, there is a clear and continuing trend as to the hours of the day when
 mobile email open activity is higher. The share of email opens occurring on mobile devices spikes during evening, late
 night and early morning hours. Simply put, users shut down their computers during the evening and are picking up
 their tablets or reading email on their phones in the after-dinner hours. Once the workday begins, computers are back
 in greater use.

 The trend has not changed noticeably during the early half of 2012. Familiar spikes in tablet open activity during prime-
 time hours and phone open activity later at night and in the early morning are seen here. However, the spikes in mobile
 open activity do not necessarily correspond with the times when overall open volume (including desktop) is at its
 highest, indicated by the thin light-blue line in the chart below. It also indicates that there are three clear periods of the
 day where open activity is highest: start of workday, following lunch, and after dinner/primetime. Only in the last case
 do those spikes in overall open volume coincide with increases in mobile open activity.


 Mobile opens by time after email delivery
 Instead of looking at mobile open activity in an absolute sense by time of day, we also looked at the share of opens
 occurring on mobile devices based on the hours immediately after the email was sent. It should come as little surprise
 that the share of opens occurring on phones is higher in the few hours immediately following delivery.

 Looking at this from a slightly different angle, we can also see that the distribution of opens occurring on phones is
 more heavily concentrated within the first 3 hours following email delivery, falling off quickly before falling in line with
 the distribution trend of desktop and tablet opens.

 The first chart below shows the percentage of opens by device type within the hours after a send. Knotice data reveals
 email engagement by phone is significantly higher in the first 90 minutes, with negligible differences between phone,
 tablet and desktop email engagement after approximately 5 hours.

 The second chart below shows that for 100% of the opens taking place, what percentage of those open occur on each
 device as the clock ticks, post send. In today’s crowded inbox, timing can be significant. Marketers need to use their
 data to establish the best hour for their sends, which can be unique to each audience or segment.
Mobile Email Opens Report | 1st Half 2012 | © 2012 Knotice, Ltd. All Rights Reserved | www.knotice.com | 1-800-801-4194 Page 6
Mobile Email Opens Report | 1st Half 2012 | © 2012 Knotice, Ltd. All Rights Reserved | www.knotice.com | 1-800-801-4194 Page 7


 The Myth of Multiple Opens
 In past reports, we’ve consistently debunked a historically common assertion that people would use their mobile inbox
 as a filter of sorts and save emails to revisit on their desktop later. Consumers today see a subject line. If they open it,
 they want to act on whatever call to action is presented to them. If they don’t act in that moment, our data shows only
 about 2% will reopen that email on another device – whether on their desktop device, smartphone, or tablet. For this
 analysis we isolated the Retail industry segment. This data shows that nearly 98% of the cases the email open is
 occurring on only one type of device (up from nearly 95% just six months ago).

   RETAIL: Individual Email Opens         Percent of Overall Opens

   Desktop Only Opens                               76.51%

   Phone Only Opens                                 14.47%

   Tablet Only Opens                                6.56%

   Same Email: Desktop + Phone + Tablet             0.09%

   Same Email: Desktop + Tablet                     0.53%

   Same Email: Phone + Tablet                       0.40%

   Same Email: Desktop + Phone                      1.44%


 This means that even if you created a compelling subject line and delivered the right offer, if it renders poorly on the
 device or if there isn’t a seamless optimization of the post-click experience, you have missed your window with a
 mobile opener. The impact of immediacy in this case is that they will immediately become “revenue lost.”

 Suggestions for ways to address this “only-one-chance” situation:
     Use optimized email templates or use adaptive design for the device that recipient used the most often;
     Having a device-optimized, focused click-through experience with dynamic content specific to what you
        already know from your direct interaction with that person. (In other words, don’t just redirect to your mobile
        home page, or worse, your .com flash-based splash page);
     Offer easy-to-consume content, messaging, offer redemption and buying;
     Preload forms with as much as you can support. Includes: buying, shipping, and even payment method used.
Mobile Email Opens Report | 1st Half 2012 | © 2012 Knotice, Ltd. All Rights Reserved | www.knotice.com | 1-800-801-4194 Page 8


 Top Phones for Reading Email
 Not surprisingly the iPhone far and away leads the pack representing nearly 77% of all email opens occurring on a
 phone. Perhaps more surprising is that after the iPhone, the iPod Touch* outpaces any other single device. However,
 the bulk of the other top 24 phones represented are Android devices, which added together represent 20% or more of
 all opens on phones.

         Manufacturer            Phone Model (Device Type)       Percent of Opens       CTO Percentage

        Apple                    iPhone                          70.81%                 4.07%

        Apple                    iPod Touch                      5.67%                  3.72%

        HTC                      PC36100                         2.36%                  0.71%

        Motorola                 DroidX                          1.07%                  11.40%

        Samsung                  SPH-D710                        1.02%                  6.73%

        HTC                      Incredible HD                   0.96%                  7.41%

        Samsung                  SGH-T989                        0.83%                  6.14%

        Samsung                  SPH-D700/Epic 4G                0.82%                  7.80%

        Motorola                 DROID RAZR                      0.73%                  13.09%

        HTC                      Desire HD                       0.67%                  0.49%

        Samsung                  SGH-I997 Infuse 4G              0.56%                  7.57%

        HTC                      EVO 3D                          0.55%                  9.28%

        Motorola                 Droid Bionic                    0.49%                  12.61%

        Samsung                  SGH-I727                        0.47%                  5.05%

        HTC                      Droid Incredible                0.45%                  6.88%

        HTC                      Glacier                         0.45%                  0.46%

        Samsung                  SCH-I500                        0.43%                  37.51%

        Samsung                  SGH-T959V                       0.43%                  8.90%

        HTC                      PG06100                         0.41%                  0.43%

        Samsung                  SGH-I777                        0.41%                  4.75%

        HTC                      ADR6350/Droid Incredible 2      0.39%                  0.41%

        Motorola                 Droid2                          0.37%                  11.02%

        Motorola                 Droid X2                        0.30%                  13.82%

        Motorola                 Droid                           0.24%                  10.81%


          * Clearly, the iPod Touch is not a phone; however, we group this device in the phone category
          because the overall user traits are very similar to the iPhone and other smartphones, minus
          the functionality of telephoning.
Mobile Email Opens Report | 1st Half 2012 | © 2012 Knotice, Ltd. All Rights Reserved | www.knotice.com | 1-800-801-4194 Page 9


 Top 10 Tablets for Reading Email
 While it remains true that for the US consumer audience iPad = tablet. The Kindle Fire appears to be on fire – with
 1.94% of all tablet opens, up from 0.31% just six months prior. Nearly 95% of all email opens occurring on a tablet
 device were on the iPad, slipping slightly from 97% in Q3/Q4 2011. When adapting digital tactics for tablets it is
 important to understand the distinctions between larger 10” screen devices, and smaller 7” screen devices.


           Manufacturer             Tablet Model (Device Type)       Percent of Opens      CTO Percentage

          Apple                     iPad                                   94.67%                6.03%

          Amazon                    Kindle Fire                            1.94%                 0.54%

          HP                        TouchPad                               0.69%                 5.53%

          Samsung                   SCH-I800                               0.36%                10.37%

          Samsung                   GT-P7510 Galaxy Tab 10.1               0.36%                14.33%

          Asus                      Eee Pad Transformer                    0.23%                22.83%

          Motorola                  MZ601/Xoom                             0.22%                23.63%

          RIM                       BlackBerry PlayBook                    0.19%                13.76%

          Toshiba                   AT100                                  0.16%                29.65%

          Samsung                   GT-P1000 Galaxy Tab                    0.16%                 8.63%


 Key Report Takeaways for Email and Mobile Marketers:
 How to Prepare for the Mobile Tipping Point
 As noted earlier in this report, for many email marketers the mobile tipping point is close (when email engagement from
 mobile users will outpace that from traditional desktop/PC user), and will likely occur in six to 12 months. For many
 brands, this point has already occurred. Are you prepared? Some key takeaway based on the findings of this report:

           Your brand should be ramping up to a “mobile first” mindset. If your brand has not yet reached the tipping
            point in mobile email engagement, it will soon. How your email subscribers view and consume email content
            has fundamentally changed within the past few years. Every marketer will have to embrace the mobile-majority
            audience or risk continued declines in click and conversion metrics. What does a mobile-first mindset look like?
            Some examples:
                o Altering fundamental design principles to accommodate the unique traits and preferences of mobile
                     users. This can include shorter copy, larger fonts, and clearer calls-to-action as a design priority, as
                     well as large buttons and spacing between text links (to accommodate chubby fingertips). It also may
                     mean embracing alternate “offline” response options, like calling an agent or finding a retail store, to
                     name just a few.
                o Auditing all post-click sites and pages for mobile friendliness and performance. This means applying a
                     similar eye for design and functionality specific to mobile users, with special consideration for location-
                     awareness to help users respond and react based on their location.
                o Create moments of ultimate convenience. For example, if your email is highlighting a specific product
                     or promotion, design your experience around the customer – one that allows the user to buy that
                     product with as few clicks as possible. Don’t drop the user on to the home page of a mobile commerce
                     site and expect them to find the product themselves. Instead, tee up the sale by allowing customers to
                     select that item and go to checkout in just one click.
Mobile Email Opens Report | 1st Half 2012 | © 2012 Knotice, Ltd. All Rights Reserved | www.knotice.com | 1-800-801-4194 Page 10


         Know your mobile audience. If you do not know your mobile engagement stats, your brand is developing
          email engagement and design strategies in the dark. Partner with a technology provider who can provide real-
          time hard data on how many users are engaging with your emails, and on what devices. Know what the people
          in your audience are doing with that email. Even better, partner with a technology provider who can help you
          append mobile-use data and indicators to your subscriber database profiles, allowing you to segment and
          target consistent mobile users with unique content designed around them. Knotice has found that past mobile
          activity – such as the last four consecutive email opens occurring on a smartphone – is a very accurate
          predictor that the next open will also be on the smartphone. With this information you can begin designing and
          testing new types of email content and engagement for a known mobile audience and focus on the art and
          science of email viewed via mobile.

         Email marketers become mobile marketers. When the mobile audience is the majority audience, your email
          marketing team should be spending the majority of their time working and testing on mobile devices. Gaining a
          mobile-first mindset will be difficult if the strategy, planning and execution teams spend most of their time
          behind laptop computers. Instead, understand how mobile users manage a full inbox, the different ways they
          view and evaluate emails and post-click experiences, and the functional limitations they may encounter.


 Get Your Mobile Email Opens
 If you are a marketer and would like to participate in the report, send an email to info@knotice.com with the subject
 “email mobile analysis” and we’ll provide you a snippet to include in your upcoming email campaigns. We will report on
 your data in aggregate for the purposes of this report, and we’ll also provide your results back to you. As you’ll discover
 in this report, having your individual results is critical. Although we look at mobile email opens overall, by industry, time-
 of-day, and geography, nothing has more influence on the mobile activity occurring in your email campaigns than the
 characteristics of your own prospects and customers.


 About Knotice
 Knotice (pronounced "notice") is a leading provider of data management, actionable analytics, and digital messaging
 solutions, headquartered in Akron, Ohio, with offices in Seattle. Our on-demand marketing software and agency
 services help marketers maximize the ROI of their addressable digital marketing – digital communications that are
 addressable to an individual. With our proprietary platform, we pioneered the ability to seamlessly unite customer data,
 analytics and message delivery – all from a single profile-based platform. In addition to technology, Knotice provides a
 comprehensive offering of marketing services, including strategy and planning, agency-style creative services, custom
 development, analytics, advanced reporting, and business intelligence.

 For more information, visit: http://www.knotice.com.

More Related Content

What's hot

Wat de uroloog van mobile technologie zou moeten weten
Wat de uroloog van mobile technologie zou moeten wetenWat de uroloog van mobile technologie zou moeten weten
Wat de uroloog van mobile technologie zou moeten weten
Synappz
 
Umeng insight report china mobile internet 2012 review final
Umeng insight report china mobile internet 2012 review finalUmeng insight report china mobile internet 2012 review final
Umeng insight report china mobile internet 2012 review finalUmeng
 
Mobile phone landscape - India 2015
Mobile phone landscape - India 2015Mobile phone landscape - India 2015
Mobile phone landscape - India 2015
91mobiles
 
OGDC 2014_Vietnam Mobile Internet 2014: A focus in smartphone game and compar...
OGDC 2014_Vietnam Mobile Internet 2014: A focus in smartphone game and compar...OGDC 2014_Vietnam Mobile Internet 2014: A focus in smartphone game and compar...
OGDC 2014_Vietnam Mobile Internet 2014: A focus in smartphone game and compar...ogdc
 
Umeng Data Insight Report 2012 Q2
Umeng Data Insight Report 2012 Q2Umeng Data Insight Report 2012 Q2
Umeng Data Insight Report 2012 Q2Umeng
 
Portrait of a tablet user - MMF OPA - Wave 2 - Juin 2012
Portrait of a tablet user - MMF OPA - Wave 2 - Juin 2012Portrait of a tablet user - MMF OPA - Wave 2 - Juin 2012
Portrait of a tablet user - MMF OPA - Wave 2 - Juin 2012François Avril
 
OGDC 2014 - Vietnam Mobile Internet Overview by mWork Corp
OGDC 2014 - Vietnam Mobile Internet Overview by mWork CorpOGDC 2014 - Vietnam Mobile Internet Overview by mWork Corp
OGDC 2014 - Vietnam Mobile Internet Overview by mWork Corp
MOG Vietnam
 
OPA Portrait od Smartphone User Août 2012
OPA Portrait od Smartphone User Août 2012OPA Portrait od Smartphone User Août 2012
OPA Portrait od Smartphone User Août 2012François Avril
 
The Mobile Market : Singapore's Outlook
The Mobile Market : Singapore's OutlookThe Mobile Market : Singapore's Outlook
The Mobile Market : Singapore's Outlook
Khoon Hiang Goh
 
Millennialmedia MobileMix Q1 2013
Millennialmedia MobileMix Q1 2013Millennialmedia MobileMix Q1 2013
Millennialmedia MobileMix Q1 2013
Sergey Polovnikov
 
UK Mobile Insights Report
UK Mobile Insights ReportUK Mobile Insights Report
UK Mobile Insights Report
We Are Apps
 
Mobile market landscape india
Mobile market landscape  indiaMobile market landscape  india
Mobile market landscape indiaSiddhant Tewari
 
Mobile en cloud wat is de impact op ons huidige it ecosysteem
Mobile en cloud wat is de impact op ons huidige it ecosysteemMobile en cloud wat is de impact op ons huidige it ecosysteem
Mobile en cloud wat is de impact op ons huidige it ecosysteem
Marcel de Vries
 
Vietnam mobile internet_2014_mwork_vietnam_mobile_day
Vietnam mobile internet_2014_mwork_vietnam_mobile_dayVietnam mobile internet_2014_mwork_vietnam_mobile_day
Vietnam mobile internet_2014_mwork_vietnam_mobile_day
AiTi Education
 
Impact 2012 presentation 04 29-12_Steve Drake
Impact 2012 presentation 04 29-12_Steve DrakeImpact 2012 presentation 04 29-12_Steve Drake
Impact 2012 presentation 04 29-12_Steve Drake
Dirk Nicol
 
Sensor tower-q2-2021-data-digest
Sensor tower-q2-2021-data-digestSensor tower-q2-2021-data-digest
Sensor tower-q2-2021-data-digest
MarketingTrips
 
Activating Apps in Market Research - MRMW Singapore 2013
Activating Apps in Market Research - MRMW Singapore 2013Activating Apps in Market Research - MRMW Singapore 2013
Activating Apps in Market Research - MRMW Singapore 2013
Adrian Tan
 
Ericsson ConsumerLab: Wearable technology and the internet of things
Ericsson ConsumerLab: Wearable technology and the internet of thingsEricsson ConsumerLab: Wearable technology and the internet of things
Ericsson ConsumerLab: Wearable technology and the internet of things
Ericsson
 

What's hot (19)

Wat de uroloog van mobile technologie zou moeten weten
Wat de uroloog van mobile technologie zou moeten wetenWat de uroloog van mobile technologie zou moeten weten
Wat de uroloog van mobile technologie zou moeten weten
 
Umeng insight report china mobile internet 2012 review final
Umeng insight report china mobile internet 2012 review finalUmeng insight report china mobile internet 2012 review final
Umeng insight report china mobile internet 2012 review final
 
Mobile phone landscape - India 2015
Mobile phone landscape - India 2015Mobile phone landscape - India 2015
Mobile phone landscape - India 2015
 
Grocery report 2013
Grocery report 2013Grocery report 2013
Grocery report 2013
 
OGDC 2014_Vietnam Mobile Internet 2014: A focus in smartphone game and compar...
OGDC 2014_Vietnam Mobile Internet 2014: A focus in smartphone game and compar...OGDC 2014_Vietnam Mobile Internet 2014: A focus in smartphone game and compar...
OGDC 2014_Vietnam Mobile Internet 2014: A focus in smartphone game and compar...
 
Umeng Data Insight Report 2012 Q2
Umeng Data Insight Report 2012 Q2Umeng Data Insight Report 2012 Q2
Umeng Data Insight Report 2012 Q2
 
Portrait of a tablet user - MMF OPA - Wave 2 - Juin 2012
Portrait of a tablet user - MMF OPA - Wave 2 - Juin 2012Portrait of a tablet user - MMF OPA - Wave 2 - Juin 2012
Portrait of a tablet user - MMF OPA - Wave 2 - Juin 2012
 
OGDC 2014 - Vietnam Mobile Internet Overview by mWork Corp
OGDC 2014 - Vietnam Mobile Internet Overview by mWork CorpOGDC 2014 - Vietnam Mobile Internet Overview by mWork Corp
OGDC 2014 - Vietnam Mobile Internet Overview by mWork Corp
 
OPA Portrait od Smartphone User Août 2012
OPA Portrait od Smartphone User Août 2012OPA Portrait od Smartphone User Août 2012
OPA Portrait od Smartphone User Août 2012
 
The Mobile Market : Singapore's Outlook
The Mobile Market : Singapore's OutlookThe Mobile Market : Singapore's Outlook
The Mobile Market : Singapore's Outlook
 
Millennialmedia MobileMix Q1 2013
Millennialmedia MobileMix Q1 2013Millennialmedia MobileMix Q1 2013
Millennialmedia MobileMix Q1 2013
 
UK Mobile Insights Report
UK Mobile Insights ReportUK Mobile Insights Report
UK Mobile Insights Report
 
Mobile market landscape india
Mobile market landscape  indiaMobile market landscape  india
Mobile market landscape india
 
Mobile en cloud wat is de impact op ons huidige it ecosysteem
Mobile en cloud wat is de impact op ons huidige it ecosysteemMobile en cloud wat is de impact op ons huidige it ecosysteem
Mobile en cloud wat is de impact op ons huidige it ecosysteem
 
Vietnam mobile internet_2014_mwork_vietnam_mobile_day
Vietnam mobile internet_2014_mwork_vietnam_mobile_dayVietnam mobile internet_2014_mwork_vietnam_mobile_day
Vietnam mobile internet_2014_mwork_vietnam_mobile_day
 
Impact 2012 presentation 04 29-12_Steve Drake
Impact 2012 presentation 04 29-12_Steve DrakeImpact 2012 presentation 04 29-12_Steve Drake
Impact 2012 presentation 04 29-12_Steve Drake
 
Sensor tower-q2-2021-data-digest
Sensor tower-q2-2021-data-digestSensor tower-q2-2021-data-digest
Sensor tower-q2-2021-data-digest
 
Activating Apps in Market Research - MRMW Singapore 2013
Activating Apps in Market Research - MRMW Singapore 2013Activating Apps in Market Research - MRMW Singapore 2013
Activating Apps in Market Research - MRMW Singapore 2013
 
Ericsson ConsumerLab: Wearable technology and the internet of things
Ericsson ConsumerLab: Wearable technology and the internet of thingsEricsson ConsumerLab: Wearable technology and the internet of things
Ericsson ConsumerLab: Wearable technology and the internet of things
 

Similar to Mobile Email Opens Report

Inc pres (dma bristol messaging) 24 jun11 v1.0
Inc pres (dma bristol messaging) 24 jun11 v1.0Inc pres (dma bristol messaging) 24 jun11 v1.0
Inc pres (dma bristol messaging) 24 jun11 v1.0
Jason Cross
 
India Smartphone Outlook for 2012 by Convergence Catalyst
India Smartphone Outlook for 2012 by Convergence CatalystIndia Smartphone Outlook for 2012 by Convergence Catalyst
India Smartphone Outlook for 2012 by Convergence Catalyst
Jayanth Kolla
 
CC- India 2012 Smartphones Outlook
CC- India 2012 Smartphones OutlookCC- India 2012 Smartphones Outlook
CC- India 2012 Smartphones Outlook
Convergence Catalyst
 
CASMA Globant Mobile Presentation
CASMA Globant Mobile PresentationCASMA Globant Mobile Presentation
CASMA Globant Mobile Presentation
Andrew Burgert
 
Snapshot of digital India
Snapshot of digital IndiaSnapshot of digital India
Snapshot of digital India
Social Samosa
 
Mobile Commerce: The Mist has cleared
Mobile Commerce: The Mist has clearedMobile Commerce: The Mist has cleared
Mobile Commerce: The Mist has cleared
auexpo Conference
 
MSc Thesis Defense
MSc Thesis DefenseMSc Thesis Defense
MSc Thesis Defense
Sander Buitelaar
 
Industry updates on key mobile trends 8 31 12
Industry updates on key mobile trends 8 31 12Industry updates on key mobile trends 8 31 12
Industry updates on key mobile trends 8 31 12Performics
 
Mobility2013
Mobility2013Mobility2013
Mobility2013
Lee Schlenker
 
Comscore telefonica-connected-europe-2012
Comscore telefonica-connected-europe-2012Comscore telefonica-connected-europe-2012
Comscore telefonica-connected-europe-2012
Luis Alejandro Ramírez Gallardo
 
In mobi network_research_vietnam_q4_2012
In mobi network_research_vietnam_q4_2012In mobi network_research_vietnam_q4_2012
In mobi network_research_vietnam_q4_2012VNPT Technology
 
Vietnam Market Overview Q1 2013
Vietnam Market Overview Q1 2013Vietnam Market Overview Q1 2013
Vietnam Market Overview Q1 2013
Cuong Pham
 
Adobe Digital Index Q2 2013
Adobe Digital Index Q2 2013Adobe Digital Index Q2 2013
Adobe Digital Index Q2 2013
servicesmobiles.fr
 
Spain velti state of mobile advertising-may2013_final
Spain velti state of mobile advertising-may2013_finalSpain velti state of mobile advertising-may2013_final
Spain velti state of mobile advertising-may2013_finalVelti Spain
 
2013 Mobile Consumer Survey Results
2013 Mobile Consumer Survey Results2013 Mobile Consumer Survey Results
2013 Mobile Consumer Survey Results
MARC USA
 
Connected europe smartphones
Connected europe   smartphonesConnected europe   smartphones
Connected europe smartphonesNacho Gutiérrez
 
Connected europe - smartphones
Connected europe - smartphonesConnected europe - smartphones
Connected europe - smartphonesNacho Gutiérrez
 
Digital Index 2022
Digital Index 2022Digital Index 2022
Digital Index 2022
Patricio O'Gorman
 
InMobi Network Research Global: Q1, 2015
InMobi Network Research Global: Q1, 2015InMobi Network Research Global: Q1, 2015
InMobi Network Research Global: Q1, 2015
InMobi
 

Similar to Mobile Email Opens Report (20)

Inc pres (dma bristol messaging) 24 jun11 v1.0
Inc pres (dma bristol messaging) 24 jun11 v1.0Inc pres (dma bristol messaging) 24 jun11 v1.0
Inc pres (dma bristol messaging) 24 jun11 v1.0
 
India Smartphone Outlook for 2012 by Convergence Catalyst
India Smartphone Outlook for 2012 by Convergence CatalystIndia Smartphone Outlook for 2012 by Convergence Catalyst
India Smartphone Outlook for 2012 by Convergence Catalyst
 
CC- India 2012 Smartphones Outlook
CC- India 2012 Smartphones OutlookCC- India 2012 Smartphones Outlook
CC- India 2012 Smartphones Outlook
 
CASMA Globant Mobile Presentation
CASMA Globant Mobile PresentationCASMA Globant Mobile Presentation
CASMA Globant Mobile Presentation
 
Snapshot of digital India
Snapshot of digital IndiaSnapshot of digital India
Snapshot of digital India
 
Mobile Commerce: The Mist has cleared
Mobile Commerce: The Mist has clearedMobile Commerce: The Mist has cleared
Mobile Commerce: The Mist has cleared
 
MSc Thesis Defense
MSc Thesis DefenseMSc Thesis Defense
MSc Thesis Defense
 
Industry updates on key mobile trends 8 31 12
Industry updates on key mobile trends 8 31 12Industry updates on key mobile trends 8 31 12
Industry updates on key mobile trends 8 31 12
 
Mobility2013
Mobility2013Mobility2013
Mobility2013
 
Comscore telefonica-connected-europe-2012
Comscore telefonica-connected-europe-2012Comscore telefonica-connected-europe-2012
Comscore telefonica-connected-europe-2012
 
In mobi network_research_vietnam_q4_2012
In mobi network_research_vietnam_q4_2012In mobi network_research_vietnam_q4_2012
In mobi network_research_vietnam_q4_2012
 
Vietnam Market Overview Q1 2013
Vietnam Market Overview Q1 2013Vietnam Market Overview Q1 2013
Vietnam Market Overview Q1 2013
 
Adobe Digital Index Q2 2013
Adobe Digital Index Q2 2013Adobe Digital Index Q2 2013
Adobe Digital Index Q2 2013
 
Spain velti state of mobile advertising-may2013_final
Spain velti state of mobile advertising-may2013_finalSpain velti state of mobile advertising-may2013_final
Spain velti state of mobile advertising-may2013_final
 
2013 Mobile Consumer Survey Results
2013 Mobile Consumer Survey Results2013 Mobile Consumer Survey Results
2013 Mobile Consumer Survey Results
 
Connected europe smartphones
Connected europe   smartphonesConnected europe   smartphones
Connected europe smartphones
 
Connected europe - smartphones
Connected europe - smartphonesConnected europe - smartphones
Connected europe - smartphones
 
Digital Index 2022
Digital Index 2022Digital Index 2022
Digital Index 2022
 
InMobi Network Research Global: Q1, 2015
InMobi Network Research Global: Q1, 2015InMobi Network Research Global: Q1, 2015
InMobi Network Research Global: Q1, 2015
 
Mobile and Social Relevance for Enterprises
Mobile and Social Relevance for EnterprisesMobile and Social Relevance for Enterprises
Mobile and Social Relevance for Enterprises
 

More from Scott Valentine, MBA, CSPO

@ValaAfshar - 50 Powerful Statistics About Tech MegaTrends Affecting Every Bu...
@ValaAfshar - 50 Powerful Statistics About Tech MegaTrends Affecting Every Bu...@ValaAfshar - 50 Powerful Statistics About Tech MegaTrends Affecting Every Bu...
@ValaAfshar - 50 Powerful Statistics About Tech MegaTrends Affecting Every Bu...
Scott Valentine, MBA, CSPO
 
The Pay-per-Action Model for Online Advertising
The Pay-per-Action Model for Online AdvertisingThe Pay-per-Action Model for Online Advertising
The Pay-per-Action Model for Online Advertising
Scott Valentine, MBA, CSPO
 
Silverpop_7 Emails Marketers Should Automate
Silverpop_7 Emails Marketers Should AutomateSilverpop_7 Emails Marketers Should Automate
Silverpop_7 Emails Marketers Should Automate
Scott Valentine, MBA, CSPO
 
Smartphone Comparison
Smartphone ComparisonSmartphone Comparison
Smartphone Comparison
Scott Valentine, MBA, CSPO
 
A Nation of Serial Switchers
A Nation of Serial SwitchersA Nation of Serial Switchers
A Nation of Serial Switchers
Scott Valentine, MBA, CSPO
 
TV Untethered: Measuring the Shifting Screen
TV Untethered: Measuring the Shifting ScreenTV Untethered: Measuring the Shifting Screen
TV Untethered: Measuring the Shifting Screen
Scott Valentine, MBA, CSPO
 
Marketing Loyalty Report
Marketing Loyalty ReportMarketing Loyalty Report
Marketing Loyalty Report
Scott Valentine, MBA, CSPO
 
The Social CEO: Executives Tell All
The Social CEO: Executives Tell AllThe Social CEO: Executives Tell All
The Social CEO: Executives Tell All
Scott Valentine, MBA, CSPO
 
Email Validation for Improved Deliverability and Marketing Results
Email Validation for Improved Deliverability and Marketing ResultsEmail Validation for Improved Deliverability and Marketing Results
Email Validation for Improved Deliverability and Marketing Results
Scott Valentine, MBA, CSPO
 
The Social Media ROI Cookbook
The Social Media ROI CookbookThe Social Media ROI Cookbook
The Social Media ROI Cookbook
Scott Valentine, MBA, CSPO
 
AMA_Corporate Attitudes and Adoption Trends of Multi-Channel and Omni-Channel...
AMA_Corporate Attitudes and Adoption Trends of Multi-Channel and Omni-Channel...AMA_Corporate Attitudes and Adoption Trends of Multi-Channel and Omni-Channel...
AMA_Corporate Attitudes and Adoption Trends of Multi-Channel and Omni-Channel...
Scott Valentine, MBA, CSPO
 
Acxiom_LOYALTY IN TODAY’S MARKETPLACE DEMANDS BETTER CONNECTIONS WITH CUSTOMERS
Acxiom_LOYALTY IN TODAY’S MARKETPLACE DEMANDS BETTER CONNECTIONS WITH CUSTOMERSAcxiom_LOYALTY IN TODAY’S MARKETPLACE DEMANDS BETTER CONNECTIONS WITH CUSTOMERS
Acxiom_LOYALTY IN TODAY’S MARKETPLACE DEMANDS BETTER CONNECTIONS WITH CUSTOMERS
Scott Valentine, MBA, CSPO
 
Data Quality and the Customer Experience
Data Quality and the Customer ExperienceData Quality and the Customer Experience
Data Quality and the Customer Experience
Scott Valentine, MBA, CSPO
 
How will 2013 Unfold? Predictions and Premonitions for the Digital Marketer
How will 2013 Unfold? Predictions and Premonitions for the Digital MarketerHow will 2013 Unfold? Predictions and Premonitions for the Digital Marketer
How will 2013 Unfold? Predictions and Premonitions for the Digital Marketer
Scott Valentine, MBA, CSPO
 
Big Brand Strategies for Mobile App Marketing
Big Brand Strategies for Mobile App MarketingBig Brand Strategies for Mobile App Marketing
Big Brand Strategies for Mobile App Marketing
Scott Valentine, MBA, CSPO
 
How New Devices, Networks, and Consumer Habits Will Change the Web Experience
How New Devices, Networks, and Consumer Habits Will Change the Web ExperienceHow New Devices, Networks, and Consumer Habits Will Change the Web Experience
How New Devices, Networks, and Consumer Habits Will Change the Web ExperienceScott Valentine, MBA, CSPO
 
The Digital Media Value Chain: A Path to Content Monetization
The Digital Media Value Chain: A Path to Content MonetizationThe Digital Media Value Chain: A Path to Content Monetization
The Digital Media Value Chain: A Path to Content Monetization
Scott Valentine, MBA, CSPO
 
The Right Time for Real-Time Marketing
The Right Time for Real-Time MarketingThe Right Time for Real-Time Marketing
The Right Time for Real-Time Marketing
Scott Valentine, MBA, CSPO
 

More from Scott Valentine, MBA, CSPO (20)

@ValaAfshar - 50 Powerful Statistics About Tech MegaTrends Affecting Every Bu...
@ValaAfshar - 50 Powerful Statistics About Tech MegaTrends Affecting Every Bu...@ValaAfshar - 50 Powerful Statistics About Tech MegaTrends Affecting Every Bu...
@ValaAfshar - 50 Powerful Statistics About Tech MegaTrends Affecting Every Bu...
 
The Pay-per-Action Model for Online Advertising
The Pay-per-Action Model for Online AdvertisingThe Pay-per-Action Model for Online Advertising
The Pay-per-Action Model for Online Advertising
 
Silverpop_7 Emails Marketers Should Automate
Silverpop_7 Emails Marketers Should AutomateSilverpop_7 Emails Marketers Should Automate
Silverpop_7 Emails Marketers Should Automate
 
Smartphone Comparison
Smartphone ComparisonSmartphone Comparison
Smartphone Comparison
 
A Nation of Serial Switchers
A Nation of Serial SwitchersA Nation of Serial Switchers
A Nation of Serial Switchers
 
TV Untethered: Measuring the Shifting Screen
TV Untethered: Measuring the Shifting ScreenTV Untethered: Measuring the Shifting Screen
TV Untethered: Measuring the Shifting Screen
 
Marketing Loyalty Report
Marketing Loyalty ReportMarketing Loyalty Report
Marketing Loyalty Report
 
The Social CEO: Executives Tell All
The Social CEO: Executives Tell AllThe Social CEO: Executives Tell All
The Social CEO: Executives Tell All
 
Email Validation for Improved Deliverability and Marketing Results
Email Validation for Improved Deliverability and Marketing ResultsEmail Validation for Improved Deliverability and Marketing Results
Email Validation for Improved Deliverability and Marketing Results
 
The Social Media ROI Cookbook
The Social Media ROI CookbookThe Social Media ROI Cookbook
The Social Media ROI Cookbook
 
AMA_Corporate Attitudes and Adoption Trends of Multi-Channel and Omni-Channel...
AMA_Corporate Attitudes and Adoption Trends of Multi-Channel and Omni-Channel...AMA_Corporate Attitudes and Adoption Trends of Multi-Channel and Omni-Channel...
AMA_Corporate Attitudes and Adoption Trends of Multi-Channel and Omni-Channel...
 
AberdeenGroup_Analytics for the CMO
AberdeenGroup_Analytics for the CMOAberdeenGroup_Analytics for the CMO
AberdeenGroup_Analytics for the CMO
 
GameScorpion_ Alternative App Markets
GameScorpion_ Alternative App MarketsGameScorpion_ Alternative App Markets
GameScorpion_ Alternative App Markets
 
Acxiom_LOYALTY IN TODAY’S MARKETPLACE DEMANDS BETTER CONNECTIONS WITH CUSTOMERS
Acxiom_LOYALTY IN TODAY’S MARKETPLACE DEMANDS BETTER CONNECTIONS WITH CUSTOMERSAcxiom_LOYALTY IN TODAY’S MARKETPLACE DEMANDS BETTER CONNECTIONS WITH CUSTOMERS
Acxiom_LOYALTY IN TODAY’S MARKETPLACE DEMANDS BETTER CONNECTIONS WITH CUSTOMERS
 
Data Quality and the Customer Experience
Data Quality and the Customer ExperienceData Quality and the Customer Experience
Data Quality and the Customer Experience
 
How will 2013 Unfold? Predictions and Premonitions for the Digital Marketer
How will 2013 Unfold? Predictions and Premonitions for the Digital MarketerHow will 2013 Unfold? Predictions and Premonitions for the Digital Marketer
How will 2013 Unfold? Predictions and Premonitions for the Digital Marketer
 
Big Brand Strategies for Mobile App Marketing
Big Brand Strategies for Mobile App MarketingBig Brand Strategies for Mobile App Marketing
Big Brand Strategies for Mobile App Marketing
 
How New Devices, Networks, and Consumer Habits Will Change the Web Experience
How New Devices, Networks, and Consumer Habits Will Change the Web ExperienceHow New Devices, Networks, and Consumer Habits Will Change the Web Experience
How New Devices, Networks, and Consumer Habits Will Change the Web Experience
 
The Digital Media Value Chain: A Path to Content Monetization
The Digital Media Value Chain: A Path to Content MonetizationThe Digital Media Value Chain: A Path to Content Monetization
The Digital Media Value Chain: A Path to Content Monetization
 
The Right Time for Real-Time Marketing
The Right Time for Real-Time MarketingThe Right Time for Real-Time Marketing
The Right Time for Real-Time Marketing
 

Recently uploaded

Accelerate your Kubernetes clusters with Varnish Caching
Accelerate your Kubernetes clusters with Varnish CachingAccelerate your Kubernetes clusters with Varnish Caching
Accelerate your Kubernetes clusters with Varnish Caching
Thijs Feryn
 
AI for Every Business: Unlocking Your Product's Universal Potential by VP of ...
AI for Every Business: Unlocking Your Product's Universal Potential by VP of ...AI for Every Business: Unlocking Your Product's Universal Potential by VP of ...
AI for Every Business: Unlocking Your Product's Universal Potential by VP of ...
Product School
 
Epistemic Interaction - tuning interfaces to provide information for AI support
Epistemic Interaction - tuning interfaces to provide information for AI supportEpistemic Interaction - tuning interfaces to provide information for AI support
Epistemic Interaction - tuning interfaces to provide information for AI support
Alan Dix
 
From Siloed Products to Connected Ecosystem: Building a Sustainable and Scala...
From Siloed Products to Connected Ecosystem: Building a Sustainable and Scala...From Siloed Products to Connected Ecosystem: Building a Sustainable and Scala...
From Siloed Products to Connected Ecosystem: Building a Sustainable and Scala...
Product School
 
JMeter webinar - integration with InfluxDB and Grafana
JMeter webinar - integration with InfluxDB and GrafanaJMeter webinar - integration with InfluxDB and Grafana
JMeter webinar - integration with InfluxDB and Grafana
RTTS
 
FIDO Alliance Osaka Seminar: Overview.pdf
FIDO Alliance Osaka Seminar: Overview.pdfFIDO Alliance Osaka Seminar: Overview.pdf
FIDO Alliance Osaka Seminar: Overview.pdf
FIDO Alliance
 
Smart TV Buyer Insights Survey 2024 by 91mobiles.pdf
Smart TV Buyer Insights Survey 2024 by 91mobiles.pdfSmart TV Buyer Insights Survey 2024 by 91mobiles.pdf
Smart TV Buyer Insights Survey 2024 by 91mobiles.pdf
91mobiles
 
When stars align: studies in data quality, knowledge graphs, and machine lear...
When stars align: studies in data quality, knowledge graphs, and machine lear...When stars align: studies in data quality, knowledge graphs, and machine lear...
When stars align: studies in data quality, knowledge graphs, and machine lear...
Elena Simperl
 
De-mystifying Zero to One: Design Informed Techniques for Greenfield Innovati...
De-mystifying Zero to One: Design Informed Techniques for Greenfield Innovati...De-mystifying Zero to One: Design Informed Techniques for Greenfield Innovati...
De-mystifying Zero to One: Design Informed Techniques for Greenfield Innovati...
Product School
 
Knowledge engineering: from people to machines and back
Knowledge engineering: from people to machines and backKnowledge engineering: from people to machines and back
Knowledge engineering: from people to machines and back
Elena Simperl
 
Transcript: Selling digital books in 2024: Insights from industry leaders - T...
Transcript: Selling digital books in 2024: Insights from industry leaders - T...Transcript: Selling digital books in 2024: Insights from industry leaders - T...
Transcript: Selling digital books in 2024: Insights from industry leaders - T...
BookNet Canada
 
Kubernetes & AI - Beauty and the Beast !?! @KCD Istanbul 2024
Kubernetes & AI - Beauty and the Beast !?! @KCD Istanbul 2024Kubernetes & AI - Beauty and the Beast !?! @KCD Istanbul 2024
Kubernetes & AI - Beauty and the Beast !?! @KCD Istanbul 2024
Tobias Schneck
 
To Graph or Not to Graph Knowledge Graph Architectures and LLMs
To Graph or Not to Graph Knowledge Graph Architectures and LLMsTo Graph or Not to Graph Knowledge Graph Architectures and LLMs
To Graph or Not to Graph Knowledge Graph Architectures and LLMs
Paul Groth
 
The Art of the Pitch: WordPress Relationships and Sales
The Art of the Pitch: WordPress Relationships and SalesThe Art of the Pitch: WordPress Relationships and Sales
The Art of the Pitch: WordPress Relationships and Sales
Laura Byrne
 
State of ICS and IoT Cyber Threat Landscape Report 2024 preview
State of ICS and IoT Cyber Threat Landscape Report 2024 previewState of ICS and IoT Cyber Threat Landscape Report 2024 preview
State of ICS and IoT Cyber Threat Landscape Report 2024 preview
Prayukth K V
 
Dev Dives: Train smarter, not harder – active learning and UiPath LLMs for do...
Dev Dives: Train smarter, not harder – active learning and UiPath LLMs for do...Dev Dives: Train smarter, not harder – active learning and UiPath LLMs for do...
Dev Dives: Train smarter, not harder – active learning and UiPath LLMs for do...
UiPathCommunity
 
Bits & Pixels using AI for Good.........
Bits & Pixels using AI for Good.........Bits & Pixels using AI for Good.........
Bits & Pixels using AI for Good.........
Alison B. Lowndes
 
GraphRAG is All You need? LLM & Knowledge Graph
GraphRAG is All You need? LLM & Knowledge GraphGraphRAG is All You need? LLM & Knowledge Graph
GraphRAG is All You need? LLM & Knowledge Graph
Guy Korland
 
UiPath Test Automation using UiPath Test Suite series, part 3
UiPath Test Automation using UiPath Test Suite series, part 3UiPath Test Automation using UiPath Test Suite series, part 3
UiPath Test Automation using UiPath Test Suite series, part 3
DianaGray10
 
Assuring Contact Center Experiences for Your Customers With ThousandEyes
Assuring Contact Center Experiences for Your Customers With ThousandEyesAssuring Contact Center Experiences for Your Customers With ThousandEyes
Assuring Contact Center Experiences for Your Customers With ThousandEyes
ThousandEyes
 

Recently uploaded (20)

Accelerate your Kubernetes clusters with Varnish Caching
Accelerate your Kubernetes clusters with Varnish CachingAccelerate your Kubernetes clusters with Varnish Caching
Accelerate your Kubernetes clusters with Varnish Caching
 
AI for Every Business: Unlocking Your Product's Universal Potential by VP of ...
AI for Every Business: Unlocking Your Product's Universal Potential by VP of ...AI for Every Business: Unlocking Your Product's Universal Potential by VP of ...
AI for Every Business: Unlocking Your Product's Universal Potential by VP of ...
 
Epistemic Interaction - tuning interfaces to provide information for AI support
Epistemic Interaction - tuning interfaces to provide information for AI supportEpistemic Interaction - tuning interfaces to provide information for AI support
Epistemic Interaction - tuning interfaces to provide information for AI support
 
From Siloed Products to Connected Ecosystem: Building a Sustainable and Scala...
From Siloed Products to Connected Ecosystem: Building a Sustainable and Scala...From Siloed Products to Connected Ecosystem: Building a Sustainable and Scala...
From Siloed Products to Connected Ecosystem: Building a Sustainable and Scala...
 
JMeter webinar - integration with InfluxDB and Grafana
JMeter webinar - integration with InfluxDB and GrafanaJMeter webinar - integration with InfluxDB and Grafana
JMeter webinar - integration with InfluxDB and Grafana
 
FIDO Alliance Osaka Seminar: Overview.pdf
FIDO Alliance Osaka Seminar: Overview.pdfFIDO Alliance Osaka Seminar: Overview.pdf
FIDO Alliance Osaka Seminar: Overview.pdf
 
Smart TV Buyer Insights Survey 2024 by 91mobiles.pdf
Smart TV Buyer Insights Survey 2024 by 91mobiles.pdfSmart TV Buyer Insights Survey 2024 by 91mobiles.pdf
Smart TV Buyer Insights Survey 2024 by 91mobiles.pdf
 
When stars align: studies in data quality, knowledge graphs, and machine lear...
When stars align: studies in data quality, knowledge graphs, and machine lear...When stars align: studies in data quality, knowledge graphs, and machine lear...
When stars align: studies in data quality, knowledge graphs, and machine lear...
 
De-mystifying Zero to One: Design Informed Techniques for Greenfield Innovati...
De-mystifying Zero to One: Design Informed Techniques for Greenfield Innovati...De-mystifying Zero to One: Design Informed Techniques for Greenfield Innovati...
De-mystifying Zero to One: Design Informed Techniques for Greenfield Innovati...
 
Knowledge engineering: from people to machines and back
Knowledge engineering: from people to machines and backKnowledge engineering: from people to machines and back
Knowledge engineering: from people to machines and back
 
Transcript: Selling digital books in 2024: Insights from industry leaders - T...
Transcript: Selling digital books in 2024: Insights from industry leaders - T...Transcript: Selling digital books in 2024: Insights from industry leaders - T...
Transcript: Selling digital books in 2024: Insights from industry leaders - T...
 
Kubernetes & AI - Beauty and the Beast !?! @KCD Istanbul 2024
Kubernetes & AI - Beauty and the Beast !?! @KCD Istanbul 2024Kubernetes & AI - Beauty and the Beast !?! @KCD Istanbul 2024
Kubernetes & AI - Beauty and the Beast !?! @KCD Istanbul 2024
 
To Graph or Not to Graph Knowledge Graph Architectures and LLMs
To Graph or Not to Graph Knowledge Graph Architectures and LLMsTo Graph or Not to Graph Knowledge Graph Architectures and LLMs
To Graph or Not to Graph Knowledge Graph Architectures and LLMs
 
The Art of the Pitch: WordPress Relationships and Sales
The Art of the Pitch: WordPress Relationships and SalesThe Art of the Pitch: WordPress Relationships and Sales
The Art of the Pitch: WordPress Relationships and Sales
 
State of ICS and IoT Cyber Threat Landscape Report 2024 preview
State of ICS and IoT Cyber Threat Landscape Report 2024 previewState of ICS and IoT Cyber Threat Landscape Report 2024 preview
State of ICS and IoT Cyber Threat Landscape Report 2024 preview
 
Dev Dives: Train smarter, not harder – active learning and UiPath LLMs for do...
Dev Dives: Train smarter, not harder – active learning and UiPath LLMs for do...Dev Dives: Train smarter, not harder – active learning and UiPath LLMs for do...
Dev Dives: Train smarter, not harder – active learning and UiPath LLMs for do...
 
Bits & Pixels using AI for Good.........
Bits & Pixels using AI for Good.........Bits & Pixels using AI for Good.........
Bits & Pixels using AI for Good.........
 
GraphRAG is All You need? LLM & Knowledge Graph
GraphRAG is All You need? LLM & Knowledge GraphGraphRAG is All You need? LLM & Knowledge Graph
GraphRAG is All You need? LLM & Knowledge Graph
 
UiPath Test Automation using UiPath Test Suite series, part 3
UiPath Test Automation using UiPath Test Suite series, part 3UiPath Test Automation using UiPath Test Suite series, part 3
UiPath Test Automation using UiPath Test Suite series, part 3
 
Assuring Contact Center Experiences for Your Customers With ThousandEyes
Assuring Contact Center Experiences for Your Customers With ThousandEyesAssuring Contact Center Experiences for Your Customers With ThousandEyes
Assuring Contact Center Experiences for Your Customers With ThousandEyes
 

Mobile Email Opens Report

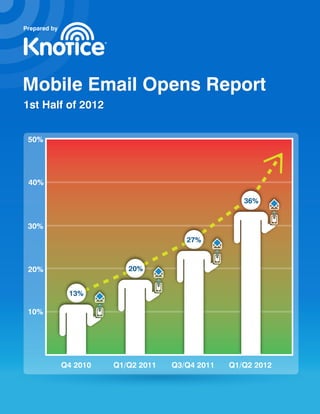
  • 1. Prepared by Mobile Email Opens Report 1st Half of 2012 50% 40% 36% 30% 27% 20% 20% 13% 10% Q4 2010 Q1/Q2 2011 Q3/Q4 2011 Q1/Q2 2012
  • 2. Mobile Email Opens Report | 1st Half 2012 | © 2012 Knotice, Ltd. All Rights Reserved | www.knotice.com | 1-800-801-4194 Page 1 Mobile Email Opens Report 1st Half 2012 By Knotice September 2012 About This Report Knotice (pronounced “notice”) provides advanced data management to support highly targeted marketing communications through today’s primary direct digital channels of email, mobile, online advertising and the Web. As a result of Knotice’s native unified platform capabilities, the company is also able to offer an advanced level of actionable analytics, deriving key insights on timely and relevant topics – in this case, the degree of email open activity occurring on mobile devices for permission-based email marketing campaigns. As with Knotice’s previous Mobile Email Opens Reports, the mobile email open rate is a measurement of email opens occurring on mobile devices (including phones and tablets) compared to the opens occurring on desktop computers (including laptops). The mobile email open rate is not a measurement of mobile email opens compared to all emails delivered. This Mobile Email Opens Report for the first half of 2012 (Q1/Q2) has been updated to document not only the rate of email opens occurring on mobile devices in the U.S. (with differentiation between mobile phone and tablet activity), we also take a close look at open rates based on hours after the time of send. Also included are mobile click-rate metrics by device. Tracking the share of opens occurring on mobile devices is a specific metric not widely found in the email marketing industry. Supplementing the open metrics with click data offers us a clearer picture of how mobile users are truly engaging with email – from the initial decision to open the email, to the very important decision to take action on the message. The mobile click rate we are including in this report is a measurement of email clicks occurring on mobile devices compared to the email opens occurring on mobile devices. This equates to the click-to-open (CTO) rate with which email marketers are well versed. As you review the data, it’s important to note how an email open is recorded as mobile, which is based on downloading email images. Image download (i.e., “show images”) is not always a default setting for every operating system (including some Android devices) or mobile email client. This means the reported number of opens may be lower than the actual number of users viewing or reading the email. Data collected over time allows for benchmarks for comparison. Overall mobile email opens by device and operating system (OS) The following represents the percentage of all email opens occurring by mobile operating system (OS) or mobile device, based on a composite cross sampling of approximately 807 million emails sent across 11 industry segments in the first 6 months of 2012. In this report, mobile devices have been broken down into two distinct categories: “phones” and “tablets.” Email opens occurring on phones continue to outpace those occurring on tablets by roughly 3 to 1, with mobile phones representing 25.85% of all email opens and tablets 10.16%. This first table includes percentages for phone, tablet and desktop email opens in Q1 and Q2 2012. The following rows reference similar percentages in Q3 and Q4 2011, the first half of 2011 as well as Q4 2010, for comparison. Phones – Q1/Q2 2012 Tablets – Q1/Q2 2012 Desktop iPhone Android BlackBerry Palm Windows Other Total iPad Android Other Total Total 19.71% 5.88% 0.02% 0.04% 0.06% 0.14% 25.85% 9.63% 0.43% 0.10% 10.16% 63.99%
  • 3. Mobile Email Opens Report | 1st Half 2012 | © 2012 Knotice, Ltd. All Rights Reserved | www.knotice.com | 1-800-801-4194 Page 2 Phones – Q3/Q4 2011 Tablets – Q3/Q4 2011 Desktop iPhone Android BlackBerry Palm Windows Other Total iPad Android Other Total Total 15.69% 4.69% 0.02% 0.12% 0.02% 0.09% 20.63% 6.54% 0.17% 0.05% 6.76% 72.61% Mobile - Q1/Q2 2011 Desktop - Q1/Q2 2011 iPhone iPad Android Windows BlackBerry Palm Total Windows Mac Linux Total 12.78% 3.92% 3.15% 0.05% 0.01% 0.22% 20.13% 65.72% 13.87% 0.17% 79.76% Mobile - Q4 2010 Desktop - Q4 2010 iPhone iPad Android Windows BlackBerry Palm Total Windows Mac Linux Total 8.74% 2.00% 1.92% 0.31% 0.15% 0.25% 13.37% 70.27% 16.19% 0.18% 86.64% Mobile opens jump to 36% of all email opens in early 2012 In the first half of 2012, steady growth in mobile email open rates continued. During that time, 36.01% of all emails were opened on a mobile device (phones and/or tablets), which is an increase of 32% from late 2011 numbers of 27.39%. This shows the steady, strong increase in mobile open rates continues, which lends further evidence to the accelerating rate of mobile adoption as previously forecast. Percentages of Emails Opened % on Mobile % on Desktop st 1 Half 2012 Opens 36.01% 63.99% nd 2 Half 2011 Opens 27.39% 72.61% st 1 Half 2011 Opens 20.24% 79.76% Mobile is a dynamic environment made up of different combinations of devices, OS, and browsers. Although the above chart is technically blending mobile devices (iPhone and iPad) with operating systems (Android), we believe this is the most intuitive and useful way to look at the data for summary purposes. iOS continues to dominate mobile opens Mobile devices using iOS continue to dominate overall mobile email activity. In the first half of 2012, the iPhone and iPad represented 29.34% of all email opens, compared with less than 5% of all opens occurring on Android phones or tablets. While the share of email opens occurring on Android devices did increase, the overall email open activity doesn’t quite map to the operating system’s high adoption rate and number-one market position. This can be attributed to the manner in which a mobile open is recorded based on images downloaded as mentioned earlier. Operating Systems Phone Tablets Total iOS 19.71% 9.63% 29.34% Android 5.88% 0.43% 6.31% iOS and Android, the two dominant mobile operating systems in the US, account for 99.19% of all mobile email opens. The remaining tables included in this report will display only the iOS and Android operating system data, unless otherwise noted.
  • 4. Mobile Email Opens Report | 1st Half 2012 | © 2012 Knotice, Ltd. All Rights Reserved | www.knotice.com | 1-800-801-4194 Page 3 Mobile email opens by industry: Retail and consumer services see highest mobile engagement Among the industry categories tracked in this report, Consumer Services and Financial Services saw the highest mobile open rates overall. Email Opens Q1/Q2 Percent of All Email Opens: Phones Percent of All Email Opens: Tablets % Desktop BY INDUSTRY iPhone Andoid Total iOS Android Total Total Association 14.66% 2.37% 17.03% 6.62% 0.15% 6.77% 76.20% B2B 11.43% 2.33% 13.76% 2.43% 0.11% 2.54% 83.70% Cable & Telco 19.71% 6.00% 25.71% 9.71% 0.43% 10.14% 64.15% Consumer Products 17.90% 4.85% 22.75% 6.13% 0.29% 6.42% 69.83% Consumer Services 23.79% 10.20% 33.99% 7.77% 0.41% 8.18% 57.83% Education 19.92% 3.00% 22.92% 9.02% 0.22% 9.24% 67.84% Entertainment 18.86% 7.62% 26.48% 6.20% 0.62% 6.82% 66.07% Financial Services 25.82% 6.90% 32.72% 6.98% 0.43% 7.41% 59.87% Health Care 11.45% 2.15% 13.60% 2.38% 0.10% 2.48% 83.92% Hospitality 19.74% 4.04% 23.78% 9.68% 0.47% 10.15% 66.07% Retail 20.39% 4.04% 24.43% 10.65% 0.48% 11.13% 64.44% Breaking down the mobile email opens data by industry segment provides some interesting insights. Categories such as Consumer Products (29.17%, up from 20.83%), Retail (35.56%, up from 28.42%), Cable & Telco (35.85%, up from 27.52%), Consumer Services (42.17%, up from 35.39%) and Entertainment (33.30%, up from 27.24%) saw significant increases in mobile open rates when compared to the second half of 2011. It’s important to note how much customer behavior and the brand relationship influences the penetration of mobile by segment. Mobile email click activity by industry The chart below displays the ratio of all email clicks occurring across phone, tablet and desktop platforms, relative to the email open rates for each. It also displays the comparative click-to-open (CTO) rates, which is the ratio of unique clicks as a percentage of unique opens. For those unfamiliar with the concepts of CTOs and click-thru rates (CTR), the CTO rate is expressed as a percentage of unique click-thrus on links within an email to the total number of unique opens of that email. This helps marketers measure the relative effectiveness of the content of an email message in driving targeted traffic to the brand’s website or landing page. The click-thru rate (CTR) is the ratio (or percentage) of unique clicks on links within an email to the total number of messages delivered. CTO compares to number of opens while CTR compares to number of emails sent. Much like mobile open rates, the click-thru rates for phones and tablets have increased dramatically over the last half- year. However, it is clear the share of email clicks occurring on phones and tablets (and the respective CTO rates) lag far behind the desktop platform. The clear majority of email clicks are still occurring on desktop devices. Percentages in the table below reflect all devices and types.
  • 5. Mobile Email Opens Report | 1st Half 2012 | © 2012 Knotice, Ltd. All Rights Reserved | www.knotice.com | 1-800-801-4194 Page 4 Q1/Q2 2012 Email Click Activity on Phones * Email Click Activity on Tablets * Email Click Activity on Desktop BY INDUSTRY % Opens % Clicks CTO% % Opens % Clicks CTO% % Opens % Clicks CTO% Association 17.14% 7.34% 8.64% 6.83% 3.87% 11.44% 76.02% 88.79% 23.57% B2B 13.86% 4.55% 4.12% 2.56% 1.03% 5.06% 83.57% 94.42% 14.18% Cable & Telco 26.03% 16.50% 5.51% 10.25% 7.20% 6.11% 63.73% 76.30% 10.42% Consumer Products 23.10% 15.15% 12.28% 6.50% 4.83% 13.90% 70.41% 80.03% 21.28% Consumer Services 34.45% 23.88% 5.71% 8.36% 4.72% 4.66% 57.19% 71.40% 10.29% Education 23.40% 9.38% 2.17% 9.34% 7.69% 4.46% 67.26% 82.93% 6.68% Entertainment 27.06% 15.70% 6.73% 7.01% 4.78% 7.91% 65.93% 79.52% 14.00% Financial Services 32.97% 20.21% 15.01% 7.54% 6.71% 21.80% 59.50% 73.08% 30.07% Health Care 13.68% 4.87% 9.47% 2.50% 1.07% 11.39% 83.82% 94.06% 29.86% Hospitality 24.12% 14.76% 10.34% 10.24% 6.78% 11.19% 65.65% 78.47% 20.21% Retail 24.70% 13.83% 7.77% 11.22% 6.67% 8.26% 64.08% 79.50% 17.23% * Percentages based on all device types measured, not exclusively Android and iOS.  It is interesting to note that the CTO rates are relatively consistent between phone and tablet platforms, at least in comparison to the CTO rates for desktop, which are often twice as high. We can still attribute the lag in mobile and tablet click rates to the fact that most email marketers are not yet optimizing email content for mobile users. Optimization for mobile devices should include everything from how the email renders for mobile devices to streamlining text, making calls-to-action and buttons extremely clear, and more. When more email marketers begin employing tactics such as these in their mobile optimization efforts, we can expect to see click rates on mobile devices begin to climb. A look at the trends and it’s obvious that email is rapidly approaching the point when mobile email opens exceed those opened on desktop. It’s worth noting that 36% of emails from retailers are opened exclusively on mobile, so it’s obvious that mobile optimization remains a priority. We anticipate that percentage of mobile opens to increase as device adoption rates continue to climb. Approaching the “mobile tipping point” With the overall share of email opens occurring on mobile now at 36% across all industries (increasing from 27% six months ago), it is our projection that the share of mobile opens will exceed 50% for most marketers within the next 6 to 12 months. Considering most brands included in this study are not actively optimizing their programs or designing emails with mobile users in mind, overall program and campaign performance may be negatively impacted more and more with each passing month. It is imperative that email and mobile marketers begin planning with urgency for that point in time when mobile users will be the majority audience. Case in point: Retail fashion apparel brand Several brands within our study have already passed the mobile tipping point. For one apparel retailer joining the study in 2012, they quickly discovered that over 60% of all their email opens are on mobile devices. In fact, the total number of opens from iPhone and iPod devices (38.5%) is greater than the number of opens from desktop computers (37.5%), while another 16% of opens are from Android phones. This retailer has just learned that their traditional desktop- minded approach to email design is upside-down, based on strategies defined around what is now a minority audience.
  • 6. Mobile Email Opens Report | 1st Half 2012 | © 2012 Knotice, Ltd. All Rights Reserved | www.knotice.com | 1-800-801-4194 Page 5 When are mobile opens occurring? Share of mobile opens by time of day As illustrated in previous versions of this report, there is a clear and continuing trend as to the hours of the day when mobile email open activity is higher. The share of email opens occurring on mobile devices spikes during evening, late night and early morning hours. Simply put, users shut down their computers during the evening and are picking up their tablets or reading email on their phones in the after-dinner hours. Once the workday begins, computers are back in greater use. The trend has not changed noticeably during the early half of 2012. Familiar spikes in tablet open activity during prime- time hours and phone open activity later at night and in the early morning are seen here. However, the spikes in mobile open activity do not necessarily correspond with the times when overall open volume (including desktop) is at its highest, indicated by the thin light-blue line in the chart below. It also indicates that there are three clear periods of the day where open activity is highest: start of workday, following lunch, and after dinner/primetime. Only in the last case do those spikes in overall open volume coincide with increases in mobile open activity. Mobile opens by time after email delivery Instead of looking at mobile open activity in an absolute sense by time of day, we also looked at the share of opens occurring on mobile devices based on the hours immediately after the email was sent. It should come as little surprise that the share of opens occurring on phones is higher in the few hours immediately following delivery. Looking at this from a slightly different angle, we can also see that the distribution of opens occurring on phones is more heavily concentrated within the first 3 hours following email delivery, falling off quickly before falling in line with the distribution trend of desktop and tablet opens. The first chart below shows the percentage of opens by device type within the hours after a send. Knotice data reveals email engagement by phone is significantly higher in the first 90 minutes, with negligible differences between phone, tablet and desktop email engagement after approximately 5 hours. The second chart below shows that for 100% of the opens taking place, what percentage of those open occur on each device as the clock ticks, post send. In today’s crowded inbox, timing can be significant. Marketers need to use their data to establish the best hour for their sends, which can be unique to each audience or segment.
  • 7. Mobile Email Opens Report | 1st Half 2012 | © 2012 Knotice, Ltd. All Rights Reserved | www.knotice.com | 1-800-801-4194 Page 6
  • 8. Mobile Email Opens Report | 1st Half 2012 | © 2012 Knotice, Ltd. All Rights Reserved | www.knotice.com | 1-800-801-4194 Page 7 The Myth of Multiple Opens In past reports, we’ve consistently debunked a historically common assertion that people would use their mobile inbox as a filter of sorts and save emails to revisit on their desktop later. Consumers today see a subject line. If they open it, they want to act on whatever call to action is presented to them. If they don’t act in that moment, our data shows only about 2% will reopen that email on another device – whether on their desktop device, smartphone, or tablet. For this analysis we isolated the Retail industry segment. This data shows that nearly 98% of the cases the email open is occurring on only one type of device (up from nearly 95% just six months ago). RETAIL: Individual Email Opens Percent of Overall Opens Desktop Only Opens 76.51% Phone Only Opens 14.47% Tablet Only Opens 6.56% Same Email: Desktop + Phone + Tablet 0.09% Same Email: Desktop + Tablet 0.53% Same Email: Phone + Tablet 0.40% Same Email: Desktop + Phone 1.44% This means that even if you created a compelling subject line and delivered the right offer, if it renders poorly on the device or if there isn’t a seamless optimization of the post-click experience, you have missed your window with a mobile opener. The impact of immediacy in this case is that they will immediately become “revenue lost.” Suggestions for ways to address this “only-one-chance” situation:  Use optimized email templates or use adaptive design for the device that recipient used the most often;  Having a device-optimized, focused click-through experience with dynamic content specific to what you already know from your direct interaction with that person. (In other words, don’t just redirect to your mobile home page, or worse, your .com flash-based splash page);  Offer easy-to-consume content, messaging, offer redemption and buying;  Preload forms with as much as you can support. Includes: buying, shipping, and even payment method used.
  • 9. Mobile Email Opens Report | 1st Half 2012 | © 2012 Knotice, Ltd. All Rights Reserved | www.knotice.com | 1-800-801-4194 Page 8 Top Phones for Reading Email Not surprisingly the iPhone far and away leads the pack representing nearly 77% of all email opens occurring on a phone. Perhaps more surprising is that after the iPhone, the iPod Touch* outpaces any other single device. However, the bulk of the other top 24 phones represented are Android devices, which added together represent 20% or more of all opens on phones. Manufacturer Phone Model (Device Type) Percent of Opens CTO Percentage Apple iPhone 70.81% 4.07% Apple iPod Touch 5.67% 3.72% HTC PC36100 2.36% 0.71% Motorola DroidX 1.07% 11.40% Samsung SPH-D710 1.02% 6.73% HTC Incredible HD 0.96% 7.41% Samsung SGH-T989 0.83% 6.14% Samsung SPH-D700/Epic 4G 0.82% 7.80% Motorola DROID RAZR 0.73% 13.09% HTC Desire HD 0.67% 0.49% Samsung SGH-I997 Infuse 4G 0.56% 7.57% HTC EVO 3D 0.55% 9.28% Motorola Droid Bionic 0.49% 12.61% Samsung SGH-I727 0.47% 5.05% HTC Droid Incredible 0.45% 6.88% HTC Glacier 0.45% 0.46% Samsung SCH-I500 0.43% 37.51% Samsung SGH-T959V 0.43% 8.90% HTC PG06100 0.41% 0.43% Samsung SGH-I777 0.41% 4.75% HTC ADR6350/Droid Incredible 2 0.39% 0.41% Motorola Droid2 0.37% 11.02% Motorola Droid X2 0.30% 13.82% Motorola Droid 0.24% 10.81% * Clearly, the iPod Touch is not a phone; however, we group this device in the phone category because the overall user traits are very similar to the iPhone and other smartphones, minus the functionality of telephoning.
  • 10. Mobile Email Opens Report | 1st Half 2012 | © 2012 Knotice, Ltd. All Rights Reserved | www.knotice.com | 1-800-801-4194 Page 9 Top 10 Tablets for Reading Email While it remains true that for the US consumer audience iPad = tablet. The Kindle Fire appears to be on fire – with 1.94% of all tablet opens, up from 0.31% just six months prior. Nearly 95% of all email opens occurring on a tablet device were on the iPad, slipping slightly from 97% in Q3/Q4 2011. When adapting digital tactics for tablets it is important to understand the distinctions between larger 10” screen devices, and smaller 7” screen devices. Manufacturer Tablet Model (Device Type) Percent of Opens CTO Percentage Apple iPad 94.67% 6.03% Amazon Kindle Fire 1.94% 0.54% HP TouchPad 0.69% 5.53% Samsung SCH-I800 0.36% 10.37% Samsung GT-P7510 Galaxy Tab 10.1 0.36% 14.33% Asus Eee Pad Transformer 0.23% 22.83% Motorola MZ601/Xoom 0.22% 23.63% RIM BlackBerry PlayBook 0.19% 13.76% Toshiba AT100 0.16% 29.65% Samsung GT-P1000 Galaxy Tab 0.16% 8.63% Key Report Takeaways for Email and Mobile Marketers: How to Prepare for the Mobile Tipping Point As noted earlier in this report, for many email marketers the mobile tipping point is close (when email engagement from mobile users will outpace that from traditional desktop/PC user), and will likely occur in six to 12 months. For many brands, this point has already occurred. Are you prepared? Some key takeaway based on the findings of this report:  Your brand should be ramping up to a “mobile first” mindset. If your brand has not yet reached the tipping point in mobile email engagement, it will soon. How your email subscribers view and consume email content has fundamentally changed within the past few years. Every marketer will have to embrace the mobile-majority audience or risk continued declines in click and conversion metrics. What does a mobile-first mindset look like? Some examples: o Altering fundamental design principles to accommodate the unique traits and preferences of mobile users. This can include shorter copy, larger fonts, and clearer calls-to-action as a design priority, as well as large buttons and spacing between text links (to accommodate chubby fingertips). It also may mean embracing alternate “offline” response options, like calling an agent or finding a retail store, to name just a few. o Auditing all post-click sites and pages for mobile friendliness and performance. This means applying a similar eye for design and functionality specific to mobile users, with special consideration for location- awareness to help users respond and react based on their location. o Create moments of ultimate convenience. For example, if your email is highlighting a specific product or promotion, design your experience around the customer – one that allows the user to buy that product with as few clicks as possible. Don’t drop the user on to the home page of a mobile commerce site and expect them to find the product themselves. Instead, tee up the sale by allowing customers to select that item and go to checkout in just one click.
  • 11. Mobile Email Opens Report | 1st Half 2012 | © 2012 Knotice, Ltd. All Rights Reserved | www.knotice.com | 1-800-801-4194 Page 10  Know your mobile audience. If you do not know your mobile engagement stats, your brand is developing email engagement and design strategies in the dark. Partner with a technology provider who can provide real- time hard data on how many users are engaging with your emails, and on what devices. Know what the people in your audience are doing with that email. Even better, partner with a technology provider who can help you append mobile-use data and indicators to your subscriber database profiles, allowing you to segment and target consistent mobile users with unique content designed around them. Knotice has found that past mobile activity – such as the last four consecutive email opens occurring on a smartphone – is a very accurate predictor that the next open will also be on the smartphone. With this information you can begin designing and testing new types of email content and engagement for a known mobile audience and focus on the art and science of email viewed via mobile.  Email marketers become mobile marketers. When the mobile audience is the majority audience, your email marketing team should be spending the majority of their time working and testing on mobile devices. Gaining a mobile-first mindset will be difficult if the strategy, planning and execution teams spend most of their time behind laptop computers. Instead, understand how mobile users manage a full inbox, the different ways they view and evaluate emails and post-click experiences, and the functional limitations they may encounter. Get Your Mobile Email Opens If you are a marketer and would like to participate in the report, send an email to info@knotice.com with the subject “email mobile analysis” and we’ll provide you a snippet to include in your upcoming email campaigns. We will report on your data in aggregate for the purposes of this report, and we’ll also provide your results back to you. As you’ll discover in this report, having your individual results is critical. Although we look at mobile email opens overall, by industry, time- of-day, and geography, nothing has more influence on the mobile activity occurring in your email campaigns than the characteristics of your own prospects and customers. About Knotice Knotice (pronounced "notice") is a leading provider of data management, actionable analytics, and digital messaging solutions, headquartered in Akron, Ohio, with offices in Seattle. Our on-demand marketing software and agency services help marketers maximize the ROI of their addressable digital marketing – digital communications that are addressable to an individual. With our proprietary platform, we pioneered the ability to seamlessly unite customer data, analytics and message delivery – all from a single profile-based platform. In addition to technology, Knotice provides a comprehensive offering of marketing services, including strategy and planning, agency-style creative services, custom development, analytics, advanced reporting, and business intelligence. For more information, visit: http://www.knotice.com.