Download as PDF, PPTX

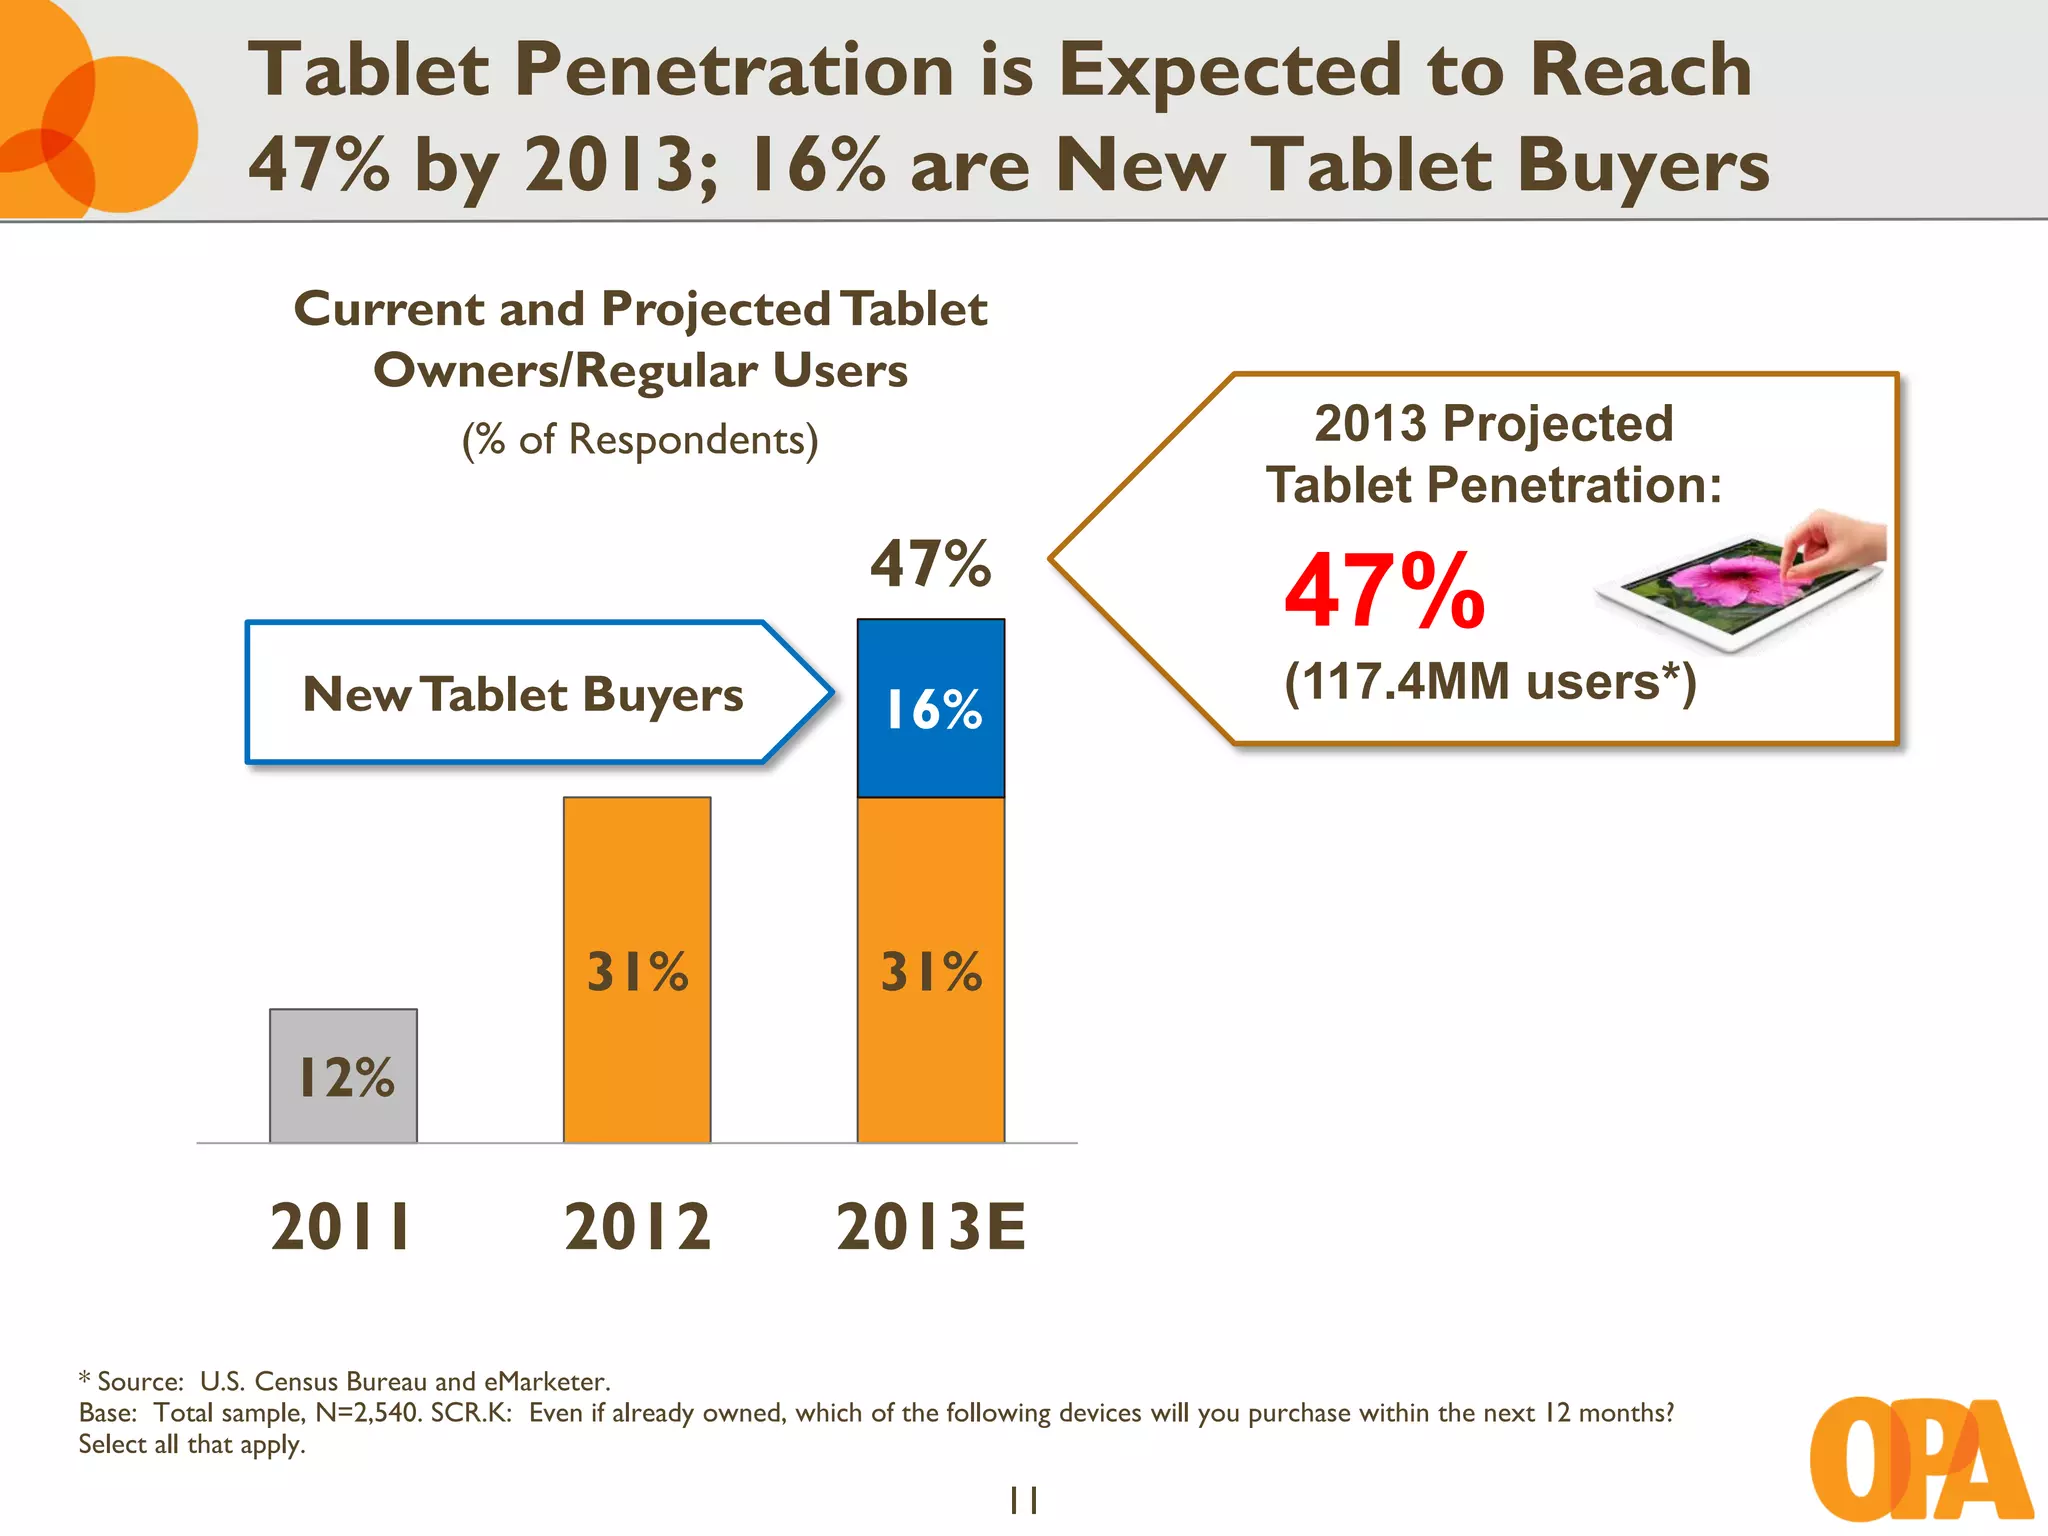
![Tablet Adoption Has Exploded to 31%, Up
From 12% in 2011, Representing 74MM Users
Tablet Owners/Regular Users1
(% of Respondents)
74.1MM
31% Tablet
28.3MM
Users2
Tablet Users2
12%
2011 2012
[1]: 94% of 758 “tablet users” sampled indicate that they “own” their tablets; however, the bulk of this survey will focus more on the broader “tablet user” base.
[2]: Based on estimated U.S. Internet population data (ages 8-64) from the U.S. Census Bureau and eMarketer.
Base: Total sample, N=2,482. SCR.I and SCR.J: Which of the following do you own or use regularly? Select all that apply.
6](https://image.slidesharecdn.com/mmf-opa-portraitoftabletuser-wave2-jun12public-120927133202-phpapp02/75/Portrait-of-a-tablet-user-MMF-OPA-Wave-2-Juin-2012-7-2048.jpg)
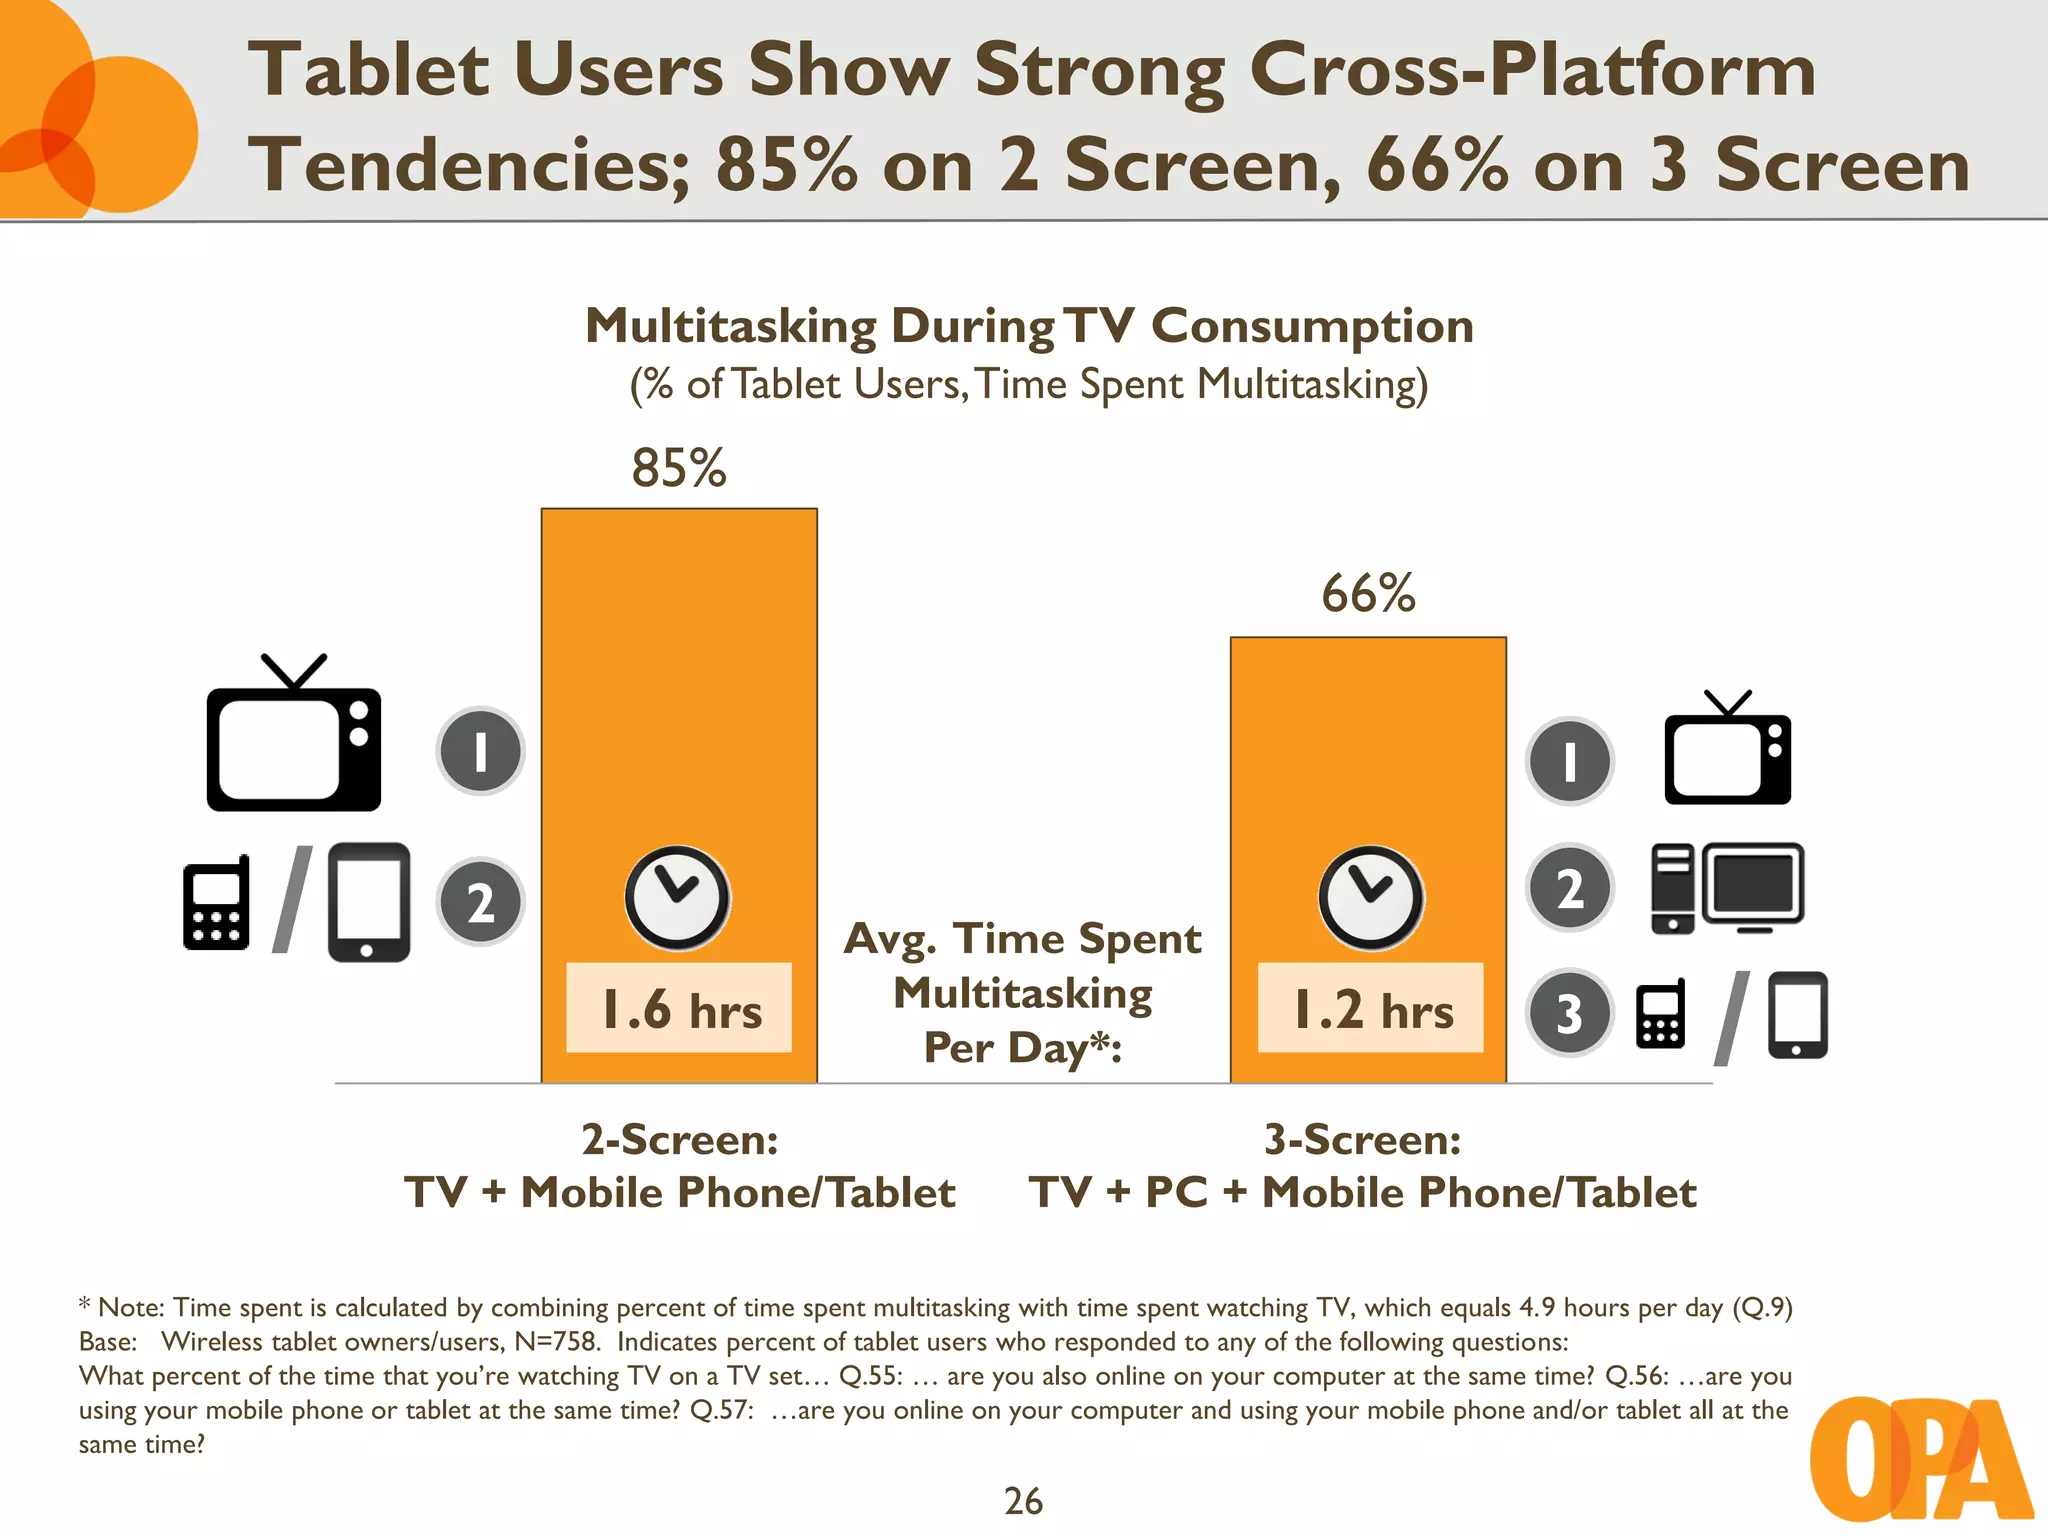
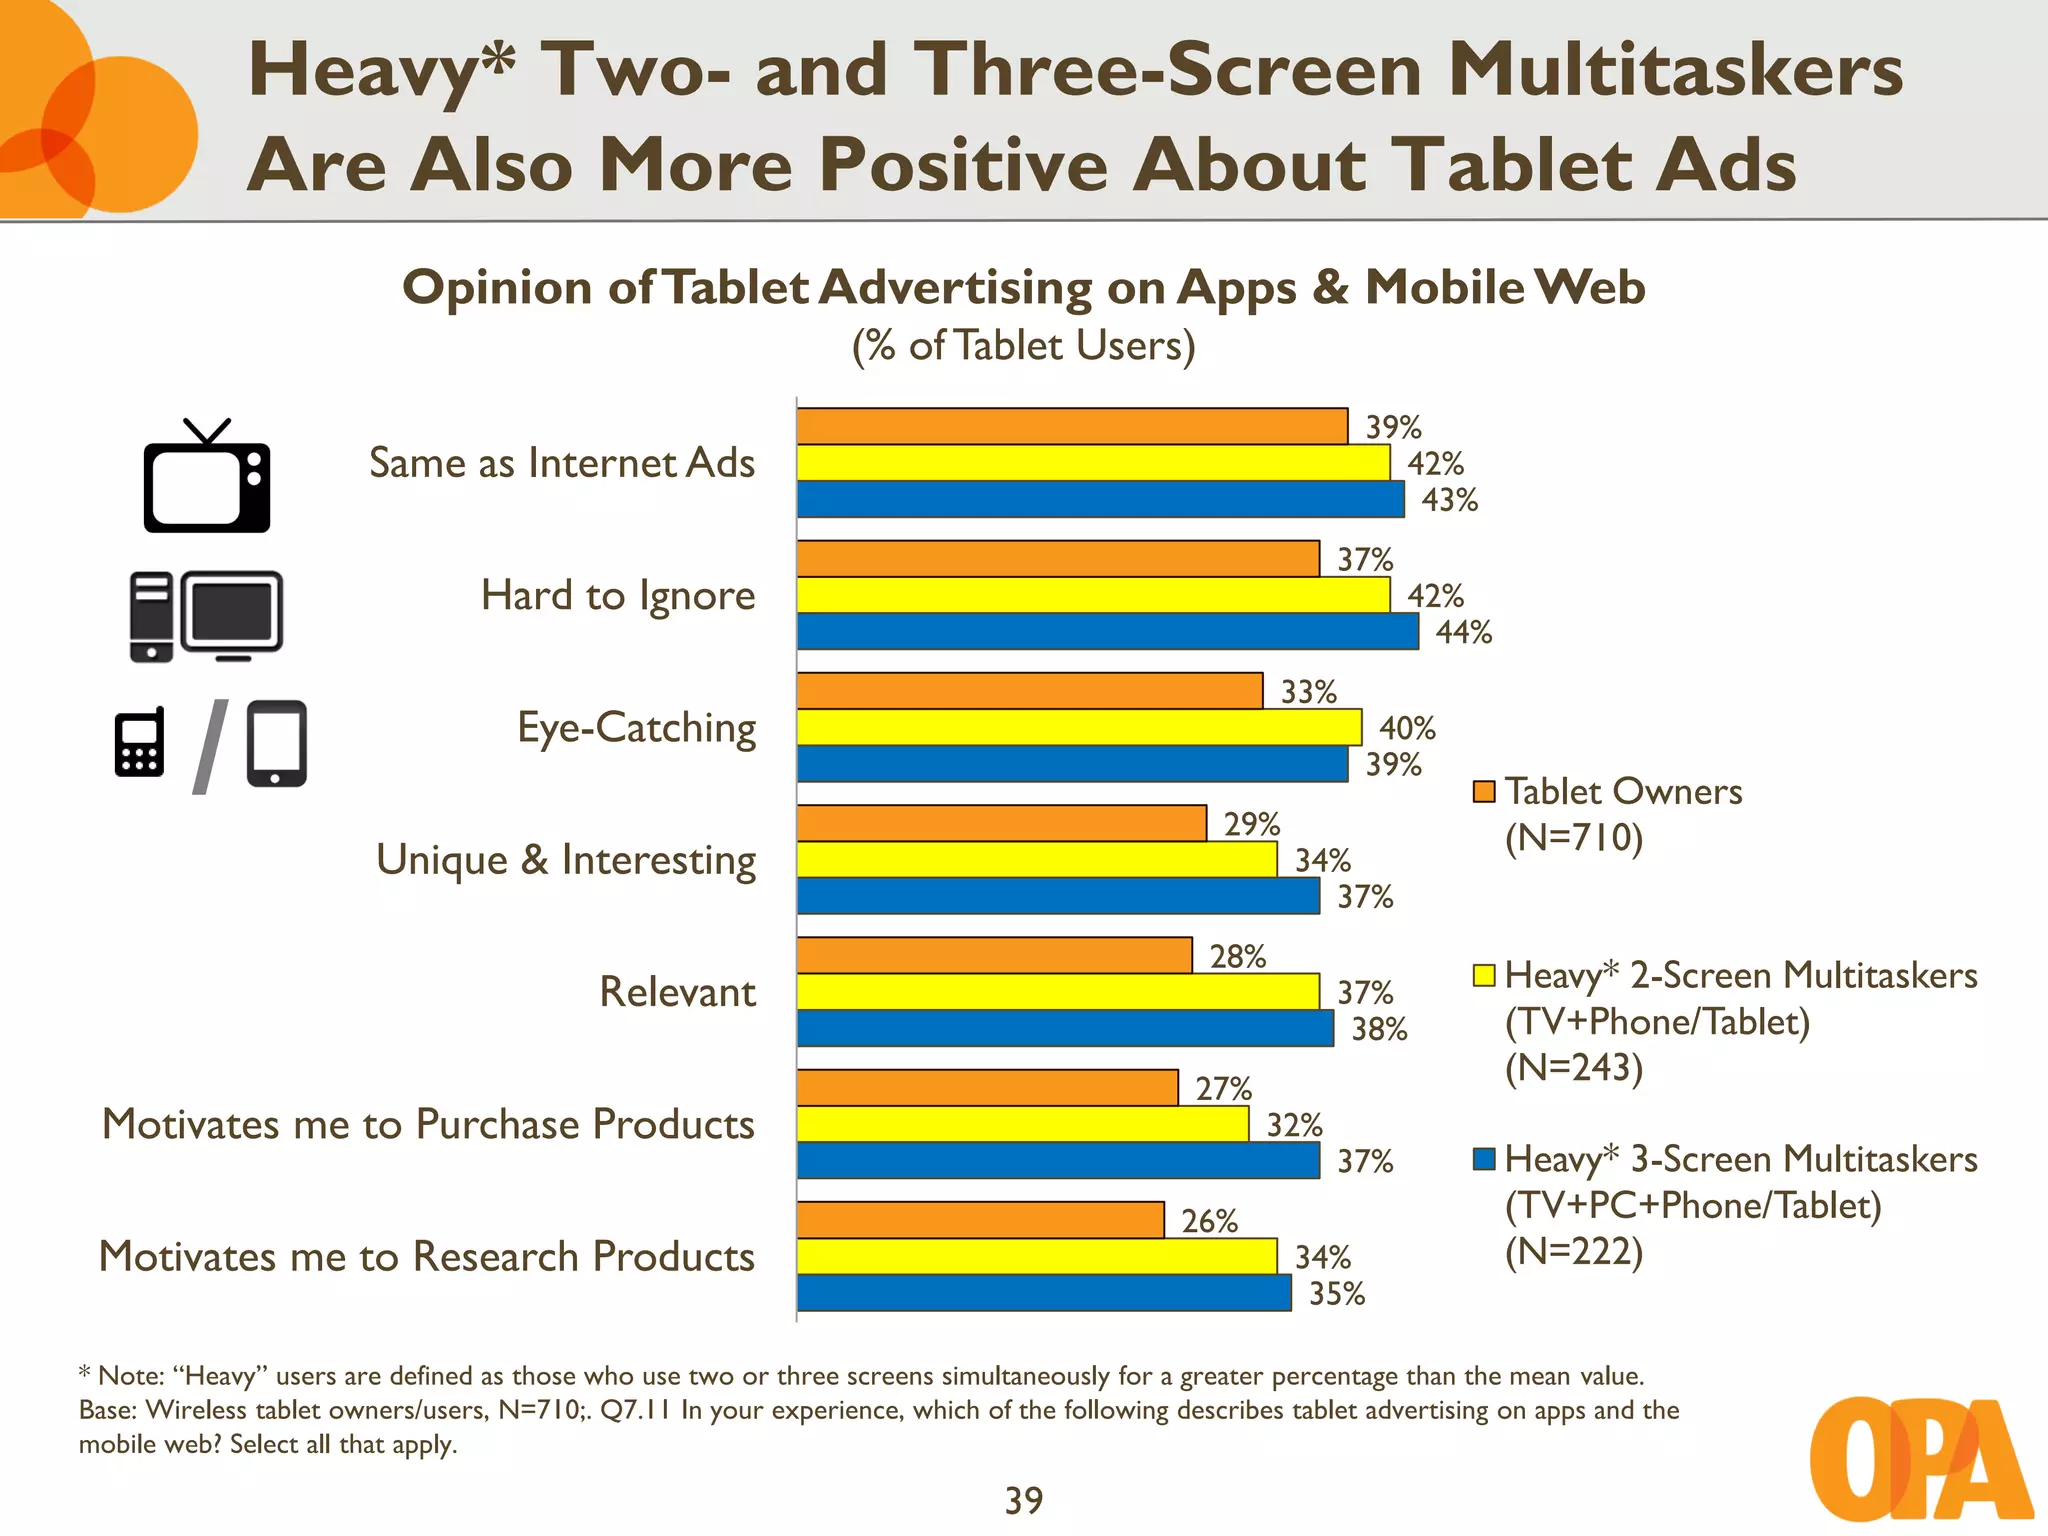
![Heavy1 Two- and Three-Screen Multitaskers
Are Cross-Platform Approx. 3 Hours Per Day
Multitasking During TV Consumption,
Heavy1 Multitaskers
(% of Tablet Users, Time Spent Multitasking)
32%
29%
1 1
/ 2
Avg. Time Spent
2
3.1 hrs Multitasking
Per Day2:
2.8 hrs 3
/
Heavy 2-Screen: Heavy 3-Screen:
TV + Mobile Phone/Tablet TV + PC + Mobile Phone/Tablet
[1]: “Heavy” users are defined as those who use two or three screens simultaneously for a greater percentage of time than the mean value.
[2]: Time spent is calculated by combining percent of time spent multitasking with time spent watching TV, which equals 4.9 hours per day (Q.9)
Base: Wireless tablet owners/users, N=758. Indicates percent of tablet users who responded to any of the following questions:
What percent of the time that you’re watching TV on a TV set… Q.55: … are you also online on your computer at the same time? Q.56: …are you
using your mobile phone or tablet at the same time? Q.57: …are you online on your computer and using your mobile phone and/or tablet all at the
same time?
27](https://image.slidesharecdn.com/mmf-opa-portraitoftabletuser-wave2-jun12public-120927133202-phpapp02/75/Portrait-of-a-tablet-user-MMF-OPA-Wave-2-Juin-2012-28-2048.jpg)
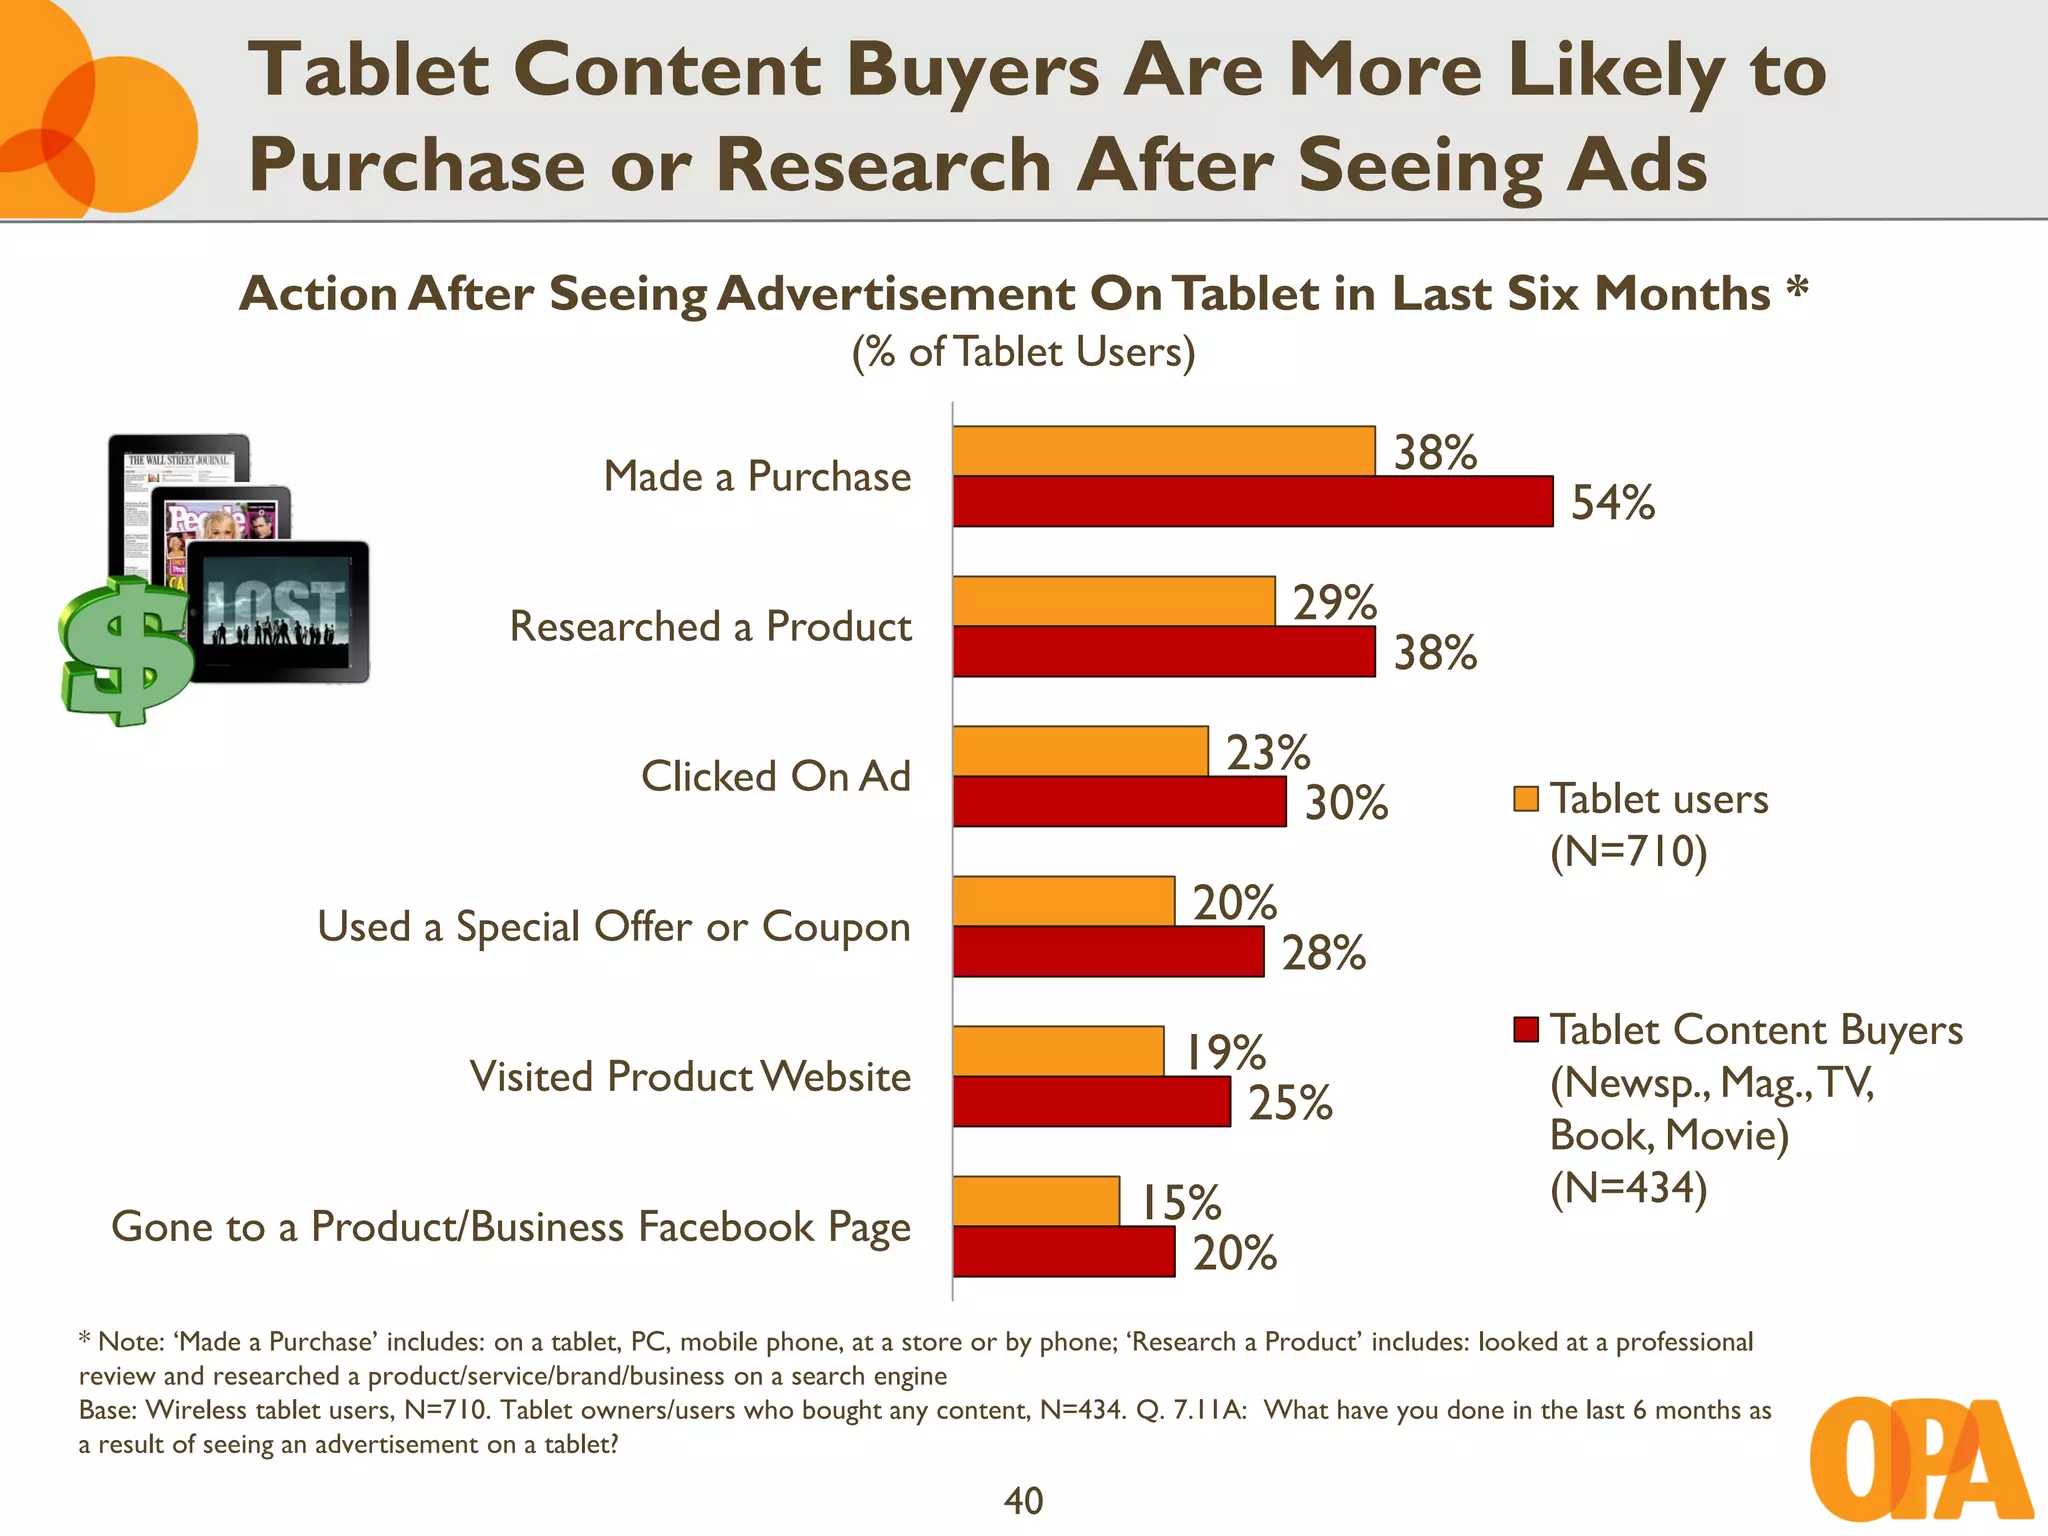
![Heavy* Multi-Screen Multitaskers Are Also
More Likely to Take Action After Seeing Ads
Action After Seeing Advertisement On Tablet in Last Six Months1
(% of Tablet Users)
38%
Made a Purchase 45%
50%
29%
Researched a Product 32%
36%
/ Clicked On Ad
23%
29%
28%
Tablet users
(N=710)
20%
Used a Special Offer or Coupon 28% Heavy* 2-Screen Multitaskers
29%
(TV+Phone/Tablet)
19% (N=243)
Visited Product Website 23%
24%
Heavy* 3-Screen Multitaskers
15% (TV+PC+Phone/Tablet)
Gone to a Product/Business Facebook Page 23% (N=222)
26%
[1]: ‘Made a Purchase’ includes: on a tablet, PC, mobile phone, at a store or by phone; ‘Research a Product’ includes: looked at a professional
review and researched a product/service/brand/business on a search engine.
* Note: “Heavy” users are defined as those who use two or three screens simultaneously for a greater percentage of time than the mean value.
Base: Wireless tablet users, N=710. Q. 7.11A: What have you done in the last 6 months as a result of seeing an advertisement on a tablet?
41](https://image.slidesharecdn.com/mmf-opa-portraitoftabletuser-wave2-jun12public-120927133202-phpapp02/75/Portrait-of-a-tablet-user-MMF-OPA-Wave-2-Juin-2012-42-2048.jpg)
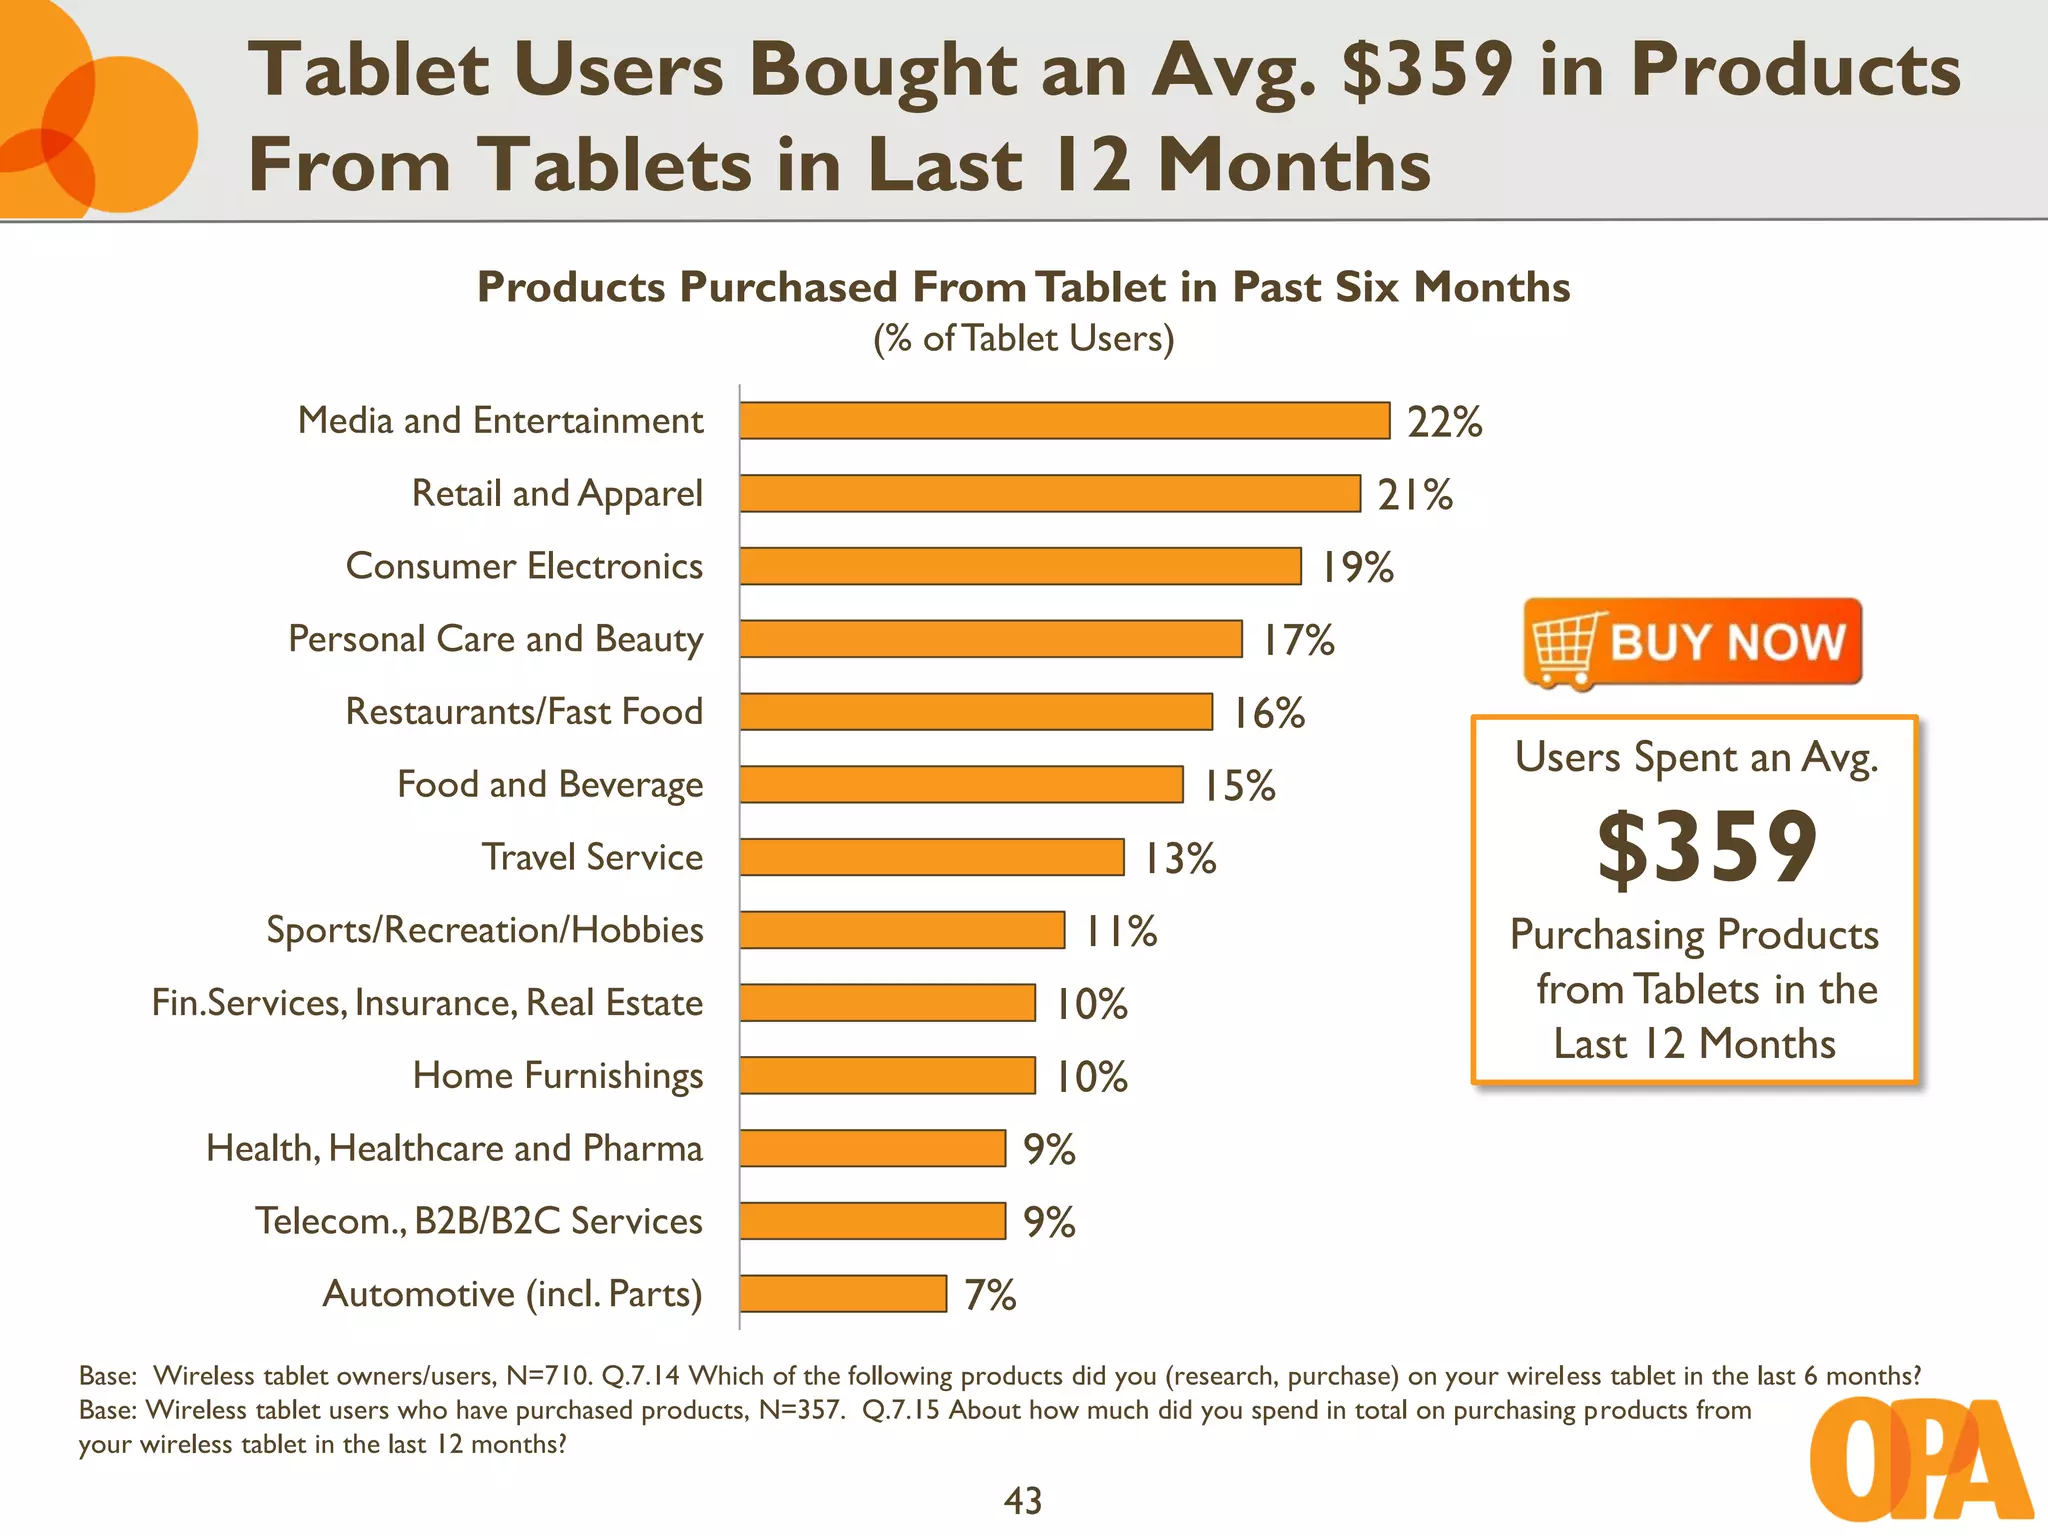
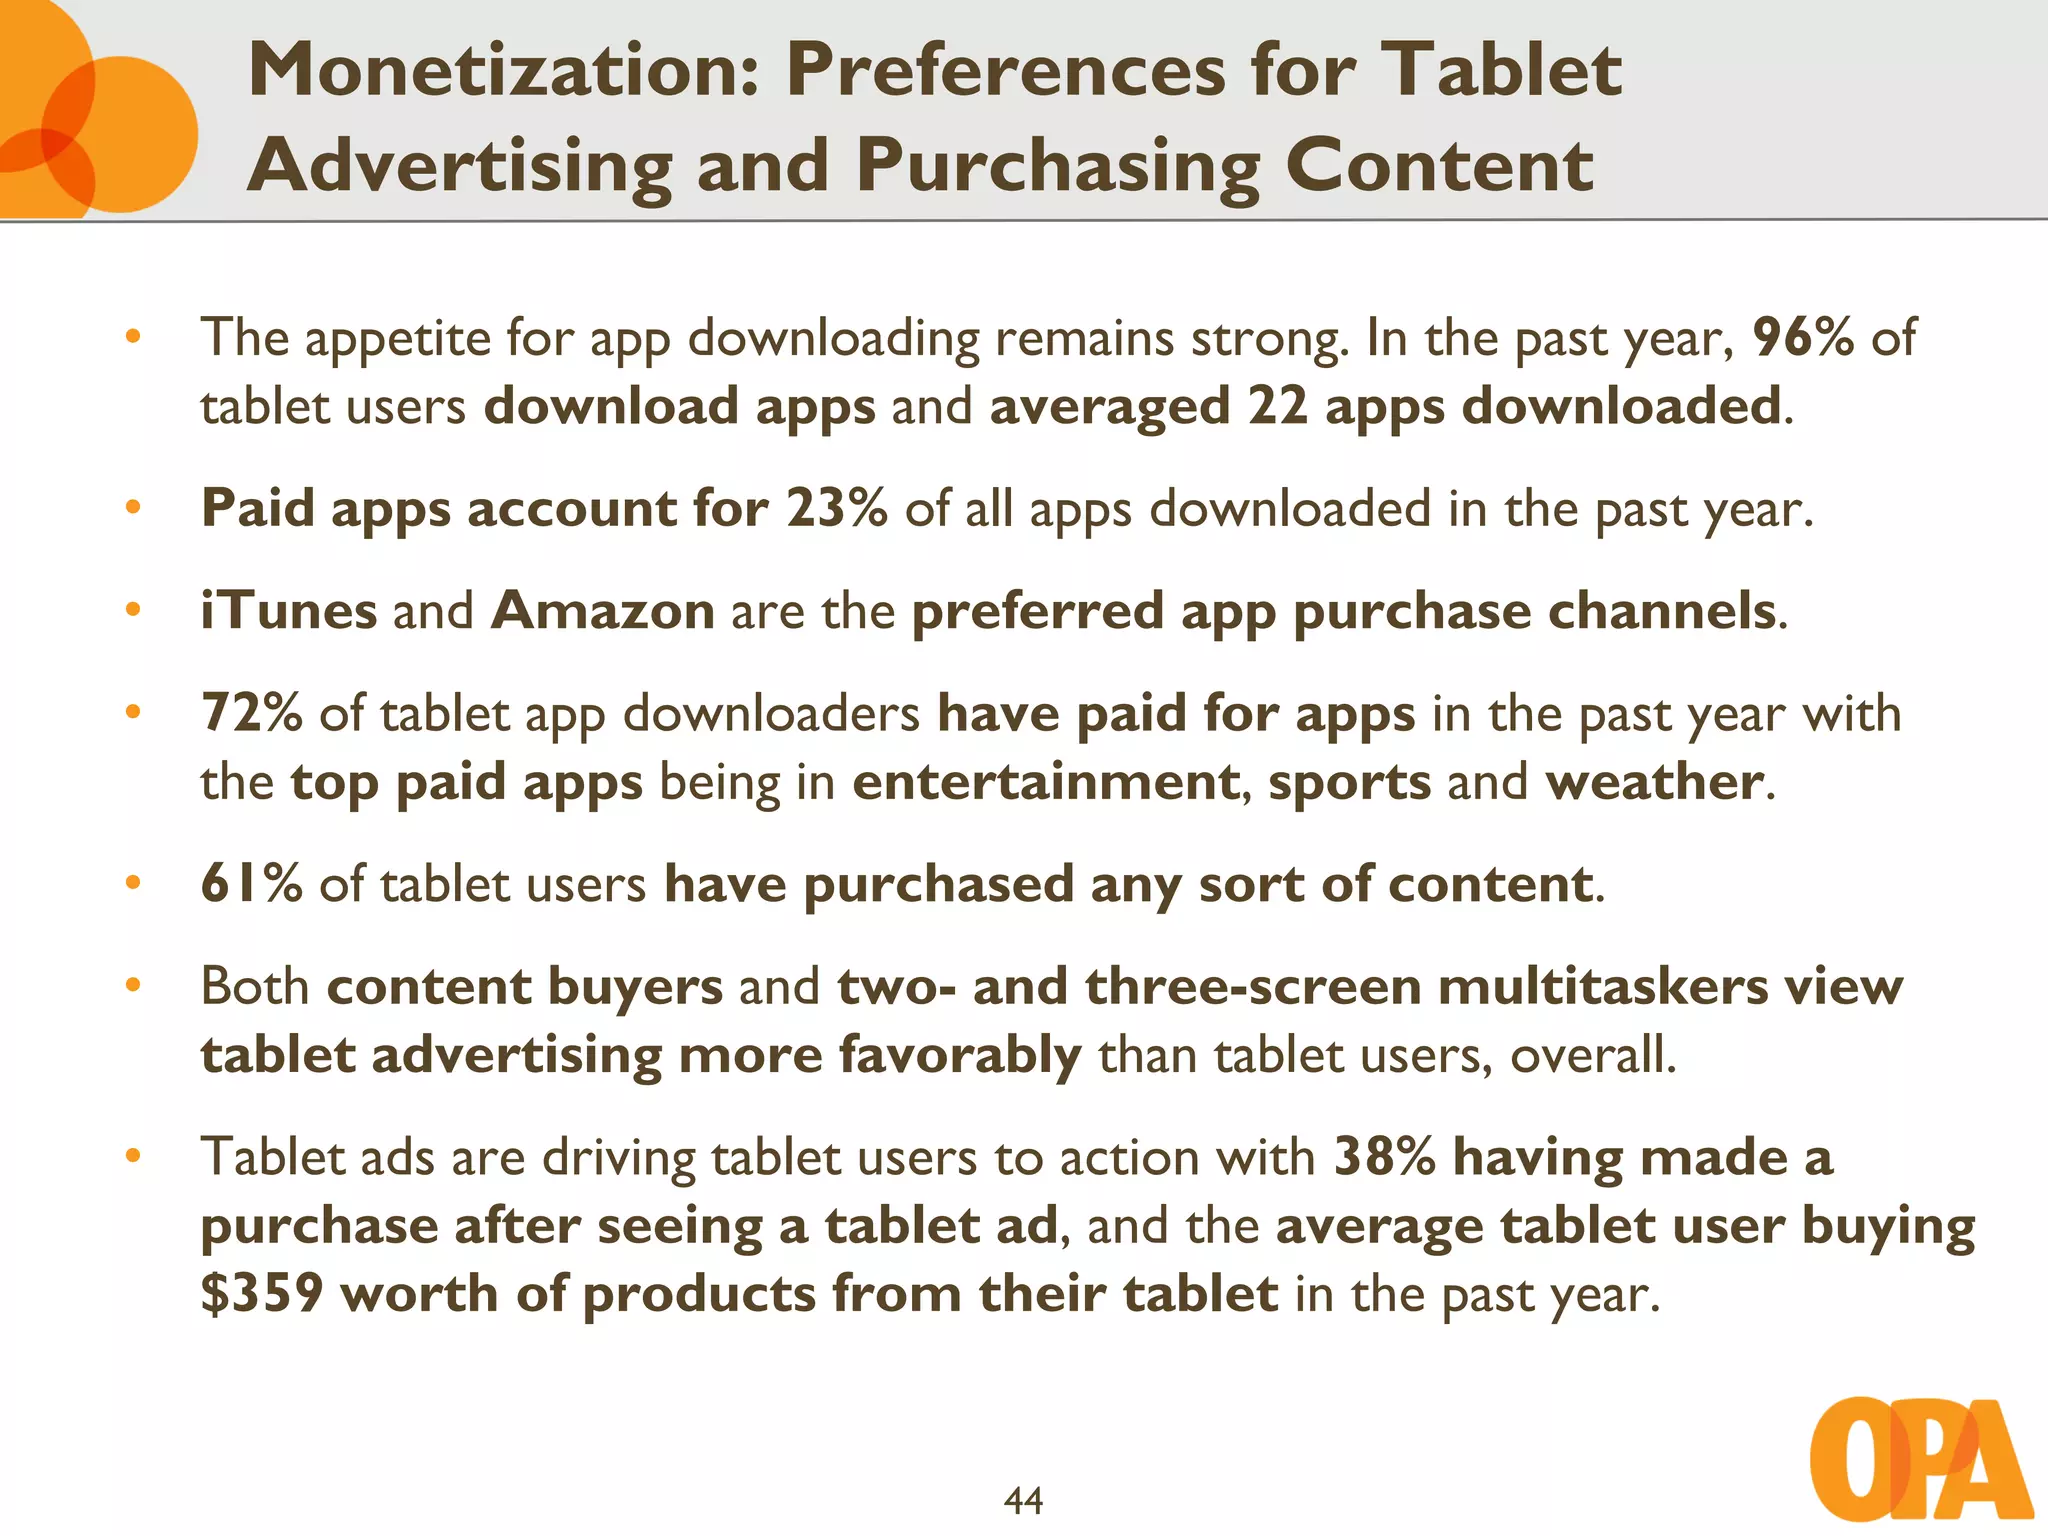

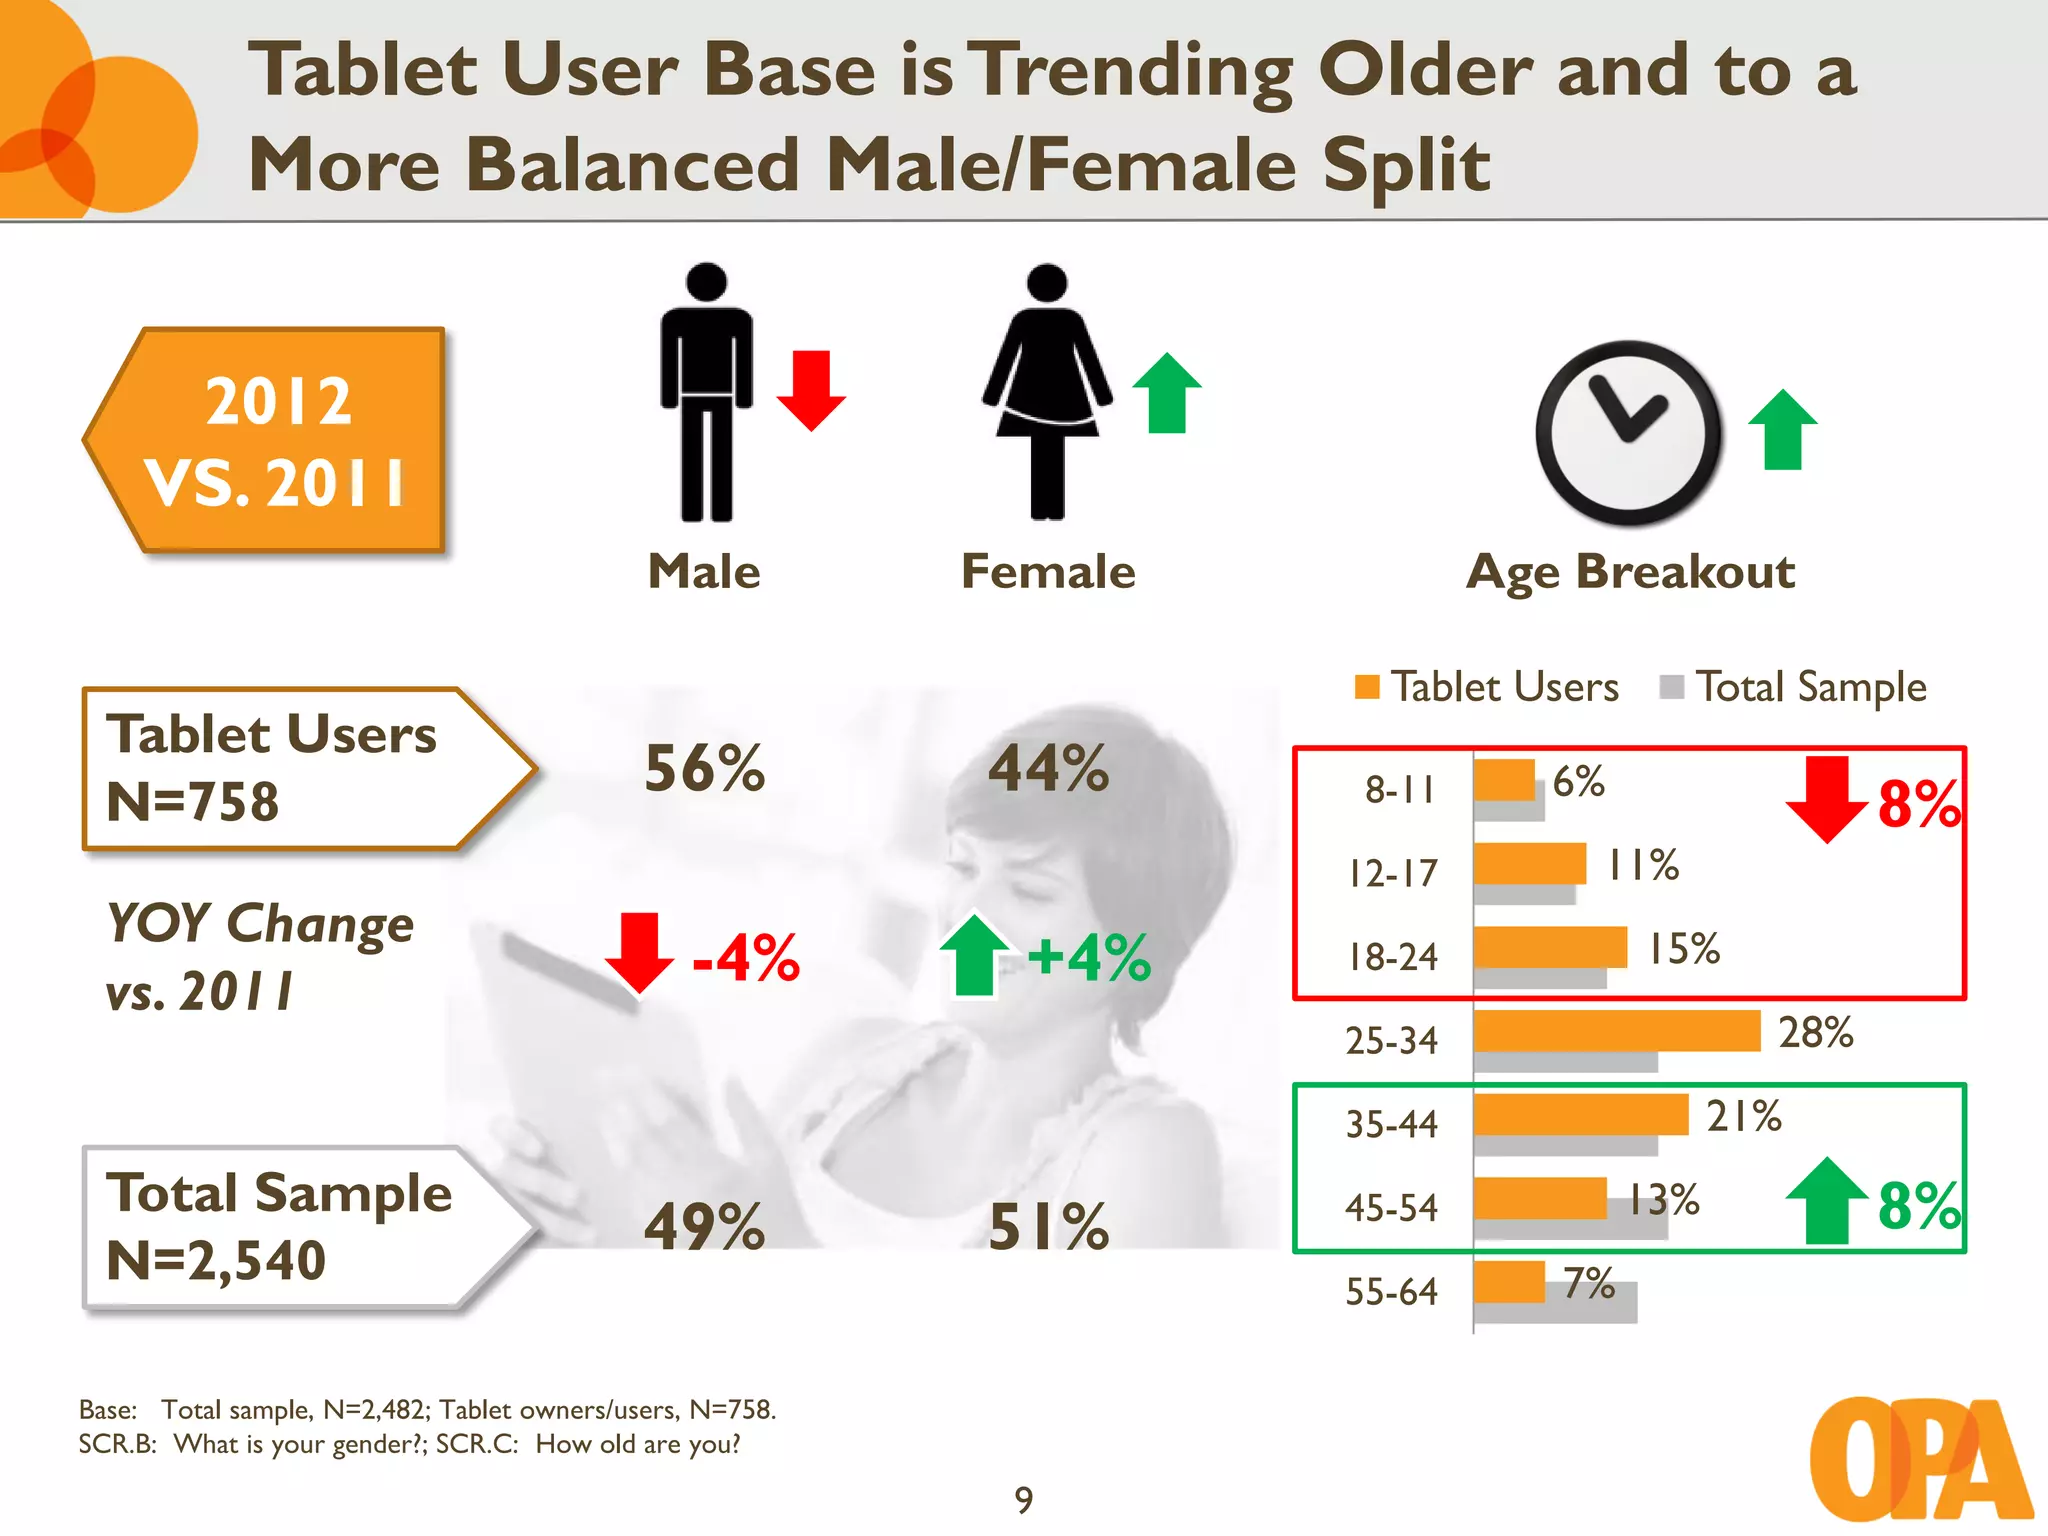
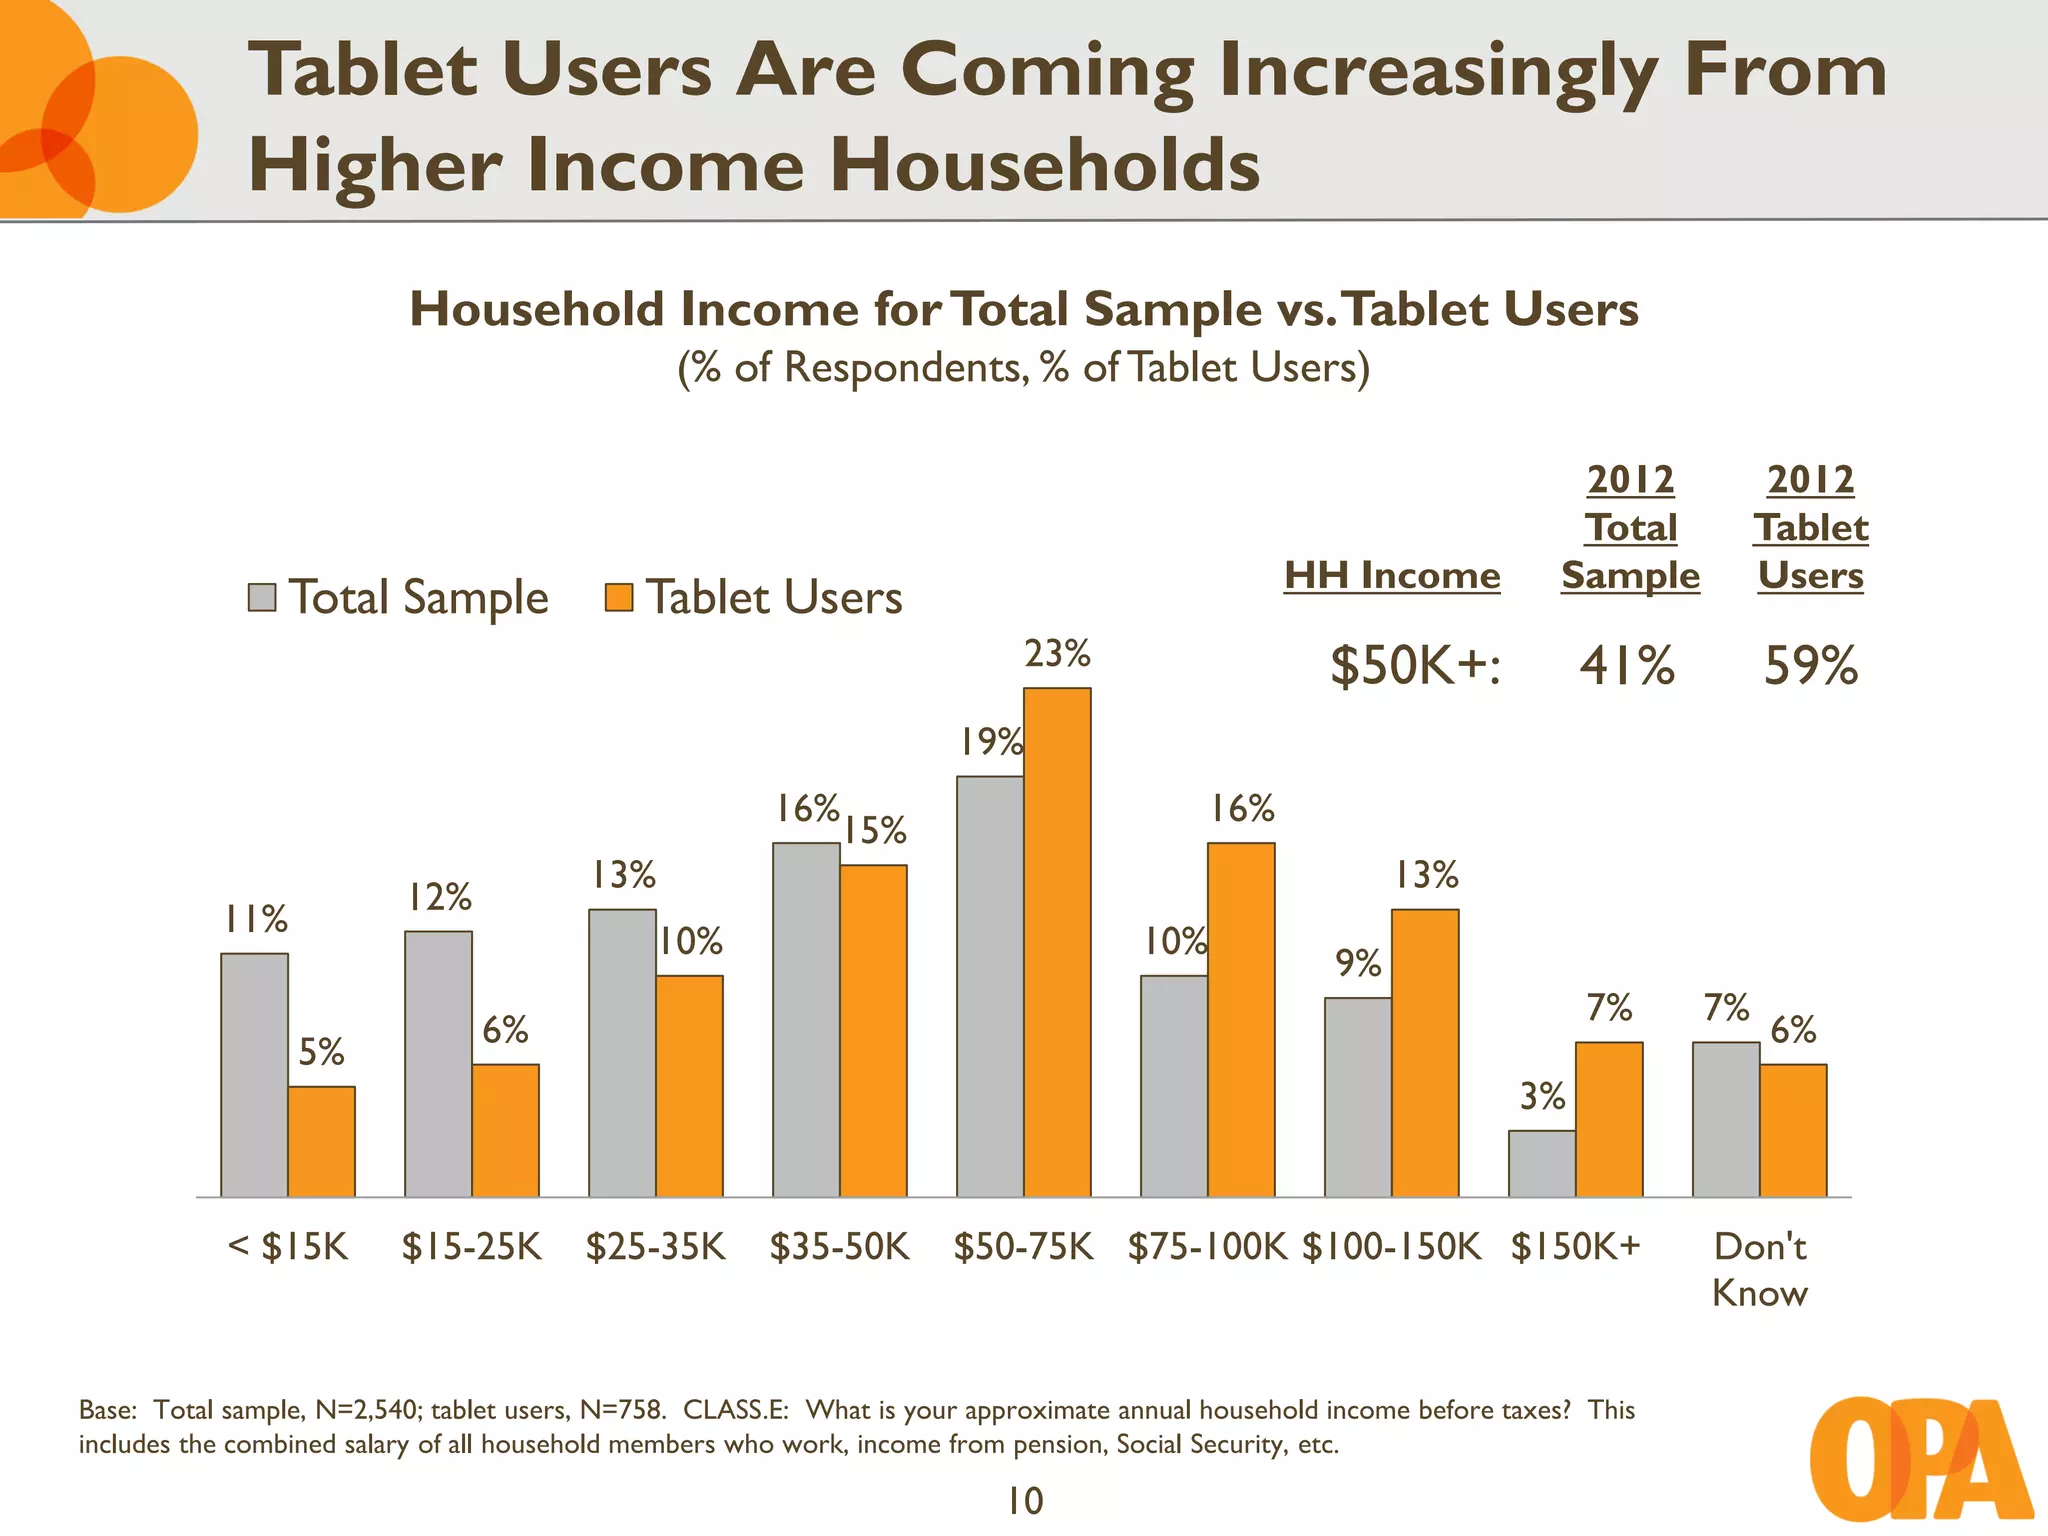
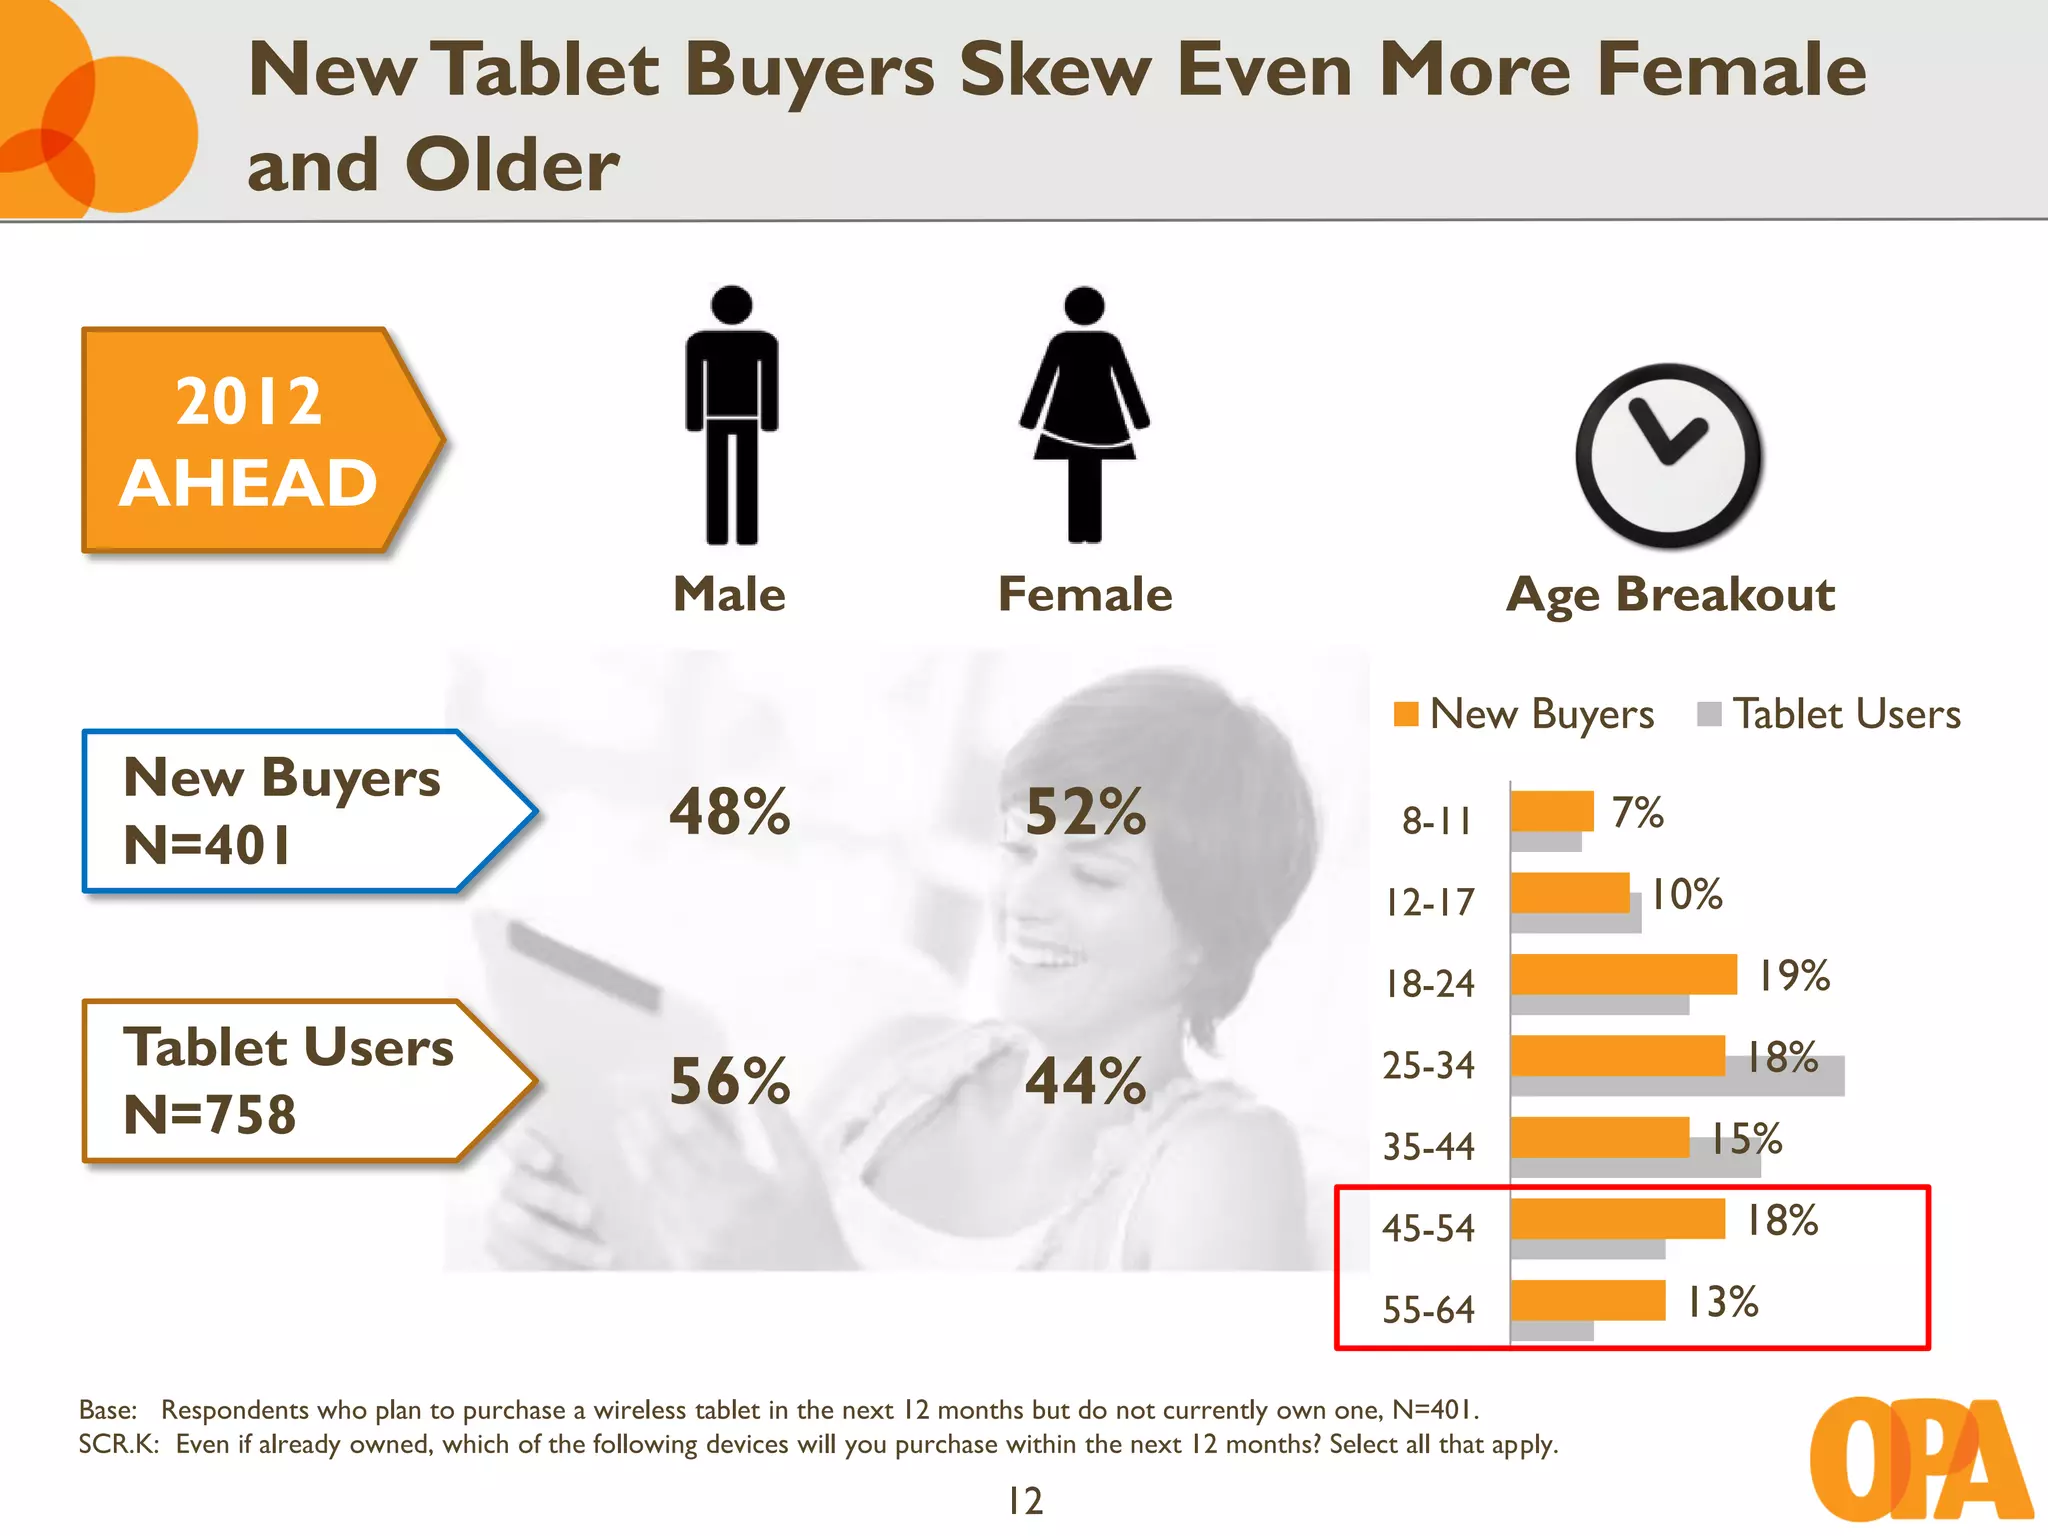
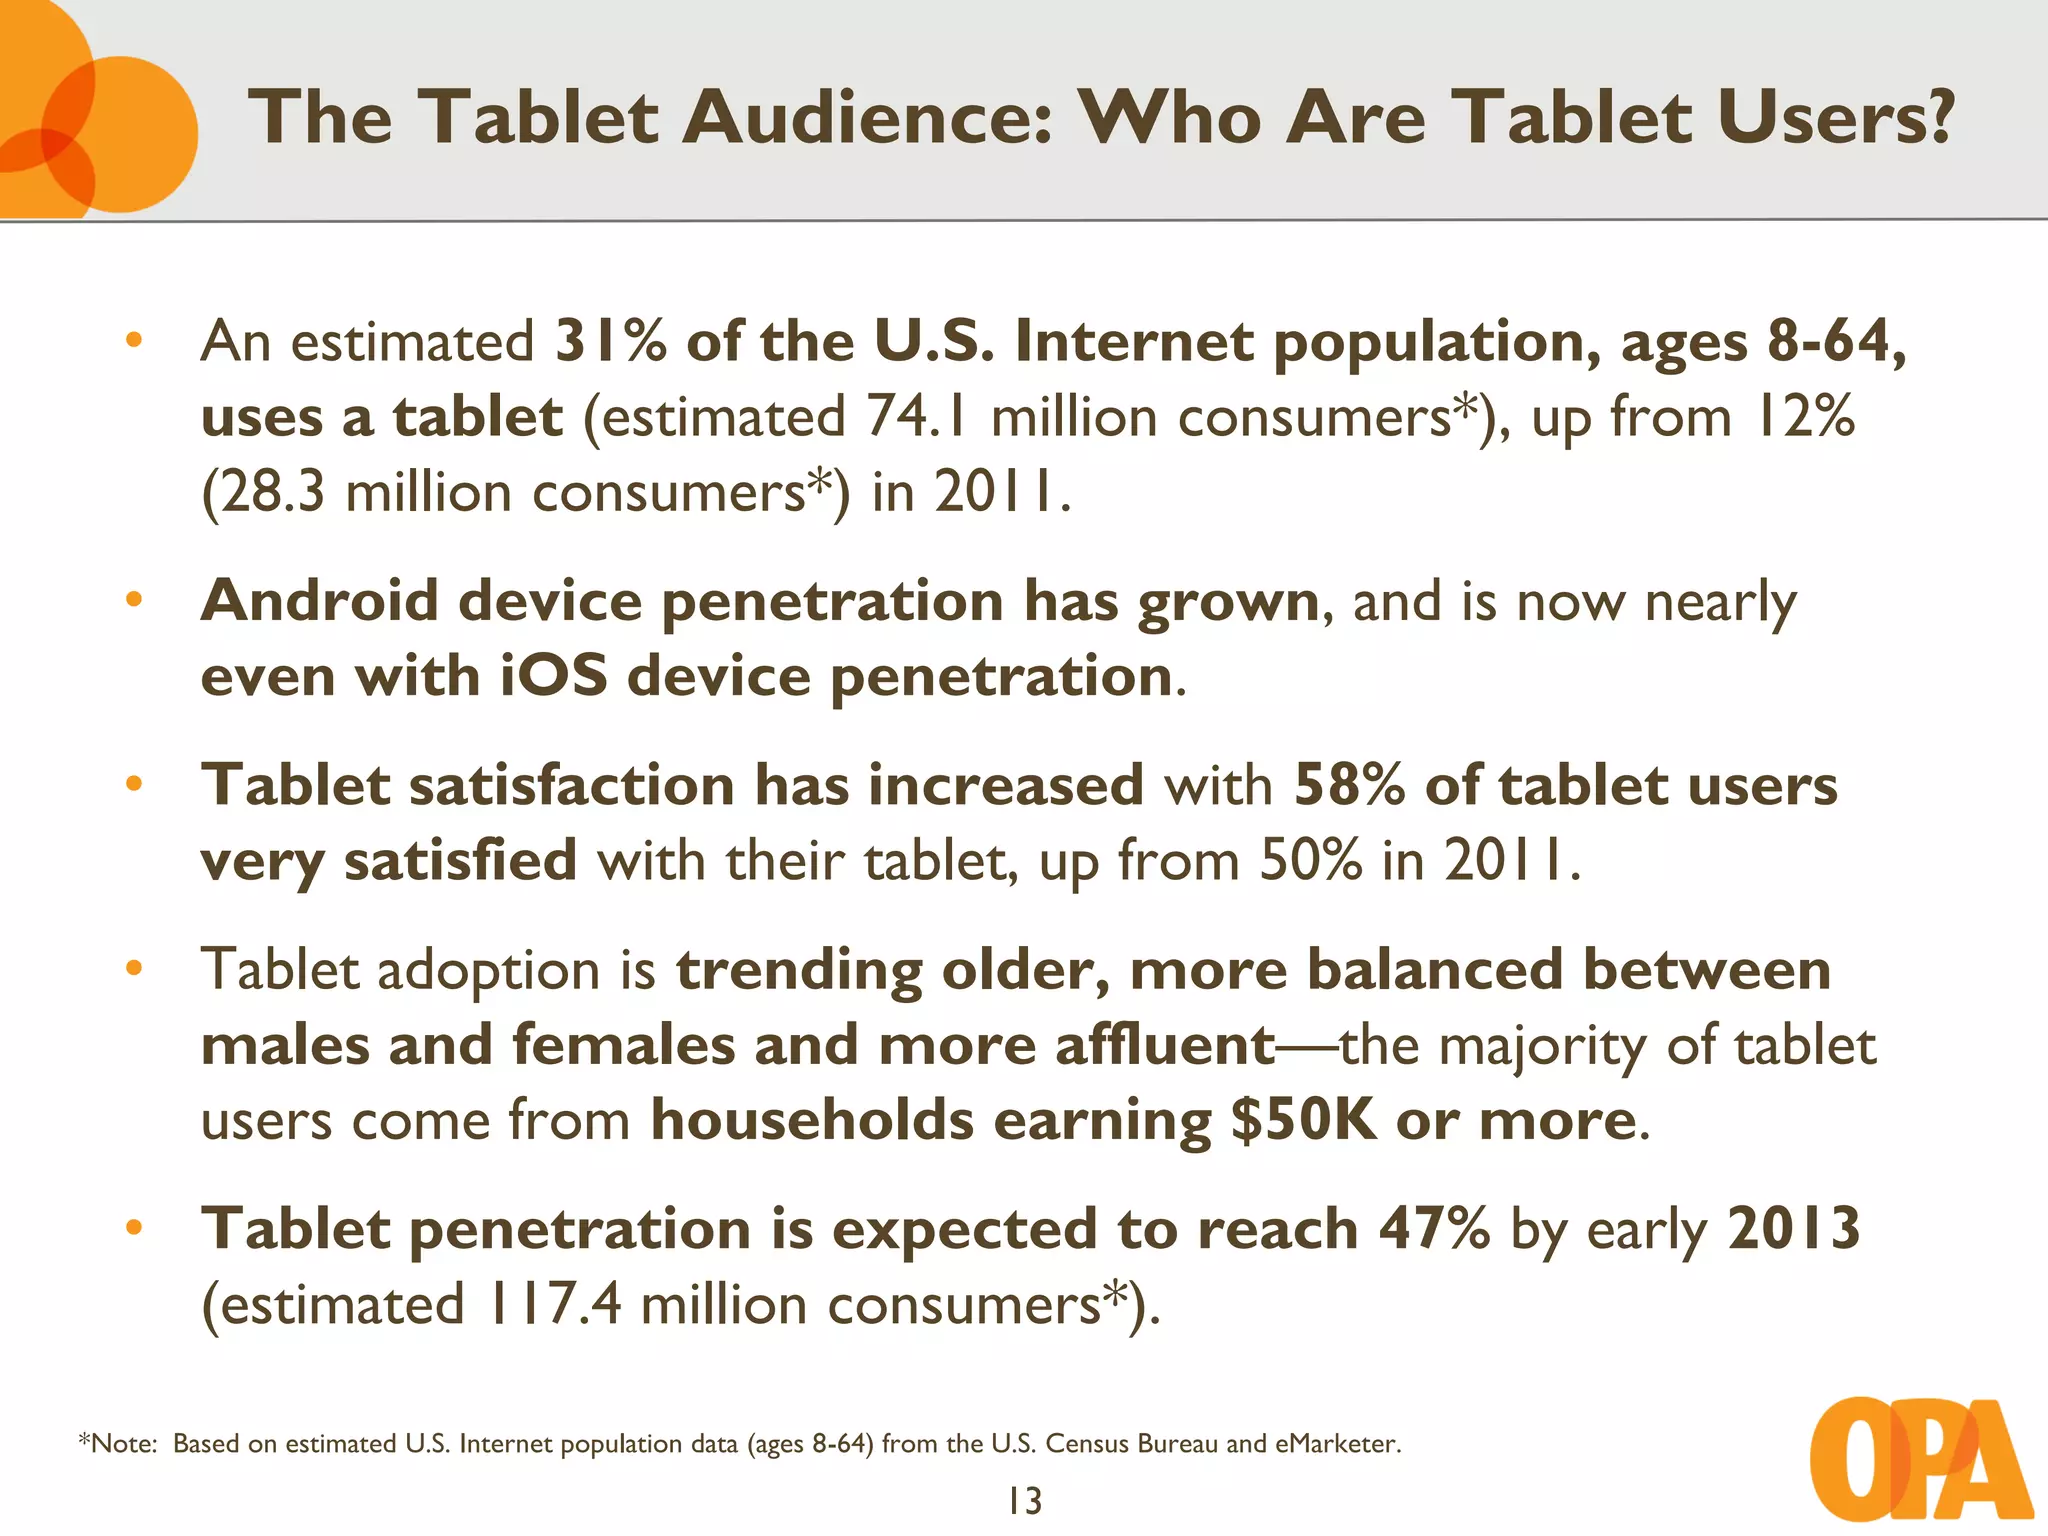
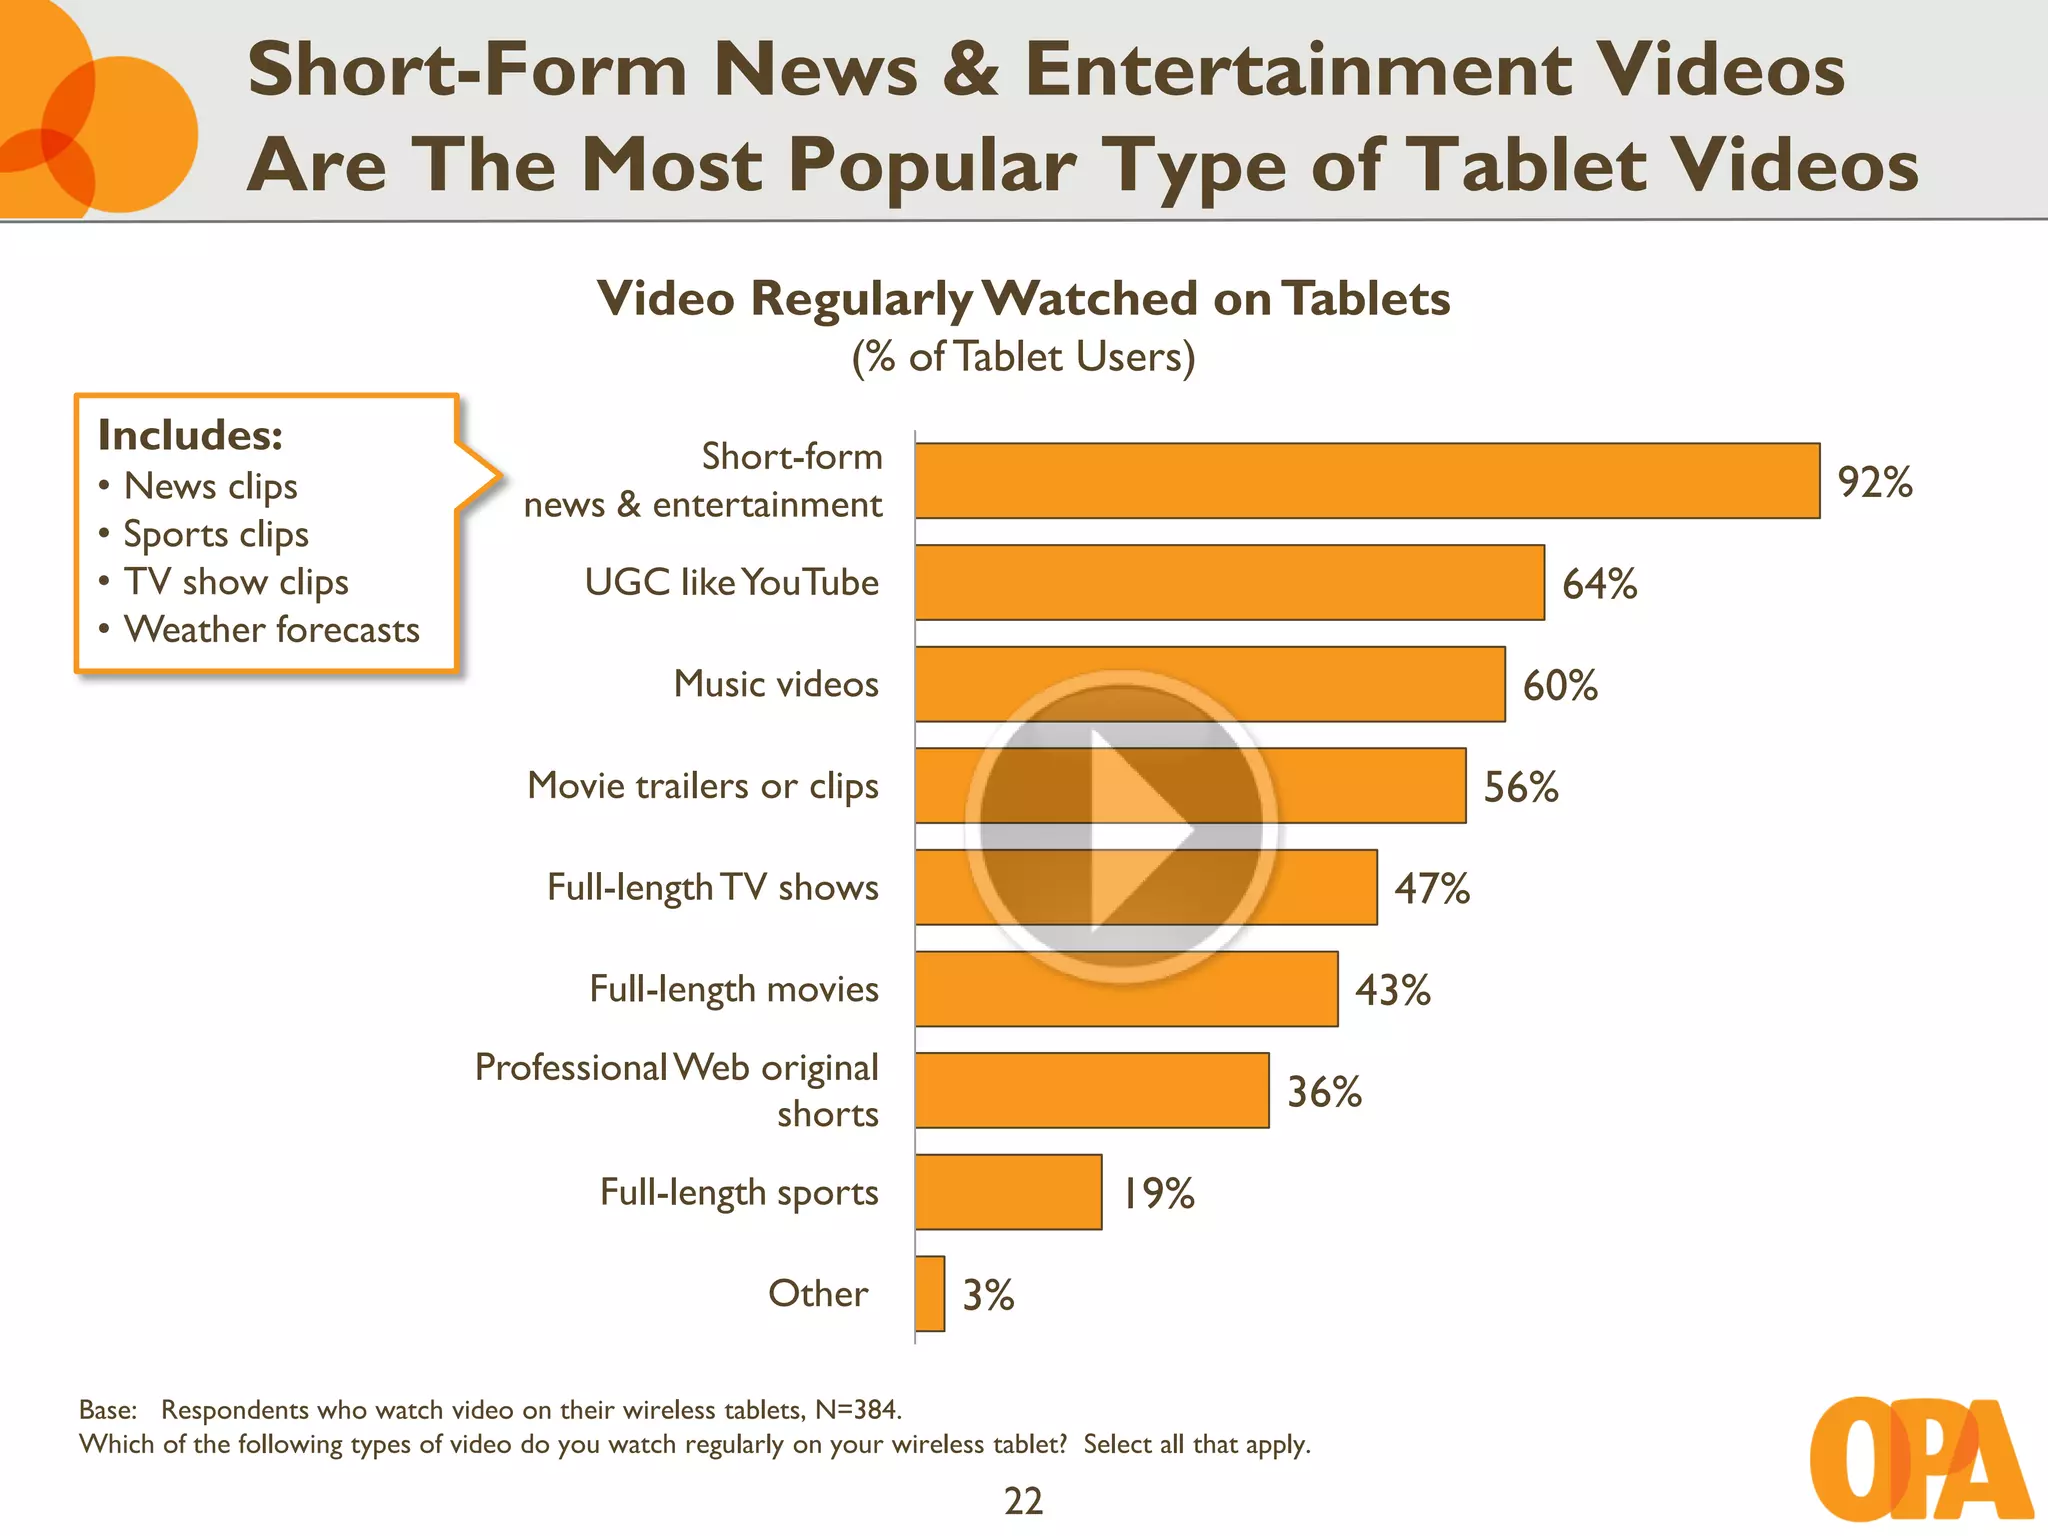
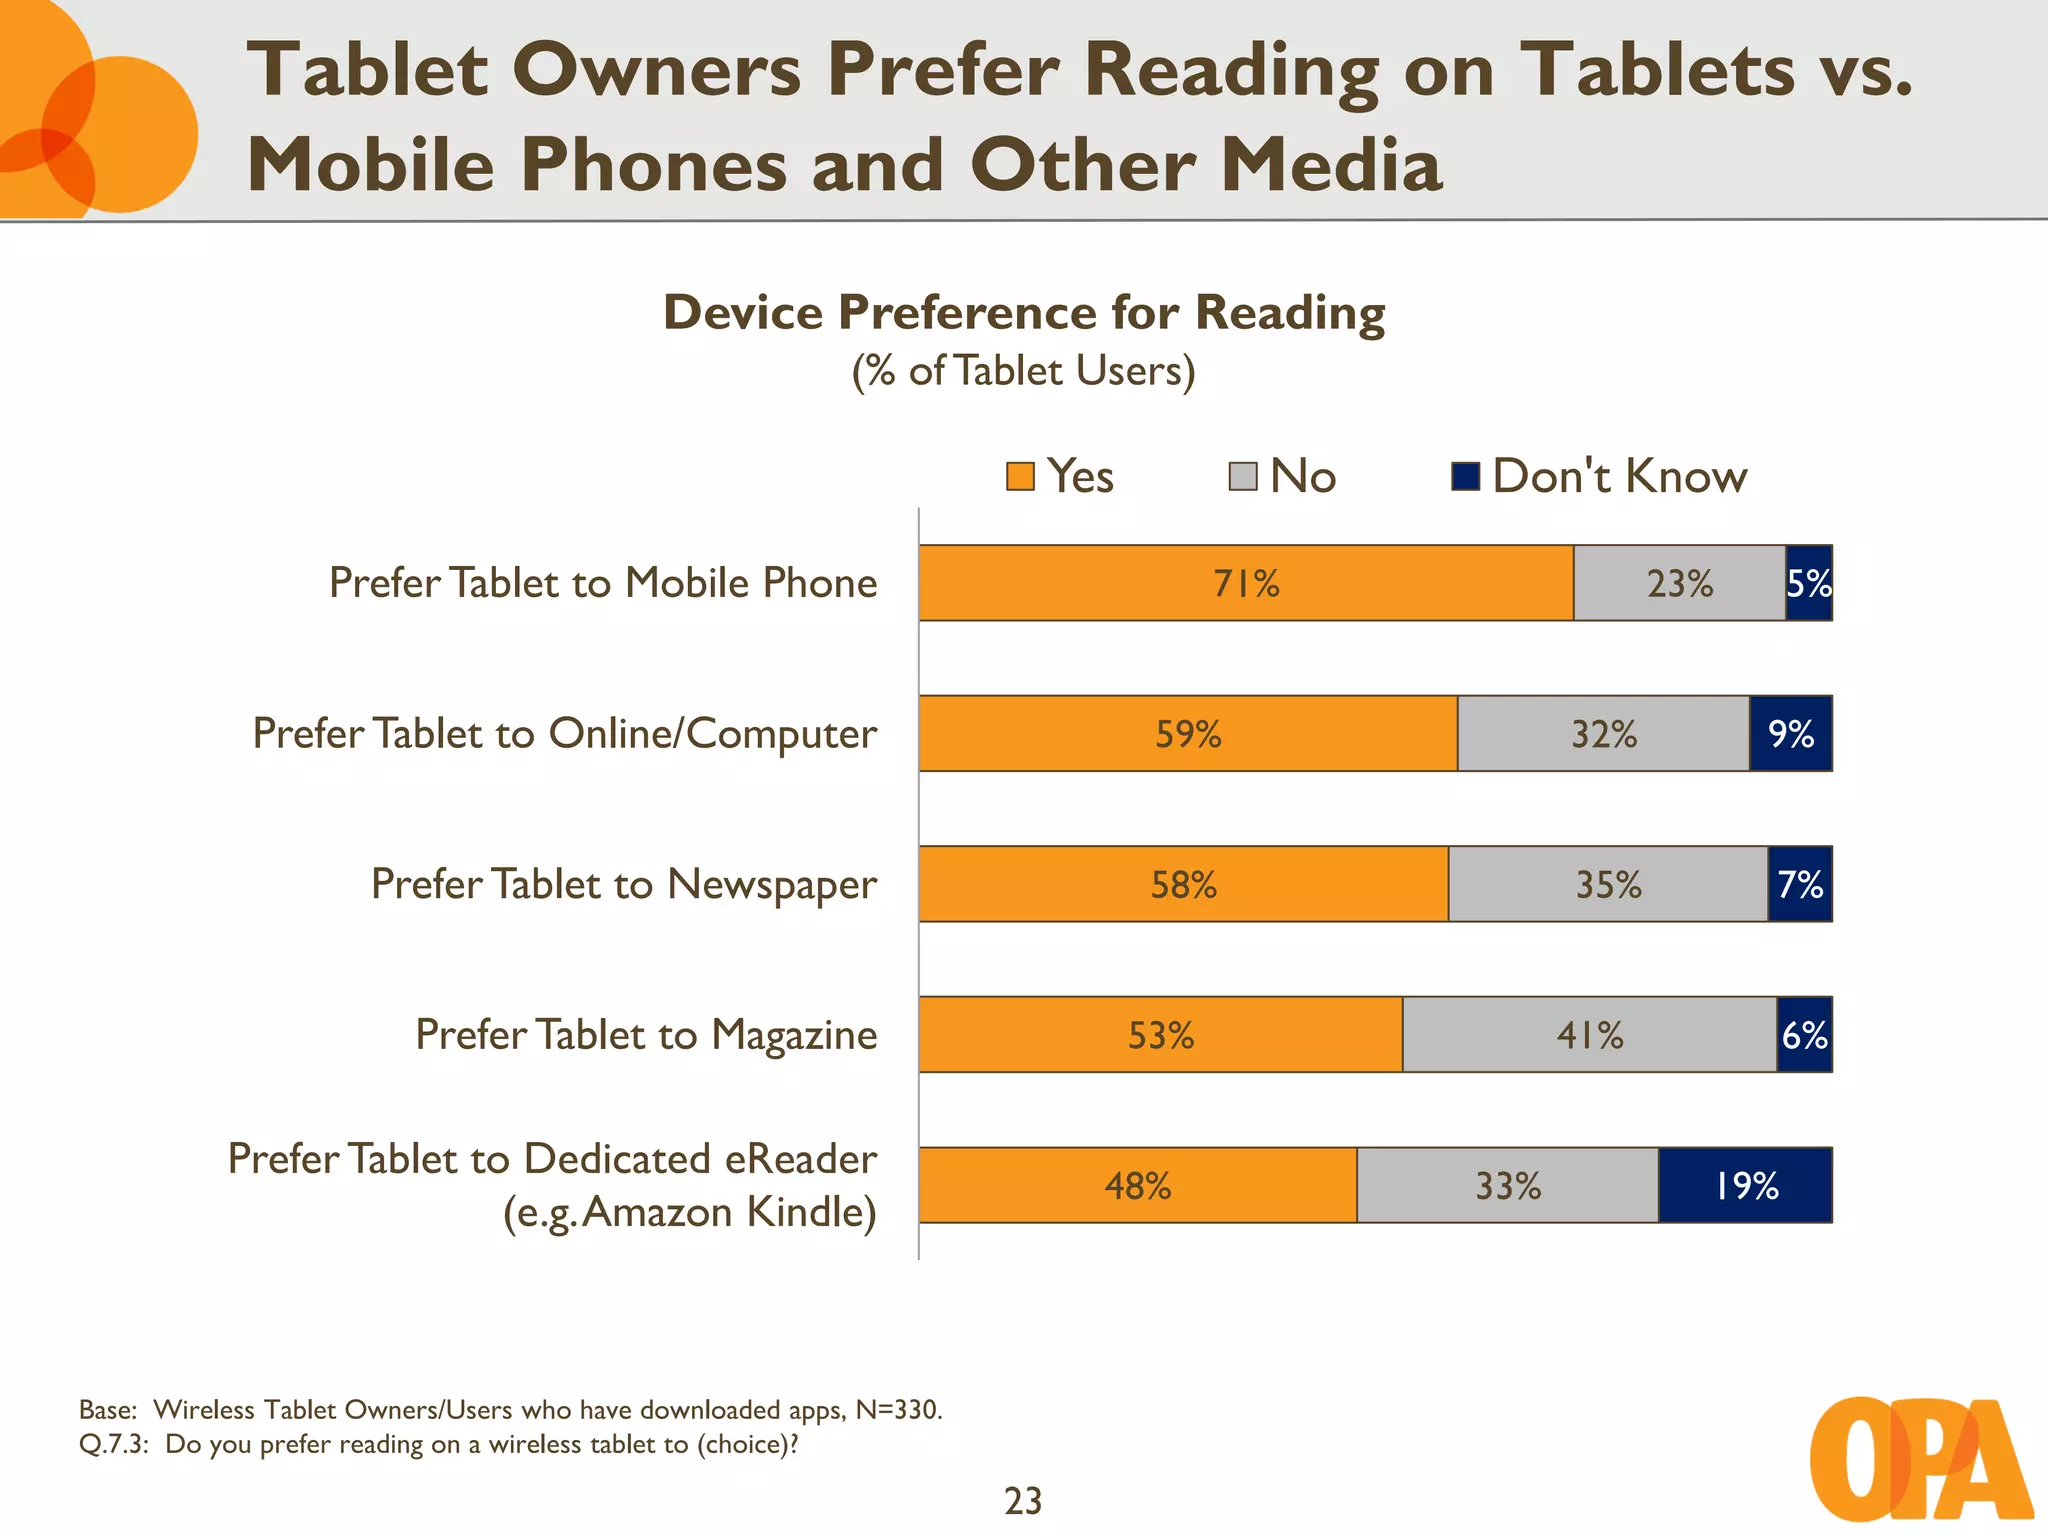
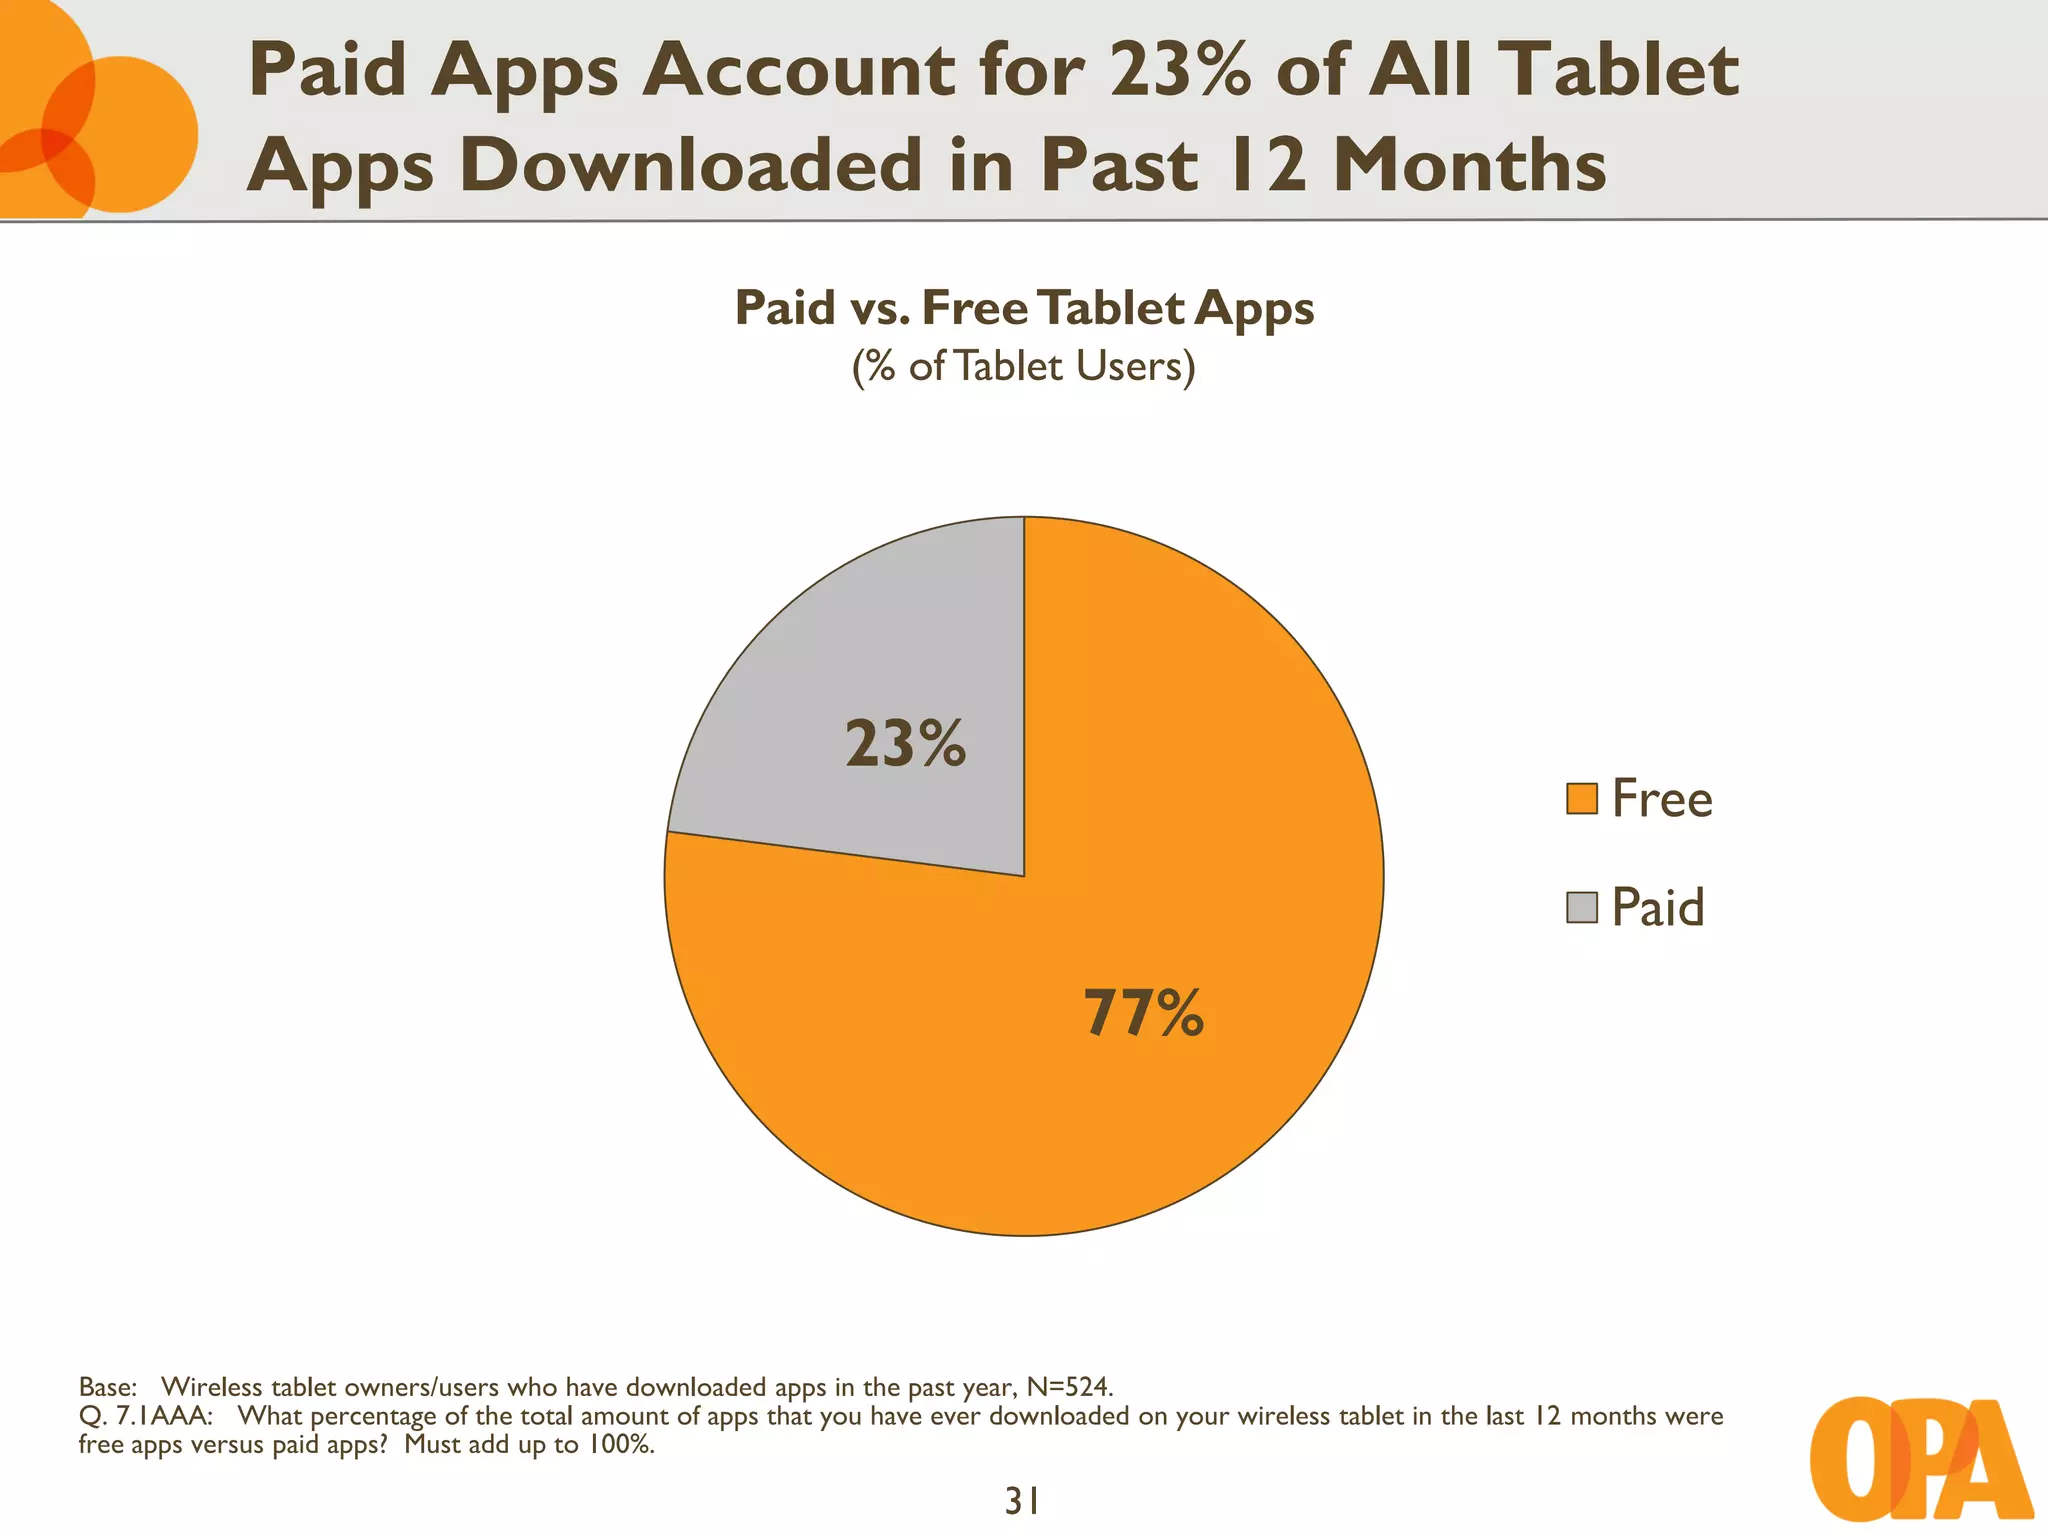
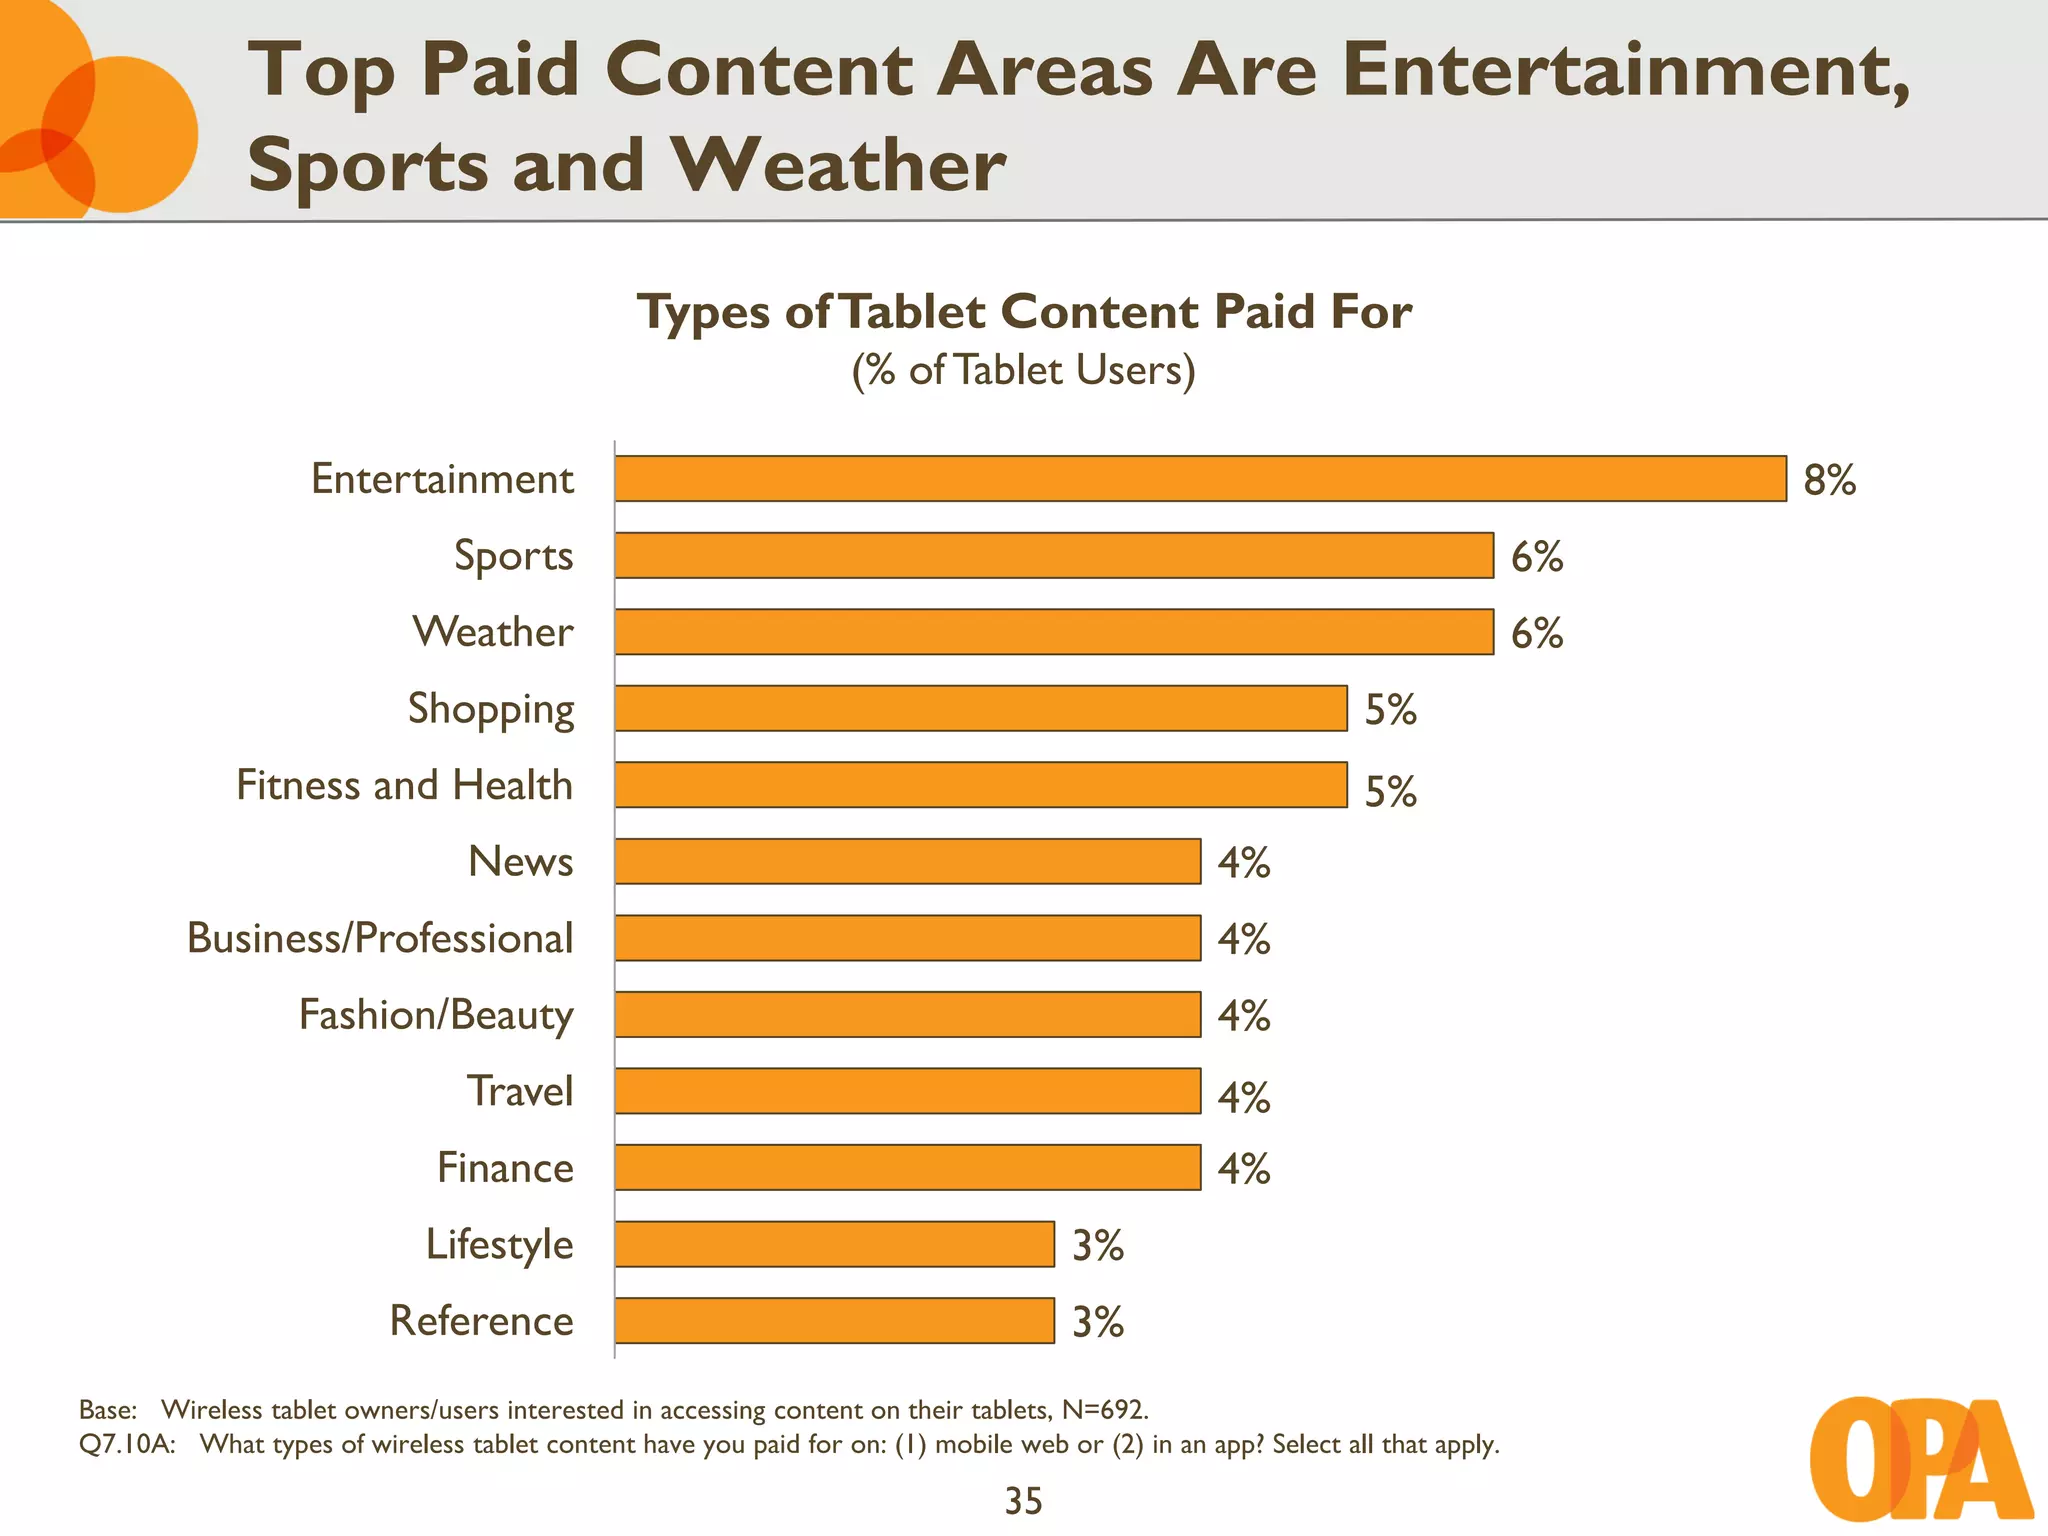
The document summarizes findings from a study on tablet users conducted in June 2012 by Frank N. Magid Associates. Some key findings: 1. Tablet usage exploded over the past year, with 31% of respondents now owning or regularly using tablets, up from 12% in 2011. 2. Tablet ownership is becoming more balanced between males and females compared to 2011, and the user base is trending older. 3. Content consumption such as reading, games, and video remains the dominant usage of tablets, though users show an appetite for paid content as well.


![Vibe Coding vs. Spec-Driven Development [Free Meetup]](https://cdn.slidesharecdn.com/ss_thumbnails/vibecodingvsspecdrivendevelopment-251209105622-43f455e7-thumbnail.jpg?width=640&height=640&fit=bounds)


