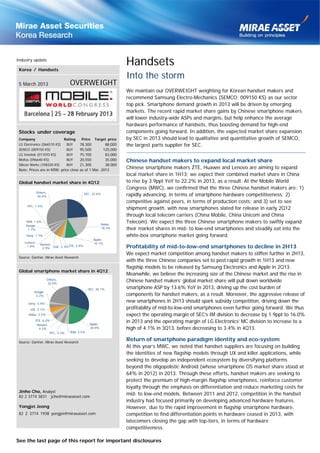
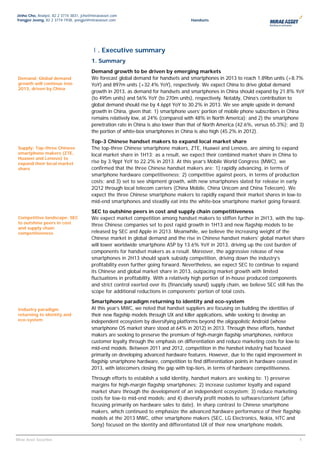
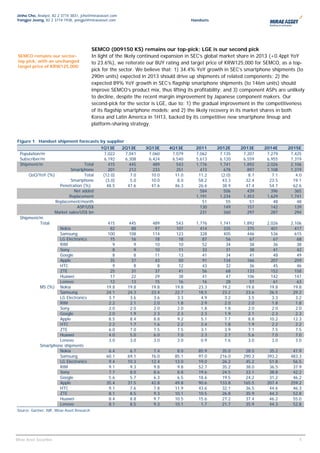
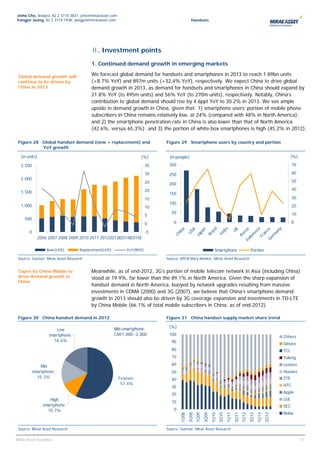
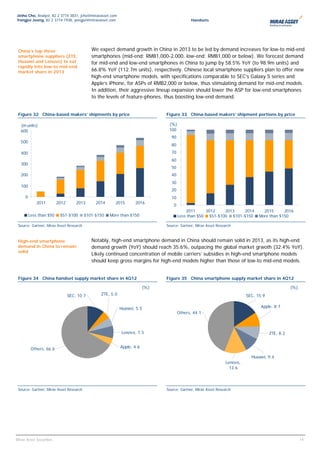
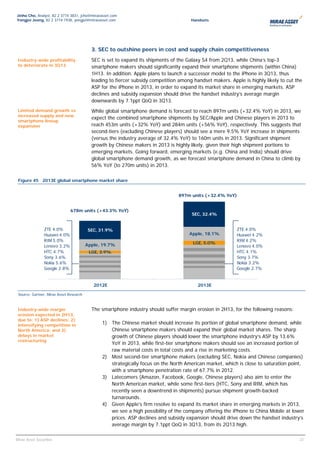
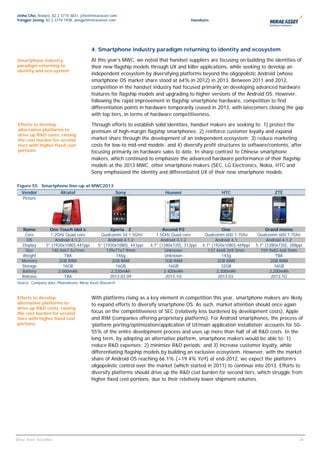
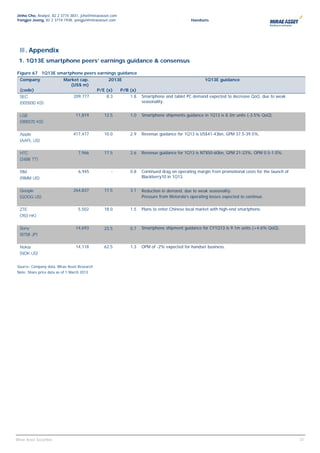
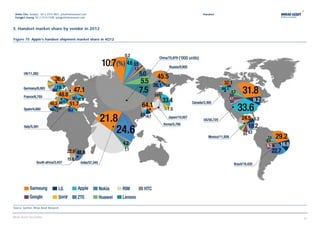
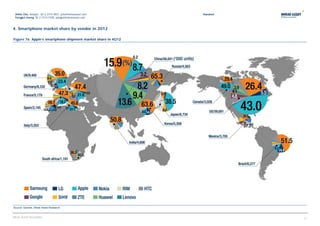
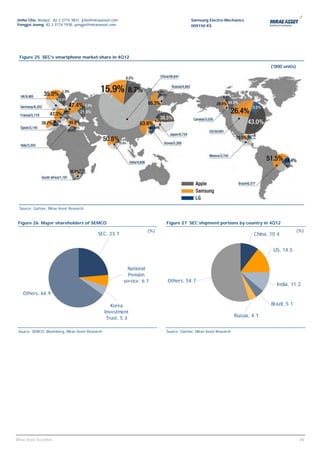
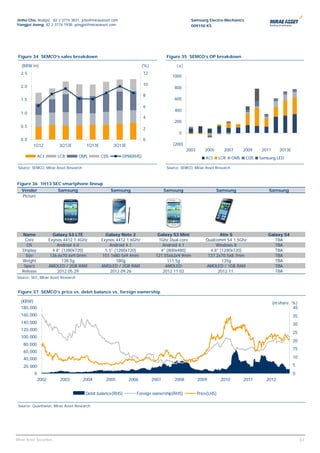
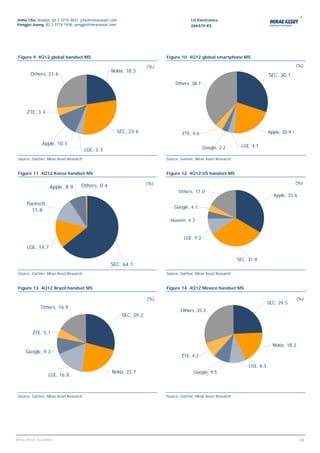
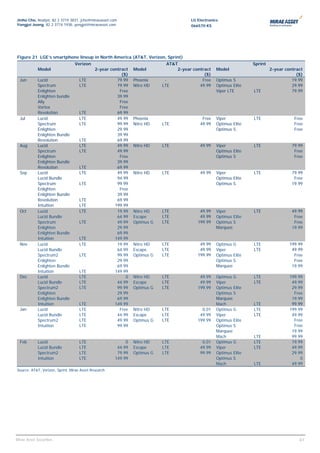
- Smartphone demand growth in 2013 will be driven by emerging markets like China, where demand is expected to increase by 56% year-over-year.
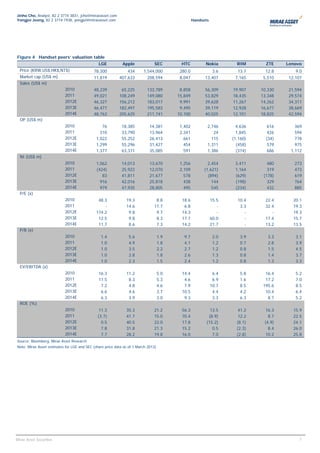
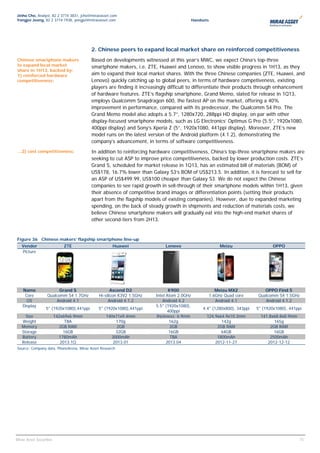
- Top Chinese smartphone makers ZTE, Huawei, and Lenovo aim to expand their combined market share in China to 22.2% in 2013 through new smartphone releases.
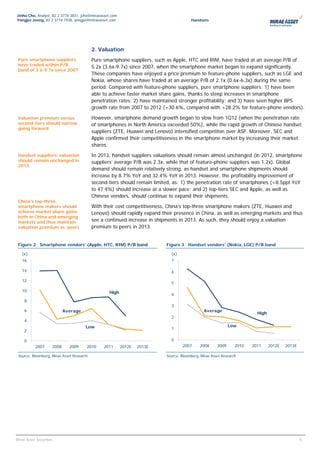
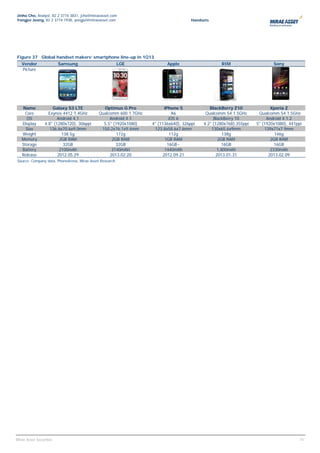
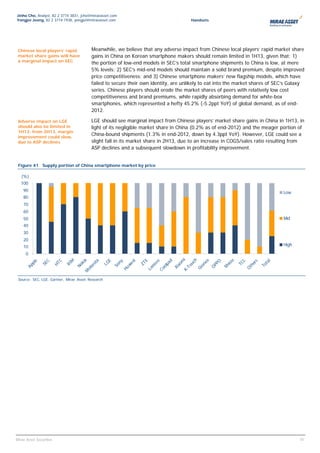
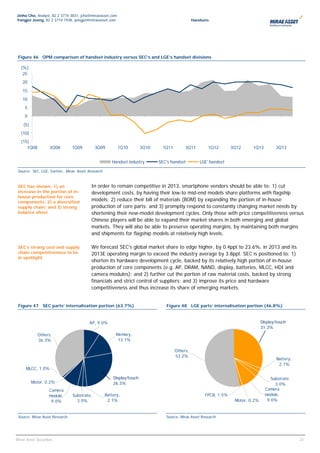
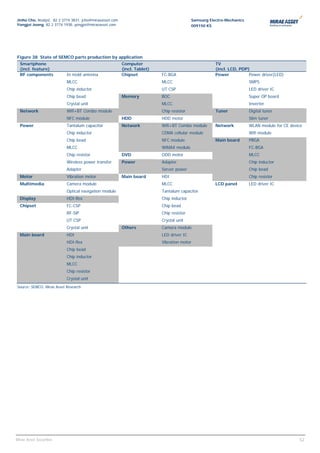
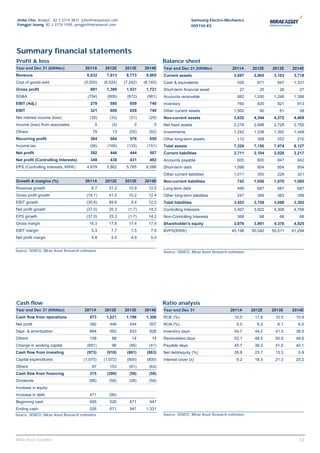
- Competition in the handset industry will intensify in the second half of 2013, lowering industry ASPs and margins as Chinese makers expand globally. However, Samsung Electronics is expected to outperform peers due to its supply chain and cost competitiveness.
- The report recommends Samsung Electro-Mechanics as its top pick, expecting continued growth in Samsung's smartphone shipments to drive up

![Jinho Cho, Analyst, 82 2 3774 3831, jcho@miraeasset.com Handset
Yongjei Jeong, 82 2 3774 1938, yongjei@miraeasset.com
Recommendations
By stock (12 months) By industry
Buy: A target price + 10% or more above the current price, Overweight: over +10% of the current industry index
Hold: Target price within - 10% to +10% of the current price Neutral: -10% to +10% of the current industry index
Reduce: A target price of –10% or less below the current price Underweight: -10% or less than the current industry index
Compliance Notice
This report is distributed to our clients only, and none of the report material may be copied or distributed to any other party. While Mirae Asset Securities have taken all
reasonable care to ensure its reliability, we do not guarantee that it is accurate or complete. Therefore, Mirae Asset Securities shall not be liable for any result from the
use of this report. This report has never been provided to any institutional investor or third party. This report has been prepared without any undue external influence or
interference, and accurately reflects the personal views of the analyst on the company herein. [Analyst: Jinho Cho, Yongjei Jeong]
Securities Held by the Analyst Holdings of Participation
Involvement Treasury
Number of Purchase Purchase share of in Issuance of
Stock Analyst Type with Affiliates Stock Held
Shares Price Date over 1% Securities
REMARK: Korean analyst is responsible for Korean securities and relevant sectors only.
Target Price and Recommendation Chart
Stock Price & Target Price TrendStock PriceTarget Price Samsung Electro-Mechanics (009150 KS)
■ B - Buy■ H - Hold■ R - Reduce
12M target price
Date Recommendation
(KRW)
2012-11-28 BUY (Initiate) 125,000
140000 B 2013-01-03 BUY 125,000
2013-02-01 BUY 125,000
120000 2013-02-14 BUY 125,000
2013-03-05 BUY 125,000
100000
80000
60000
40000
20000
0
Feb-12 Aug-12 Feb-13
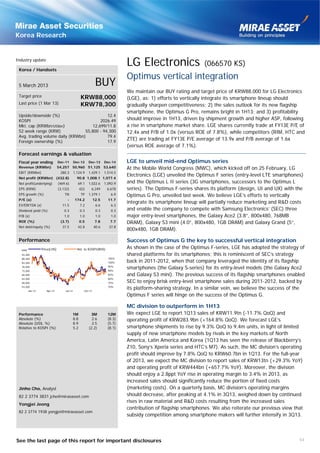
Stock Price & Target Price TrendStock PriceTarget Price LG Electronics (066570 KS)
■ B - Buy■ H - Hold■ R - Reduce
12M target price
Date Recommendation
(KRW)
100000 B
2012-11-28 HOLD (Initiate) 79,000
90000 2012-12-07 HOLD 79,000
2013-01-03 HOLD 79,000
80000
2013-01-31 HOLD 79,000
70000 2013-02-21 BUY 88,000(Up)
2013-03-05 BUY 88,000
60000
50000
40000
30000 H
20000
10000
0
Dec-11 Jun-12 Dec-12
2
Mirae Asset Securities](https://image.slidesharecdn.com/130305miraehandsets-intothestorm2-130322002943-phpapp01/85/130305-mirae-handsets-into-the-storm-70-320.jpg)