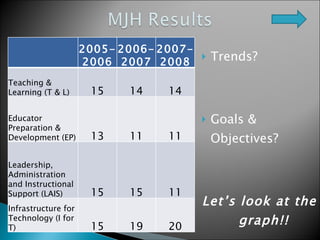
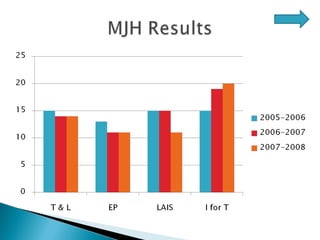
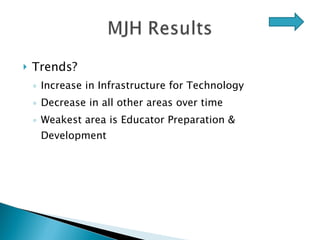
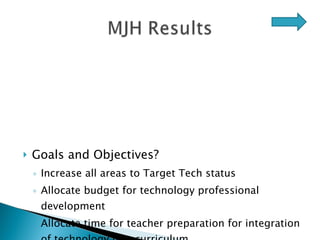
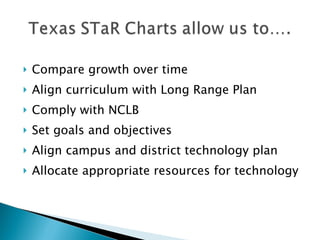
By Constance McGuire
STaR Chart Who, What, When STaR Chart at MJH Results  Trends Goals & Objectives Summary TX STaR Chart allows us to…..
Teachers Campuses Districts
Teachers Complete online survey, annually Helps determine professional growth
Campuses Accumulation of teacher results Helps determine funding/budget Vision alignment Each element can be rate as Early Tech, Developing Tech, Advanced Tech, or Target Tech
Districts Determine need for grants Determine need for resources Vision alignment
Measures progress of integration of technology into the curriculum Supports  No Child Left Behind, Title II, Part D Aligned with  Texas Long Range Plan for Technology, 2006-2020 Supported by  State Board of Education Certification What??
Annually Voluntary 2004-2005 2005-2006 Required Start of 2006-2007 Teachers must take survey! When??
 
Trends? Goals & Objectives? Let’s look at the graph!! 2005-2006 2006-2007 2007-2008 Teaching & Learning (T & L) 15 14 14 Educator Preparation & Development (EP) 13 11 11 Leadership, Administration and Instructional Support (LAIS) 15 15 11 Infrastructure for Technology (I for T) 15 19 20
 
Trends? Goals & Objectives?
Trends? Increase in Infrastructure for Technology Decrease in all other areas over time Weakest area is Educator Preparation & Development
Goals and Objectives? Increase all areas to Target Tech status Allocate budget for technology professional development Allocate time for teacher preparation for integration of technology into curriculum
Compare growth over time Align curriculum with Long Range Plan Comply with NCLB Set goals and objectives  Align campus and district technology plan  Allocate appropriate resources for technology

MJH STaR Chart

  • 1.
  • 2.
    STaR Chart Who,What, When STaR Chart at MJH Results Trends Goals & Objectives Summary TX STaR Chart allows us to…..
  • 3.
  • 4.
    Teachers Complete onlinesurvey, annually Helps determine professional growth
  • 5.
    Campuses Accumulation ofteacher results Helps determine funding/budget Vision alignment Each element can be rate as Early Tech, Developing Tech, Advanced Tech, or Target Tech
  • 6.
    Districts Determine needfor grants Determine need for resources Vision alignment
  • 7.
    Measures progress ofintegration of technology into the curriculum Supports No Child Left Behind, Title II, Part D Aligned with Texas Long Range Plan for Technology, 2006-2020 Supported by State Board of Education Certification What??
  • 8.
    Annually Voluntary 2004-20052005-2006 Required Start of 2006-2007 Teachers must take survey! When??
  • 9.
  • 10.
    Trends? Goals &Objectives? Let’s look at the graph!! 2005-2006 2006-2007 2007-2008 Teaching & Learning (T & L) 15 14 14 Educator Preparation & Development (EP) 13 11 11 Leadership, Administration and Instructional Support (LAIS) 15 15 11 Infrastructure for Technology (I for T) 15 19 20
  • 11.
  • 12.
    Trends? Goals &Objectives?
  • 13.
    Trends? Increase inInfrastructure for Technology Decrease in all other areas over time Weakest area is Educator Preparation & Development
  • 14.
    Goals and Objectives?Increase all areas to Target Tech status Allocate budget for technology professional development Allocate time for teacher preparation for integration of technology into curriculum
  • 15.
    Compare growth overtime Align curriculum with Long Range Plan Comply with NCLB Set goals and objectives Align campus and district technology plan Allocate appropriate resources for technology