
Recommended
Recommended
More Related Content
Similar to Mixed-Projection Treemaps: A Novel Approach Mixing 2D and 3D Treemaps
Similar to Mixed-Projection Treemaps: A Novel Approach Mixing 2D and 3D Treemaps (20)
More from Matthias Trapp
More from Matthias Trapp (20)
Recently uploaded
Recently uploaded (20)
Mixed-Projection Treemaps: A Novel Approach Mixing 2D and 3D Treemaps
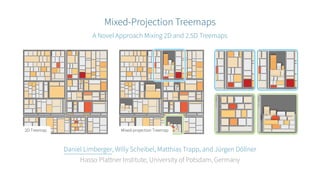
- 1. Mixed-Projection Treemaps A Novel Approach Mixing 2D and 2.5D Treemaps 2D Treemap Mixed-projection Treemap Daniel Limberger, Willy Scheibel, Matthias Trapp, and Jürgen Döllner Hasso Plattner Institute, University of Potsdam, Germany
- 2. Contributions of this Talk Introduction and Problem Statement An introduction to 2D and 2.5D treemaps and issues, e.g., depicting unknown data. Node-Local Tilt A transformation that enables to dynamically mix different projections and seamless integration of 2.5D treemaps for region-of-interests into 2D treemaps. Interactive Tilt Control An interaction concept that enables users to control the projection by means of manual and automated tilting, either providing explicit control or using animated state transitions, respectively. 2 Mixed-Projection Treemaps: A Novel Approach Mixing 2D and 2.5D Treemaps Daniel Limberger, Willy Scheibel, Matthias Trapp, and Jürgen Döllner| iV2017 London 2017-07-12
- 3. Treemaps | Introduction Treemaps [4] are used to visualize tree-structured data, e.g., stock markets [9], sensor data [6], business data [8], file systems [7], software system information [10] 1. non-spatial data is spatialized—it is given a gestalt that preserves the data’s structure, e.g., rectangular treemaps use nested rectangles to depict nodes, 2. and data (attributes) are mapped to visual variables, i.e., properties of the rectangles (size and color). 3 Mixed-Projection Treemaps: A Novel Approach Mixing 2D and 2.5D Treemaps Daniel Limberger, Willy Scheibel, Matthias Trapp, and Jürgen Döllner| iV2017 London 2017-07-12
- 4. Treemaps | Introduction Treemaps [4] are used to visualize tree-structured data, e.g., stock markets [9], sensor data [6], business data [8], file systems [7], software system information [10] 1. non-spatial data is spatialized—it is given a gestalt that preserves the data’s structure, e.g., rectangular treemaps use nested rectangles to depict nodes, 2. and data (attributes) are mapped to visual variables, i.e., properties of the rectangles (size and color). 4 Mixed-Projection Treemaps: A Novel Approach Mixing 2D and 2.5D Treemaps Daniel Limberger, Willy Scheibel, Matthias Trapp, and Jürgen Döllner| iV2017 London 2017-07-12
- 5. Treemaps | Introduction Treemaps [4] are used to visualize tree-structured data, e.g., stock markets [9], sensor data [6], business data [8], file systems [7], software system information [10] 1. non-spatial data is spatialized—it is given a gestalt that preserves the data’s structure, e.g., rectangular treemaps use nested rectangles to depict nodes, 2. and data (attributes) are mapped to visual variables, i.e., properties of the rectangles (size and color). 5 Mixed-Projection Treemaps: A Novel Approach Mixing 2D and 2.5D Treemaps Daniel Limberger, Willy Scheibel, Matthias Trapp, and Jürgen Döllner| iV2017 London 2017-07-12
- 6. Treemaps | Spatialization of Tree-structured Data Leaf nodes are colored and have numerical weights, which can represent any associated attribute, e.g., file size. The weight of a parent node is defined by the sum of the weights of its child nodes. Simple Graph Rectangular Treemap 100 100 10 70 25 8 12 2 2 3 1 5 40 2 6 8 11 6 Mixed-Projection Treemaps: A Novel Approach Mixing 2D and 2.5D Treemaps Daniel Limberger, Willy Scheibel, Matthias Trapp, and Jürgen Döllner| iV2017 London 2017-07-12
- 7. Treemaps | Spatialization of Tree-structured Data Leaf nodes are colored and have numerical weights, which can represent any associated attribute, e.g., file size. The weight of a parent node is defined by the sum of the weights of its child nodes. Simple Graph Rectangular Treemap 8 12 10 70 100 10 70 25 8 12 2 2 3 1 5 40 2 6 8 11 7 Mixed-Projection Treemaps: A Novel Approach Mixing 2D and 2.5D Treemaps Daniel Limberger, Willy Scheibel, Matthias Trapp, and Jürgen Döllner| iV2017 London 2017-07-12
- 8. Treemaps | Spatialization of Tree-structured Data Leaf nodes are colored and have numerical weights, which can represent any associated attribute, e.g., file size. The weight of a parent node is defined by the sum of the weights of its child nodes. Simple Graph Rectangular Treemap 100 10 70 25 8 12 2 2 3 1 5 40 2 6 8 11 8 12 2 2 2 3 1 5 40 25 8 Mixed-Projection Treemaps: A Novel Approach Mixing 2D and 2.5D Treemaps Daniel Limberger, Willy Scheibel, Matthias Trapp, and Jürgen Döllner| iV2017 London 2017-07-12
- 9. Treemaps | Spatialization of Tree-structured Data Leaf nodes are colored and have numerical weights, which can represent any associated attribute, e.g., file size. The weight of a parent node is defined by the sum of the weights of its child nodes. Simple Graph Rectangular Treemap 8 12 2 2 2 3 1 5 40 8 11 6 100 10 70 25 8 12 2 2 3 1 5 40 2 6 8 11 9 Mixed-Projection Treemaps: A Novel Approach Mixing 2D and 2.5D Treemaps Daniel Limberger, Willy Scheibel, Matthias Trapp, and Jürgen Döllner| iV2017 London 2017-07-12
- 10. Treemaps | Spatialization of Tree-structured Data Leaf nodes are colored and have numerical weights, which can represent any associated attribute, e.g., file size. The weight of a parent node is defined by the sum of the weights of its child nodes. Simple Graph Rectangular Treemap 100 10 70 25 8 12 2 2 3 1 5 40 2 6 8 11 8 12 2 2 2 3 1 5 40 8 11 6 10 Mixed-Projection Treemaps: A Novel Approach Mixing 2D and 2.5D Treemaps Daniel Limberger, Willy Scheibel, Matthias Trapp, and Jürgen Döllner| iV2017 London 2017-07-12
- 11. Treemaps | Adding Height as Visual Variable 2.5D Treemap [1] 11 Mixed-Projection Treemaps: A Novel Approach Mixing 2D and 2.5D Treemaps Daniel Limberger, Willy Scheibel, Matthias Trapp, and Jürgen Döllner| iV2017 London 2017-07-12
- 12. Software Maps | Basic Example # complexity nesting-level or McCabe # developers that touched this unit # lines-of-code 12 Mixed-Projection Treemaps: A Novel Approach Mixing 2D and 2.5D Treemaps Daniel Limberger, Willy Scheibel, Matthias Trapp, and Jürgen Döllner| iV2017 London 2017-07-12
- 13. Problem Statement | Exploration of Unknown Data Exploration of unknown data is highly iterative and hinders use of well-tuned map themes. In order to reduce cognitive load, the following iterative approach is applied: 13 Mixed-Projection Treemaps: A Novel Approach Mixing 2D and 2.5D Treemaps Daniel Limberger, Willy Scheibel, Matthias Trapp, and Jürgen Döllner| iV2017 London 2017-07-12
- 14. Problem Statement | Exploration of Unknown Data Exploration of unknown data is highly iterative and hinders use of well-tuned map themes. In order to reduce cognitive load, the following iterative approach is applied: Topology, Weight 14 Mixed-Projection Treemaps: A Novel Approach Mixing 2D and 2.5D Treemaps Daniel Limberger, Willy Scheibel, Matthias Trapp, and Jürgen Döllner| iV2017 London 2017-07-12
- 15. Problem Statement | Exploration of Unknown Data Exploration of unknown data is highly iterative and hinders use of well-tuned map themes. In order to reduce cognitive load, the following iterative approach is applied: Topology, Weight Topology, Weight, Color 15 Mixed-Projection Treemaps: A Novel Approach Mixing 2D and 2.5D Treemaps Daniel Limberger, Willy Scheibel, Matthias Trapp, and Jürgen Döllner| iV2017 London 2017-07-12
- 16. Problem Statement | Exploration of Unknown Data Exploration of unknown data is highly iterative and hinders use of well-tuned map themes. In order to reduce cognitive load, the following iterative approach is applied: Topology, Weight Topology, Weight, Color Topology, Weight, Color, Height 16 Mixed-Projection Treemaps: A Novel Approach Mixing 2D and 2.5D Treemaps Daniel Limberger, Willy Scheibel, Matthias Trapp, and Jürgen Döllner| iV2017 London 2017-07-12
- 17. Problem Statement | Exploration of Unknown Data Exploration of unknown data is highly iterative and hinders use of well-tuned map themes. In order to reduce cognitive load, the following iterative approach is applied: Topology, Weight Topology, Weight, Color Topology, Weight, Color, Height 17 Mixed-Projection Treemaps: A Novel Approach Mixing 2D and 2.5D Treemaps Daniel Limberger, Willy Scheibel, Matthias Trapp, and Jürgen Döllner| iV2017 London 2017-07-12
- 18. Problem Statement | Exploration of Unknown Data Exploration of unknown data is highly iterative and hinders use of well-tuned map themes. In order to reduce cognitive load, the following iterative approach is applied: Topology, Weight Topology, Weight, Color Mixed-Projection Full 2.5D (optional) 18 Mixed-Projection Treemaps: A Novel Approach Mixing 2D and 2.5D Treemaps Daniel Limberger, Willy Scheibel, Matthias Trapp, and Jürgen Döllner| iV2017 London 2017-07-12
- 19. Approach | Node-local Tilt Tilt The rotation of an inner node (and its children) to enable exploration of additional attributes using visual variables common for 2.5D treemaps (e.g., height, transparency, sketchiness). Any tilt comprises the following two node-local operations: • a tilt transformation Λ = [TC] TAT−1 R RTR • and a tilt projection Γ = (1 − t) P0 + tP1. 19 Mixed-Projection Treemaps: A Novel Approach Mixing 2D and 2.5D Treemaps Daniel Limberger, Willy Scheibel, Matthias Trapp, and Jürgen Döllner| iV2017 London 2017-07-12
- 20. Approach | Node-local Tilt Tilt The rotation of an inner node (and its children) to enable exploration of additional attributes using visual variables common for 2.5D treemaps (e.g., height, transparency, sketchiness). Any tilt comprises the following two node-local operations: • a tilt transformation Λ = [TC] TAT−1 R RTR • and a tilt projection Γ = (1 − t) P0 + tP1. 20 Mixed-Projection Treemaps: A Novel Approach Mixing 2D and 2.5D Treemaps Daniel Limberger, Willy Scheibel, Matthias Trapp, and Jürgen Döllner| iV2017 London 2017-07-12
- 21. Approach | Node-local Tilt | Transformation Λ = [TC] TAT−1 R RTR TR shifts the node’s rotation axis using a relative offset τ ∈ [−1, +1]1 R rotates the node by the tilt angle α TA anchors the node to a preferred relative location υ ∈ [−1, +1]1 TC reduces occlusion introduced when using a perspective projection (optional). 0 1−1 at bottom and +1 at top, 0 at center. 21 Mixed-Projection Treemaps: A Novel Approach Mixing 2D and 2.5D Treemaps Daniel Limberger, Willy Scheibel, Matthias Trapp, and Jürgen Döllner| iV2017 London 2017-07-12
- 22. Approach | Node-local Tilt | Transformation Λ = [TC] TAT−1 R RTR TR shifts the node’s rotation axis using a relative offset τ ∈ [−1, +1]1 R rotates the node by the tilt angle α TA anchors the node to a preferred relative location υ ∈ [−1, +1]1 TC reduces occlusion introduced when using a perspective projection (optional). TR 1 1−1 at bottom and +1 at top, 0 at center. 22 Mixed-Projection Treemaps: A Novel Approach Mixing 2D and 2.5D Treemaps Daniel Limberger, Willy Scheibel, Matthias Trapp, and Jürgen Döllner| iV2017 London 2017-07-12
- 23. Approach | Node-local Tilt | Transformation Λ = [TC] TAT−1 R RTR TR shifts the node’s rotation axis using a relative offset τ ∈ [−1, +1]1 R rotates the node by the tilt angle α TA anchors the node to a preferred relative location υ ∈ [−1, +1]1 TC reduces occlusion introduced when using a perspective projection (optional). α R 2 1−1 at bottom and +1 at top, 0 at center. 23 Mixed-Projection Treemaps: A Novel Approach Mixing 2D and 2.5D Treemaps Daniel Limberger, Willy Scheibel, Matthias Trapp, and Jürgen Döllner| iV2017 London 2017-07-12
- 24. Approach | Node-local Tilt | Transformation Λ = [TC] TAT−1 R RTR TR shifts the node’s rotation axis using a relative offset τ ∈ [−1, +1]1 R rotates the node by the tilt angle α TA anchors the node to a preferred relative location υ ∈ [−1, +1]1 TC reduces occlusion introduced when using a perspective projection (optional). 3 TR -1 1−1 at bottom and +1 at top, 0 at center. 24 Mixed-Projection Treemaps: A Novel Approach Mixing 2D and 2.5D Treemaps Daniel Limberger, Willy Scheibel, Matthias Trapp, and Jürgen Döllner| iV2017 London 2017-07-12
- 25. Approach | Node-local Tilt | Transformation Λ = [TC] TAT−1 R RTR TR shifts the node’s rotation axis using a relative offset τ ∈ [−1, +1]1 R rotates the node by the tilt angle α TA anchors the node to a preferred relative location υ ∈ [−1, +1]1 TC reduces occlusion introduced when using a perspective projection (optional). TA 4 1−1 at bottom and +1 at top, 0 at center. 25 Mixed-Projection Treemaps: A Novel Approach Mixing 2D and 2.5D Treemaps Daniel Limberger, Willy Scheibel, Matthias Trapp, and Jürgen Döllner| iV2017 London 2017-07-12
- 26. Approach | Node-local Tilt | Transformation Λ = [TC] TAT−1 R RTR TR shifts the node’s rotation axis using a relative offset τ ∈ [−1, +1]1 R rotates the node by the tilt angle α TA anchors the node to a preferred relative location υ ∈ [−1, +1]1 TC reduces occlusion introduced when using a perspective projection (optional). TC 5 1−1 at bottom and +1 at top, 0 at center. 26 Mixed-Projection Treemaps: A Novel Approach Mixing 2D and 2.5D Treemaps Daniel Limberger, Willy Scheibel, Matthias Trapp, and Jürgen Döllner| iV2017 London 2017-07-12
- 27. Approach | Node-local Tilt | Transformation Tilt transformation Λ of an inner-node n with perspective projection: 0 TR 1 α R 2 3 TR -1 TA 4 TC 5 n is (1) translated by TR for (2) rotation by R with α = 60◦ at the local tilt offset τ = 0.5. After (3) translating n (T −1 R ) it is (4) moved to the bottom anchor by TA with υ = −1 and, (5) shifted up again by TC in order to reduce the occlusion caused by the perspective projection. 27 Mixed-Projection Treemaps: A Novel Approach Mixing 2D and 2.5D Treemaps Daniel Limberger, Willy Scheibel, Matthias Trapp, and Jürgen Döllner| iV2017 London 2017-07-12
- 28. Approach | Node-local Tilt | Projection Γ = (1 − t) P0 + tP1 mixes any two given projections P0 and P1 with respect to the node local tilt angle α and a global angular threshold β with P0 as orthographic projection, P1 as perspective projection that cover the exact same treemap region, and t = αβ−1 , clamped to [0, 1]. 28 Mixed-Projection Treemaps: A Novel Approach Mixing 2D and 2.5D Treemaps Daniel Limberger, Willy Scheibel, Matthias Trapp, and Jürgen Döllner| iV2017 London 2017-07-12
- 29. Approach | Node-local Tilt | Projection Γ = (1 − t) P0 + tP1 mixes any two given projections P0 and P1 with respect to the node local tilt angle α and a global angular threshold β with P0 as orthographic projection, P1 as perspective projection that cover the exact same treemap region, and t = αβ−1 , clamped to [0, 1]. 29 Mixed-Projection Treemaps: A Novel Approach Mixing 2D and 2.5D Treemaps Daniel Limberger, Willy Scheibel, Matthias Trapp, and Jürgen Döllner| iV2017 London 2017-07-12
- 30. Approach | Node-local Tilt | Projection Γ = (1 − t) P0 + tP1 mixes any two given projections P0 and P1 with respect to the node local tilt angle α and a global angular threshold β with P0 as orthographic projection, P1 as perspective projection that cover the exact same treemap region, and t = αβ−1 , clamped to [0, 1]. 30 Mixed-Projection Treemaps: A Novel Approach Mixing 2D and 2.5D Treemaps Daniel Limberger, Willy Scheibel, Matthias Trapp, and Jürgen Döllner| iV2017 London 2017-07-12
- 31. Approach | Node-local Tilt | Projection Γ = (1 − t) P0 + tP1 mixes any two given projections P0 and P1 with respect to the node local tilt angle α and a global angular threshold β with P0 as orthographic projection, P1 as perspective projection that cover the exact same treemap region, and t = αβ−1 , clamped to [0, 1]. 31 Mixed-Projection Treemaps: A Novel Approach Mixing 2D and 2.5D Treemaps Daniel Limberger, Willy Scheibel, Matthias Trapp, and Jürgen Döllner| iV2017 London 2017-07-12
- 32. Approach | Node-local Tilt | Parametrization for α = 60◦ Ortho Persp, τ = −1 Persp, τ = 0 Persp, τ = +1 υ = −1 (bottom) υ = 0 (center) υ = +1 (top) 32 Mixed-Projection Treemaps: A Novel Approach Mixing 2D and 2.5D Treemaps Daniel Limberger, Willy Scheibel, Matthias Trapp, and Jürgen Döllner| iV2017 London 2017-07-12
- 33. Approach | Interactive Tilt Control Interaction Users can interact directly with treemap nodes based on direct manipulation metaphors. For it we suggest two similar tilt modes: • automated tilt enabling users to invoke a preset tilt angle or un-tilt any node by a single input event, e.g., click/touch to an inner node, • manual tilt enabling users to increase and decrease the tilt angle of any node seamlessly, e.g., via click/touch to an inner node and vertical drag down. 33 Mixed-Projection Treemaps: A Novel Approach Mixing 2D and 2.5D Treemaps Daniel Limberger, Willy Scheibel, Matthias Trapp, and Jürgen Döllner| iV2017 London 2017-07-12
- 34. Approach | Interactive Tilt Control Interaction Users can interact directly with treemap nodes based on direct manipulation metaphors. For it we suggest two similar tilt modes: • automated tilt enabling users to invoke a preset tilt angle or un-tilt any node by a single input event, e.g., click/touch to an inner node, • manual tilt enabling users to increase and decrease the tilt angle of any node seamlessly, e.g., via click/touch to an inner node and vertical drag down. 34 Mixed-Projection Treemaps: A Novel Approach Mixing 2D and 2.5D Treemaps Daniel Limberger, Willy Scheibel, Matthias Trapp, and Jürgen Döllner| iV2017 London 2017-07-12
- 35. Approach | Automated Tilt (local) 35 Mixed-Projection Treemaps: A Novel Approach Mixing 2D and 2.5D Treemaps Daniel Limberger, Willy Scheibel, Matthias Trapp, and Jürgen Döllner| iV2017 London 2017-07-12
- 36. Approach | Manual Tilt (global) 36 Mixed-Projection Treemaps: A Novel Approach Mixing 2D and 2.5D Treemaps Daniel Limberger, Willy Scheibel, Matthias Trapp, and Jürgen Döllner| iV2017 London 2017-07-12
- 37. Future Work Additional Rotation Non-rectangular Treemaps [3] Available Screen Space 37 Mixed-Projection Treemaps: A Novel Approach Mixing 2D and 2.5D Treemaps Daniel Limberger, Willy Scheibel, Matthias Trapp, and Jürgen Döllner| iV2017 London 2017-07-12
- 38. Conclusion and Contact Information This talk presented • a node-local tilt transformation and • interactive tilt control in order to facilitate exploration of unknown data using 2D and 2.5D treemaps. Author email addresses: • daniel.limberger@hpi.de • willy.scheibel@hpi.de • matthias.trapp@hpi.de • juergen-doellner@hpi.de 38 Mixed-Projection Treemaps: A Novel Approach Mixing 2D and 2.5D Treemaps Daniel Limberger, Willy Scheibel, Matthias Trapp, and Jürgen Döllner| iV2017 London 2017-07-12
- 39. Bibliography I [1] BLADH, T., CARR, D. A., AND SCHOLL, J. Extending tree-maps to three dimensions: A comparative study. In Proc. APCHI (2004), pp. 50–59. [2] BOHNET, J., AND DÖLLNER, J. Monitoring code quality and development activity by software maps. In Proc. ACM MTD (2011), pp. 9–16. [3] HAHN, S., AND DÖLLNER, J. Hybrid-treemap layouting. In Proceedings of EuroVis 2017 - Short Papers (2017). [4] JOHNSON, B., AND SHNEIDERMAN, B. Treemaps: A space-filling approach to the visualization of hierarchical information structures. In Proc. IEEE VIS (1991), pp. 284–291. 39 Mixed-Projection Treemaps: A Novel Approach Mixing 2D and 2.5D Treemaps Daniel Limberger, Willy Scheibel, Matthias Trapp, and Jürgen Döllner| iV2017 London 2017-07-12
- 40. Bibliography II [5] MCCABE, T. J. A complexity measure. vol. SE-2, pp. 308–320. [6] MITCHELL, W., SHOOK, D., AND SHAH, S. L. A picture worth a thousand control loops: An innovative way of visualizing controller performance data. In Invited Plenary Presentation, Control Systems (2004). [7] SHNEIDERMAN, B. Tree visualization with treemaps: A 2D space-filling approach. ACM Trans. Graph. 11, 1 (1992), 92–99. [8] VLIEGEN, R., VAN WIJK, J. J., AND VAN DER LINDEN, E.-J. Visualizing business data with generalized treemaps. IEEE Trans. Vis. Comput. Graph. 12, 5 (2006), 789–796. 40 Mixed-Projection Treemaps: A Novel Approach Mixing 2D and 2.5D Treemaps Daniel Limberger, Willy Scheibel, Matthias Trapp, and Jürgen Döllner| iV2017 London 2017-07-12
- 41. Bibliography III [9] WATTENBERG, M. Visualizing the stock market. In Proc. ACM CHI EA (1999), pp. 188–189. [10] WETTEL, R., AND LANZA, M. CodeCity: 3d visualization of large-scale software. In Proc. ACM ICSE Companion (2008), pp. 921–922. 41 Mixed-Projection Treemaps: A Novel Approach Mixing 2D and 2.5D Treemaps Daniel Limberger, Willy Scheibel, Matthias Trapp, and Jürgen Döllner| iV2017 London 2017-07-12
- 42. Software Maps | Map Theme For a given task, a map theme specifies the mapping of attributes to visual variables. Technical Depth maps logic lines-of-code to weight, a nesting-level metric to color, and McCabe complexity [5]. It is used to reveal and monitor the ’technical debts’ inherent to a software system’s implementation. Risk of Knowledge Drain maps logic lines-of-code to weight, the number of active developers to color, and a composite, nesting-level or McCabe based complexity measure indicating difficult-to-comprehend code to height. It is used to identify complex code units known only by few developers and reveal knowledge distribution. 42 Mixed-Projection Treemaps: A Novel Approach Mixing 2D and 2.5D Treemaps Daniel Limberger, Willy Scheibel, Matthias Trapp, and Jürgen Döllner| iV2017 London 2017-07-12
- 43. Software Maps | Map Theme For a given task, a map theme specifies the mapping of attributes to visual variables. Technical Depth maps logic lines-of-code to weight, a nesting-level metric to color, and McCabe complexity [5]. It is used to reveal and monitor the ’technical debts’ inherent to a software system’s implementation. Risk of Knowledge Drain maps logic lines-of-code to weight, the number of active developers to color, and a composite, nesting-level or McCabe based complexity measure indicating difficult-to-comprehend code to height. It is used to identify complex code units known only by few developers and reveal knowledge distribution. 43 Mixed-Projection Treemaps: A Novel Approach Mixing 2D and 2.5D Treemaps Daniel Limberger, Willy Scheibel, Matthias Trapp, and Jürgen Döllner| iV2017 London 2017-07-12
- 44. Software Maps | Map Theme For a given task, a map theme specifies the mapping of attributes to visual variables. Technical Depth maps logic lines-of-code to weight, a nesting-level metric to color, and McCabe complexity [5]. It is used to reveal and monitor the ’technical debts’ inherent to a software system’s implementation. Risk of Knowledge Drain maps logic lines-of-code to weight, the number of active developers to color, and a composite, nesting-level or McCabe based complexity measure indicating difficult-to-comprehend code to height. It is used to identify complex code units known only by few developers and reveal knowledge distribution. 44 Mixed-Projection Treemaps: A Novel Approach Mixing 2D and 2.5D Treemaps Daniel Limberger, Willy Scheibel, Matthias Trapp, and Jürgen Döllner| iV2017 London 2017-07-12
- 45. Software Maps | Goals Make code quality of software systems visible to “stakeholders in the development process, particularly, to the management” [2] by means of depicting, e.g., metrics and activity data. Depending on the applied map theme Software Maps facilitate • exploring structures, • monitoring development processes, • monitoring software quality, and • identifying areas that require attention in the ongoing development process. 45 Mixed-Projection Treemaps: A Novel Approach Mixing 2D and 2.5D Treemaps Daniel Limberger, Willy Scheibel, Matthias Trapp, and Jürgen Döllner| iV2017 London 2017-07-12