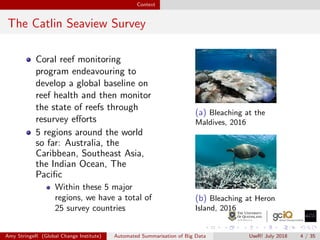
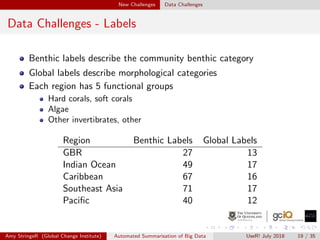
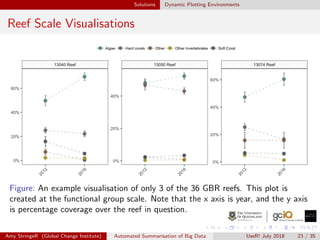
This document discusses automated summarization of large datasets from the Catlin Seaview Survey, a global coral reef monitoring effort. It collects images of reefs automatically during surveys and annotates them using machine learning. The author aims to efficiently summarize the big data using dynamic RMarkdown reports connected to a MySQL database. This will allow non-experts to explore trends in the data through interactive visualizations and maps.
![IntRoduction
[Insert witty crowd banter]
Amy StringeR (Global Change Institute) Automated Summarisation of Big Data UseR! July 2018 3 / 35](https://image.slidesharecdn.com/main-180712034417/85/Automated-Summarisation-of-Big-Data-useR-2018-3-320.jpg)

![Context Image Collection
The Catlin Seaview Survey - Image Collection
High definition images
collected in 2km transects
along a reef section - taken
automatically every 3 seconds
Each image is GPS located
Speed of collection increased
from traditional 60m2 per dive
(45 min) to 2000m2 per dive Figure: A diver pushing the SVII scooter
during a survey of the Great Barrier reef.
For more on collection methodology, see
[7] c XL Catlin Seaview Survey
Amy StringeR (Global Change Institute) Automated Summarisation of Big Data UseR! July 2018 8 / 35](https://image.slidesharecdn.com/main-180712034417/85/Automated-Summarisation-of-Big-Data-useR-2018-8-320.jpg)
![Context Image Collection
Figure: An example image from a survey of the Great Barrier Reef. Images like
this, along with the data, are available on the XL Catlin Global Reef Record [1].
Amy StringeR (Global Change Institute) Automated Summarisation of Big Data UseR! July 2018 9 / 35](https://image.slidesharecdn.com/main-180712034417/85/Automated-Summarisation-of-Big-Data-useR-2018-9-320.jpg)
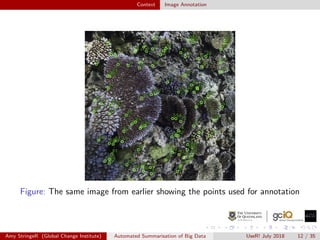
![Context Image Annotation
Neural Network for Image Annotations
Previously a time consuming, manual task (potentially 3 decades of
work for the CSS images)
An automatic point-annotation method is now used based on
machine learning algorithms (See [3])
Colour and texture of images are used as descriptors for label
categories
Coverage estimates are uploading within a week of collection
Amy StringeR (Global Change Institute) Automated Summarisation of Big Data UseR! July 2018 11 / 35](https://image.slidesharecdn.com/main-180712034417/85/Automated-Summarisation-of-Big-Data-useR-2018-11-320.jpg)
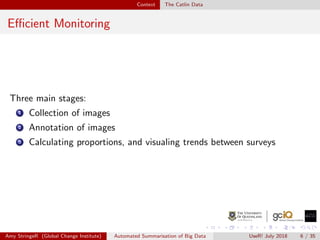
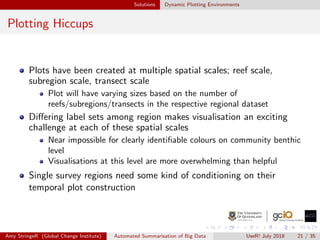
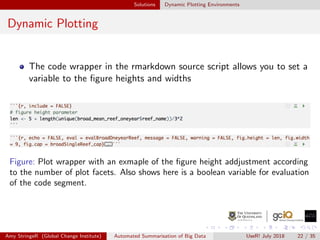
![The Need Efficient SummaRisation
The Next Stage
Fast data collection → fast annotation → bottle neck in processing
Data stored using MySQL database, allowing for easy integration with
R [6, 5]
Introducing Rmarkdown [2]
rmarkdown provides a solution for quick/consistent exploratory
analysis of the data in a report format
Visualisations! [8]
Amy StringeR (Global Change Institute) Automated Summarisation of Big Data UseR! July 2018 14 / 35](https://image.slidesharecdn.com/main-180712034417/85/Automated-Summarisation-of-Big-Data-useR-2018-14-320.jpg)
![Solutions Interactive Maps using Leaflet
Leaflet
Using Leaflet [4] for interactive maps allows for readers to see where
exactly the surveys take place. Each transect marker represents a 2km
survey region.
Figure: Disclaimer - this image is not so interactive
Amy StringeR (Global Change Institute) Automated Summarisation of Big Data UseR! July 2018 27 / 35](https://image.slidesharecdn.com/main-180712034417/85/Automated-Summarisation-of-Big-Data-useR-2018-27-320.jpg)
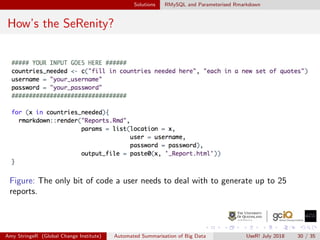
![Solutions RMySQL and Parameterised Rmarkdown
Parameterising Rmarkdown Documents and RMySQL
RMySQL [5] allows for accessing the database through Rstudio negating
the need for an external program
(a) The header when making use of
document parameters. In future, more
parameters may be added to simplify the
source script, but in the current stages
things have been kept simple.
(b) Working example accessing the
database with the document input
parameters. The use of RMySQL allows
for connection to the database and
extraction of data within the Rmarkdown
source script.
Amy StringeR (Global Change Institute) Automated Summarisation of Big Data UseR! July 2018 29 / 35](https://image.slidesharecdn.com/main-180712034417/85/Automated-Summarisation-of-Big-Data-useR-2018-29-320.jpg)