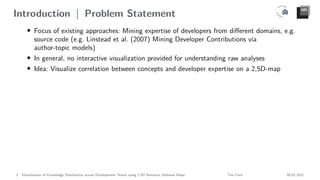
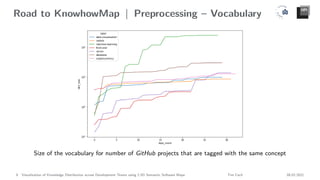
1) The document presents a method for visualizing knowledge distribution across software development teams using 2.5D semantic maps. It mines developer expertise from source code commit histories using natural language processing and latent Dirichlet allocation.
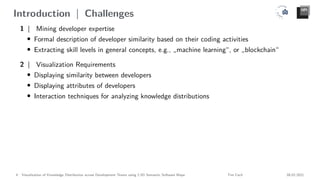
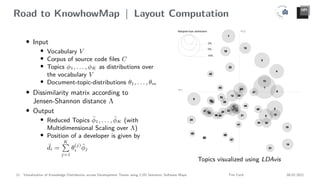
2) Developer expertise is represented as probability distributions over extracted topics. Developers are placed in a 2D reference space based on these distributions, with distances representing semantic relatedness.
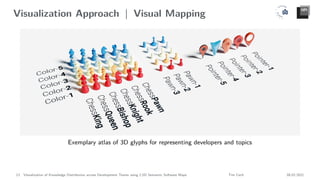
3) An interactive visualization is created where developer expertise levels in different concepts are represented through 3D glyphs, allowing analysis of knowledge distributions across teams.
Vision and reflection on Mining Software Repositories research in 2024
Visualizing Knowledge Distribution using 2.5D Semantic Maps
1. Visualization of Knowledge Distribution
across Development Teams using
2.5D Semantic Software Maps
IVAPP | February 8th
2022, Vienna
Daniel Atzberger, Tim Cech, Adrian Jobst, Willy Scheibel,
Daniel Limberger, Matthias Trapp, and Jürgen Döllner
Hasso-Plattner-Institute, Digital Engineering Faculty, University of Potsdam, Germany
08.02.2022
2. Introduction | Motivation
”The people working in a software organization are its greatest
assets. It is expensive to recruit and retain good people, and it is up
to software managers to ensure that the engineers working on a
project are as productive as possible. In successful companies and
economies, this productivity is achieved when people are respected
by the organization and are assigned responsibilities that reflect
their skills and experience.”
I. Sommerville, Software Engineering. 9th Ed., Harlow 2016, p. 652
2 Visualization of Knowledge Distribution across Development Teams using 2.5D Semantic Software Maps Tim Cech 08.02.2021
3. Introduction | Problem Statement
• Focus of existing approaches: Mining expertise of developers from different domains, e.g.
source code (e.g. Linstead et al. (2007) Mining Developer Contributions via
author-topic models)
• In general, no interactive visualization provided for understanding raw analyses
• Idea: Visualize correlation between concepts and developer expertise on a 2,5D-map
3 Visualization of Knowledge Distribution across Development Teams using 2.5D Semantic Software Maps Tim Cech 08.02.2021
4. Introduction | Challenges
1 | Mining developer expertise
• Formal description of developer similarity based on their coding activities
• Extracting skill levels in general concepts, e.g., „machine learning“, or „blockchain“
2 | Visualization Requirements
• Displaying similarity between developers
• Displaying attributes of developers
• Interaction techniques for analyzing knowledge distributions
4 Visualization of Knowledge Distribution across Development Teams using 2.5D Semantic Software Maps Tim Cech 08.02.2021
5. Introduction | Idea & Approach
1 | Mining developer expertise
• Get meaningful corpus with natural language processing (NLP) techniques
• Application of Latent Dirichlet Allocation (LDA) on the commit history of developers
• Training an Labeled LDA (LLDA) model on a corpus of GitHub projects for extracting
vocabulary of a concept
2 | Visualization Requirements
• Based on extracted topics and document-topic distributions developers are placed on a
2D reference space
• Distances display semantic relatedness
• Data related to the expertise of developers mapped onto the visual variables of 3D glyphs
5 Visualization of Knowledge Distribution across Development Teams using 2.5D Semantic Software Maps Tim Cech 08.02.2021
6. Road to KnowhowMap | Process Overview
6 Visualization of Knowledge Distribution across Development Teams using 2.5D Semantic Software Maps Tim Cech 08.02.2021
7. Road to KnowhowMap | Mining Expertise
Assumption: Developers knowledge is directly encoded in the source code.
• Similar developers use a common vocabulary (e.g. Saxena and Pedanekar (2017): [...]
Mining candidate expertise from github repositories)
• Statistical language models can be used to describe developers as high-dimensional feature
vectors (e.g. Linstead et al. (2007): Mining eclipse developer contributions via
author-topic models)
7 Visualization of Knowledge Distribution across Development Teams using 2.5D Semantic Software Maps Tim Cech 08.02.2021
8. Road to KnowhowMap | Preprocessing – NLP
• Crawling source code files
• Remove symbols and split up words
• Remove very common words (stop words)
• Get corpus per concept and developer
8 Visualization of Knowledge Distribution across Development Teams using 2.5D Semantic Software Maps Tim Cech 08.02.2021
9. Road to KnowhowMap | Preprocessing – Vocabulary
Size of the vocabulary for number of GitHub projects that are tagged with the same concept
9 Visualization of Knowledge Distribution across Development Teams using 2.5D Semantic Software Maps Tim Cech 08.02.2021
10. Road to KnowhowMap | Preprocessing – LDA
10 Visualization of Knowledge Distribution across Development Teams using 2.5D Semantic Software Maps Tim Cech 08.02.2021
11. Road to KnowhowMap | Concept Mining with LLDA
• Document has only a non-zero value in a topic, when it is marked with its associated tag
• Training on a corpus of GitHub projects, leads to concept-specific vocabulary
• Locating keywords of a concept in the commit history of developer results in a skill level
Machine Learning Cryptocurrency Database Server Data Visualization
th order db request chart
tensor crypto table server series
self binance key header axis
cuda price name http pixi
model trade value body datum
license wallet opt response point
layer exchange sql message style
11 Visualization of Knowledge Distribution across Development Teams using 2.5D Semantic Software Maps Tim Cech 08.02.2021
12. Road to KnowhowMap | Layout Computation
• Input
• Vocabulary V
• Corpus of source code files C
• Topics ϕ1, . . . , ϕK as distributions over
the vocabulary V
• Document-topic-distributions θ1, . . . , θm
• Dissimilarity matrix according to
Jensen-Shannon distance Λ
• Output
• Reduced Topics ϕ̄1, . . . , ϕ̄K (with
Multidimensional Scaling over Λ)
• Position of a developer is given by
¯
di =
K
P
j=1
θ
(j)
i ϕ̄j
Topics visualized using LDAvis
12 Visualization of Knowledge Distribution across Development Teams using 2.5D Semantic Software Maps Tim Cech 08.02.2021
13. Visualization Approach | Visual Mapping
Exemplary atlas of 3D glyphs for representing developers and topics
13 Visualization of Knowledge Distribution across Development Teams using 2.5D Semantic Software Maps Tim Cech 08.02.2021
14. Visualization Approach | Annotations
On demand further details about the skills of a developer are displayed
14 Visualization of Knowledge Distribution across Development Teams using 2.5D Semantic Software Maps Tim Cech 08.02.2021
15. Visualization Approach | Example result
KnowhowMap for the Bitcoin Core project (github.com/bitcoin/bitcoin) based on 2000 commits.
15 Visualization of Knowledge Distribution across Development Teams using 2.5D Semantic Software Maps Tim Cech 08.02.2021
16. Conclusions
Contributions
• 2.5D visualization, showing semantic relatedness between developers based on their
source code activities
• Novel method for extracting skills in high-level concepts by training an LLDA model on a
dynamically generated corpus of GitHub projects
• Allows various visual mappings for different use cases
Future Work
• Further evaluation of the proposed expertise mining technique
• User study to evaluate the effectiveness of our visualization approach
16 Visualization of Knowledge Distribution across Development Teams using 2.5D Semantic Software Maps Tim Cech 08.02.2021
17. Contact
• Daniel Atzberger
• Tim Cech,
tim.cech@hpi.uni-potsdam.de
• Adrian Jobst
• Willy Scheibel
• Daniel Limberger
• Dr. Matthias Trapp
• Prof. Dr. Jürgen Döllner
Acknowledgements
This work is part of the „Software-DNA“ project, which is funded
by the European Regional Development Fund (ERDF or EFRE in
German) and the State of Brandenburg (ILB). This work is part of
the KMU project „KnowhowAnalyzer“ (Förderkennzeichen
01IS20088B), which is funded by the German Ministry for
Education and Research (Bundesministerium für Bildung und
Forschung).
17 Visualization of Knowledge Distribution across Development Teams using 2.5D Semantic Software Maps Tim Cech 08.02.2021
18. References I
[Atzberger et al., 2022] Atzberger, D., Cech, T., Jobst, A., Scheibel, W., Limberger, D., Trapp,
M., and Döllner, J. (2022). Visualization of knowledge distribution across development
teams using 2.5d semantic software maps. In Proc. 13th International Conference on
Information Visualization Theory and Applications, IVAPP ’22. INSTICC, SciTePress.
[Blei et al., 2003] Blei, D. M., Ng, A. Y., and Jordan, M. I. (2003). Latent dirichlet allocation.
Journal of Machine Learning Research, 3:993–1022.
[Cox and Cox, 2008] Cox, M. A. and Cox, T. F. (2008). Multidimensional scaling. In
Handbook of Data Visualization, pages 315–347. Springer.
[Kuhn et al., 2008] Kuhn, A., Loretan, P., and Nierstrasz, O. (2008). Consistent layout for
thematic software maps. In Proc. 15th Working Conference on Reverse Engineering, WCRE
’08, pages 209–218. IEEE.
[Linstead et al., 2007] Linstead, E., Rigor, P., Bajracharya, S., Lopes, C., and Baldi, P. (2007).
Mining eclipse developer contributions via author-topic models. In Proc. 4th International
Workshop on Mining Software Repositories, MSR ’07, pages 30:1–4.
18 Visualization of Knowledge Distribution across Development Teams using 2.5D Semantic Software Maps Tim Cech 08.02.2021
19. References II
[Ramage et al., 2009] Ramage, D., Hall, D., Nallapati, R., and Manning, C. D. (2009).
Labeled LDA: A supervised topic model for credit attribution in multi-labeled corpora. In
Proceedings of the 2009 Conference on Empirical Methods in Natural Language Processing,
pages 248–256, Singapore. Association for Computational Linguistics.
[Saxena and Pedanekar, 2017] Saxena, R. and Pedanekar, N. (2017). I know what you coded
last summer: Mining candidate expertise from github repositories. In Companion of the 2017
ACM Conference on Computer Supported Cooperative Work and Social Computing, pages
299–302.
[Sievert and Shirley, 2014] Sievert, C. and Shirley, K. (2014). Ldavis: A method for visualizing
and interpreting topics. In Proc. Workshop on Interactive Language Learning, Visualization,
and Interfaces, pages 63–70. ACL.
19 Visualization of Knowledge Distribution across Development Teams using 2.5D Semantic Software Maps Tim Cech 08.02.2021