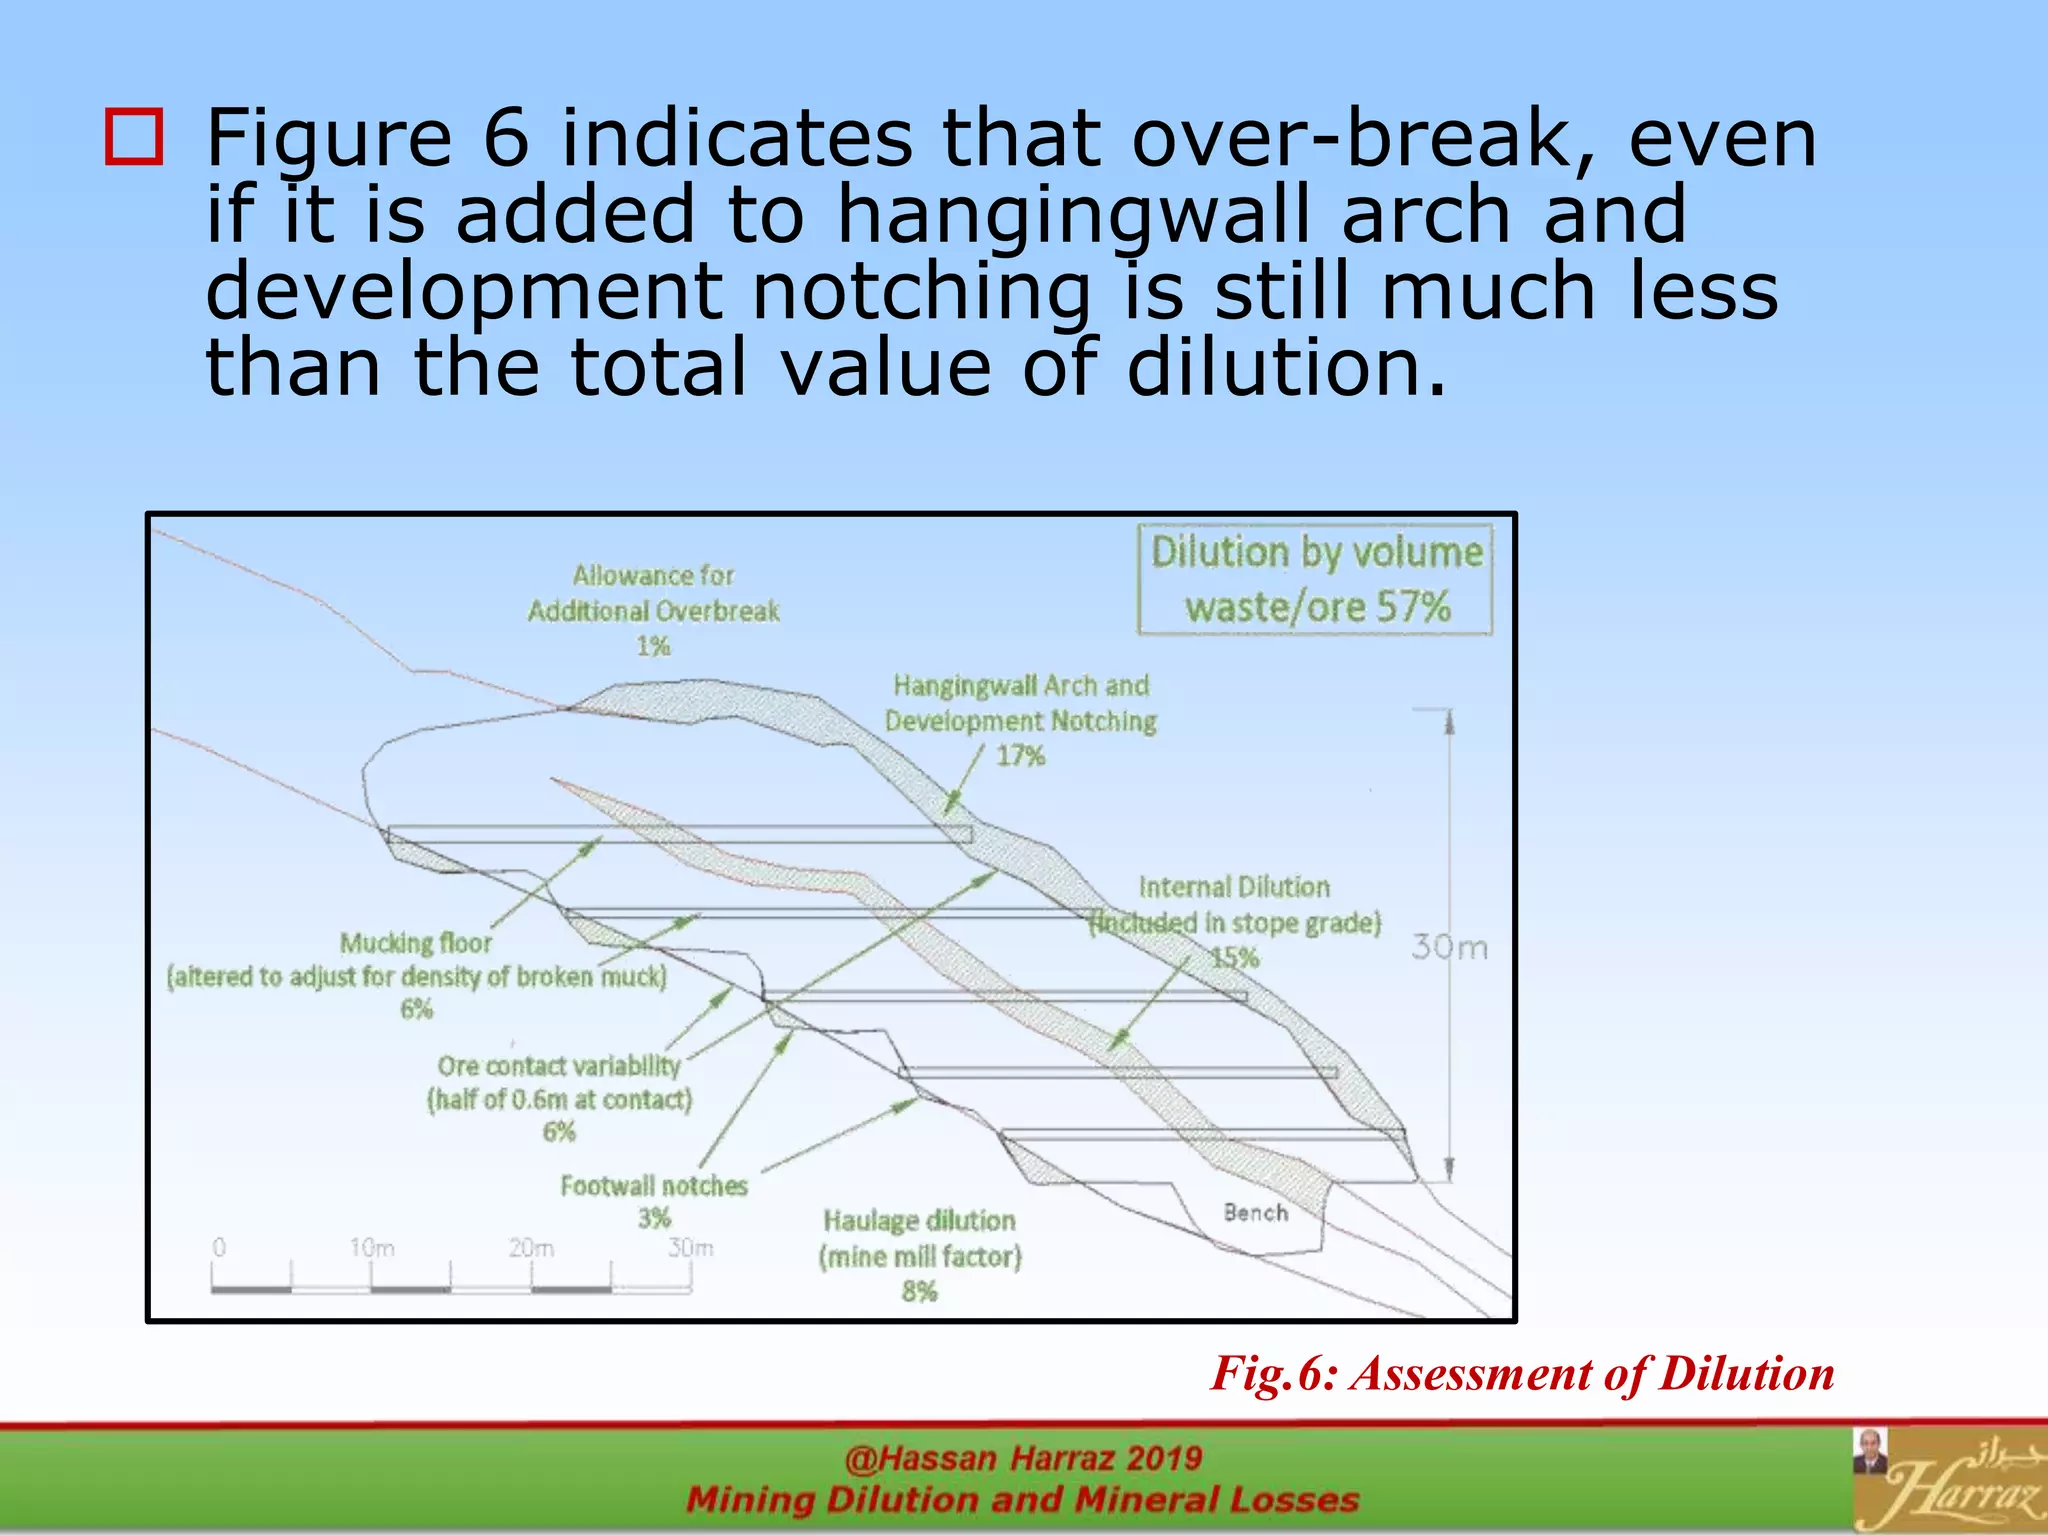
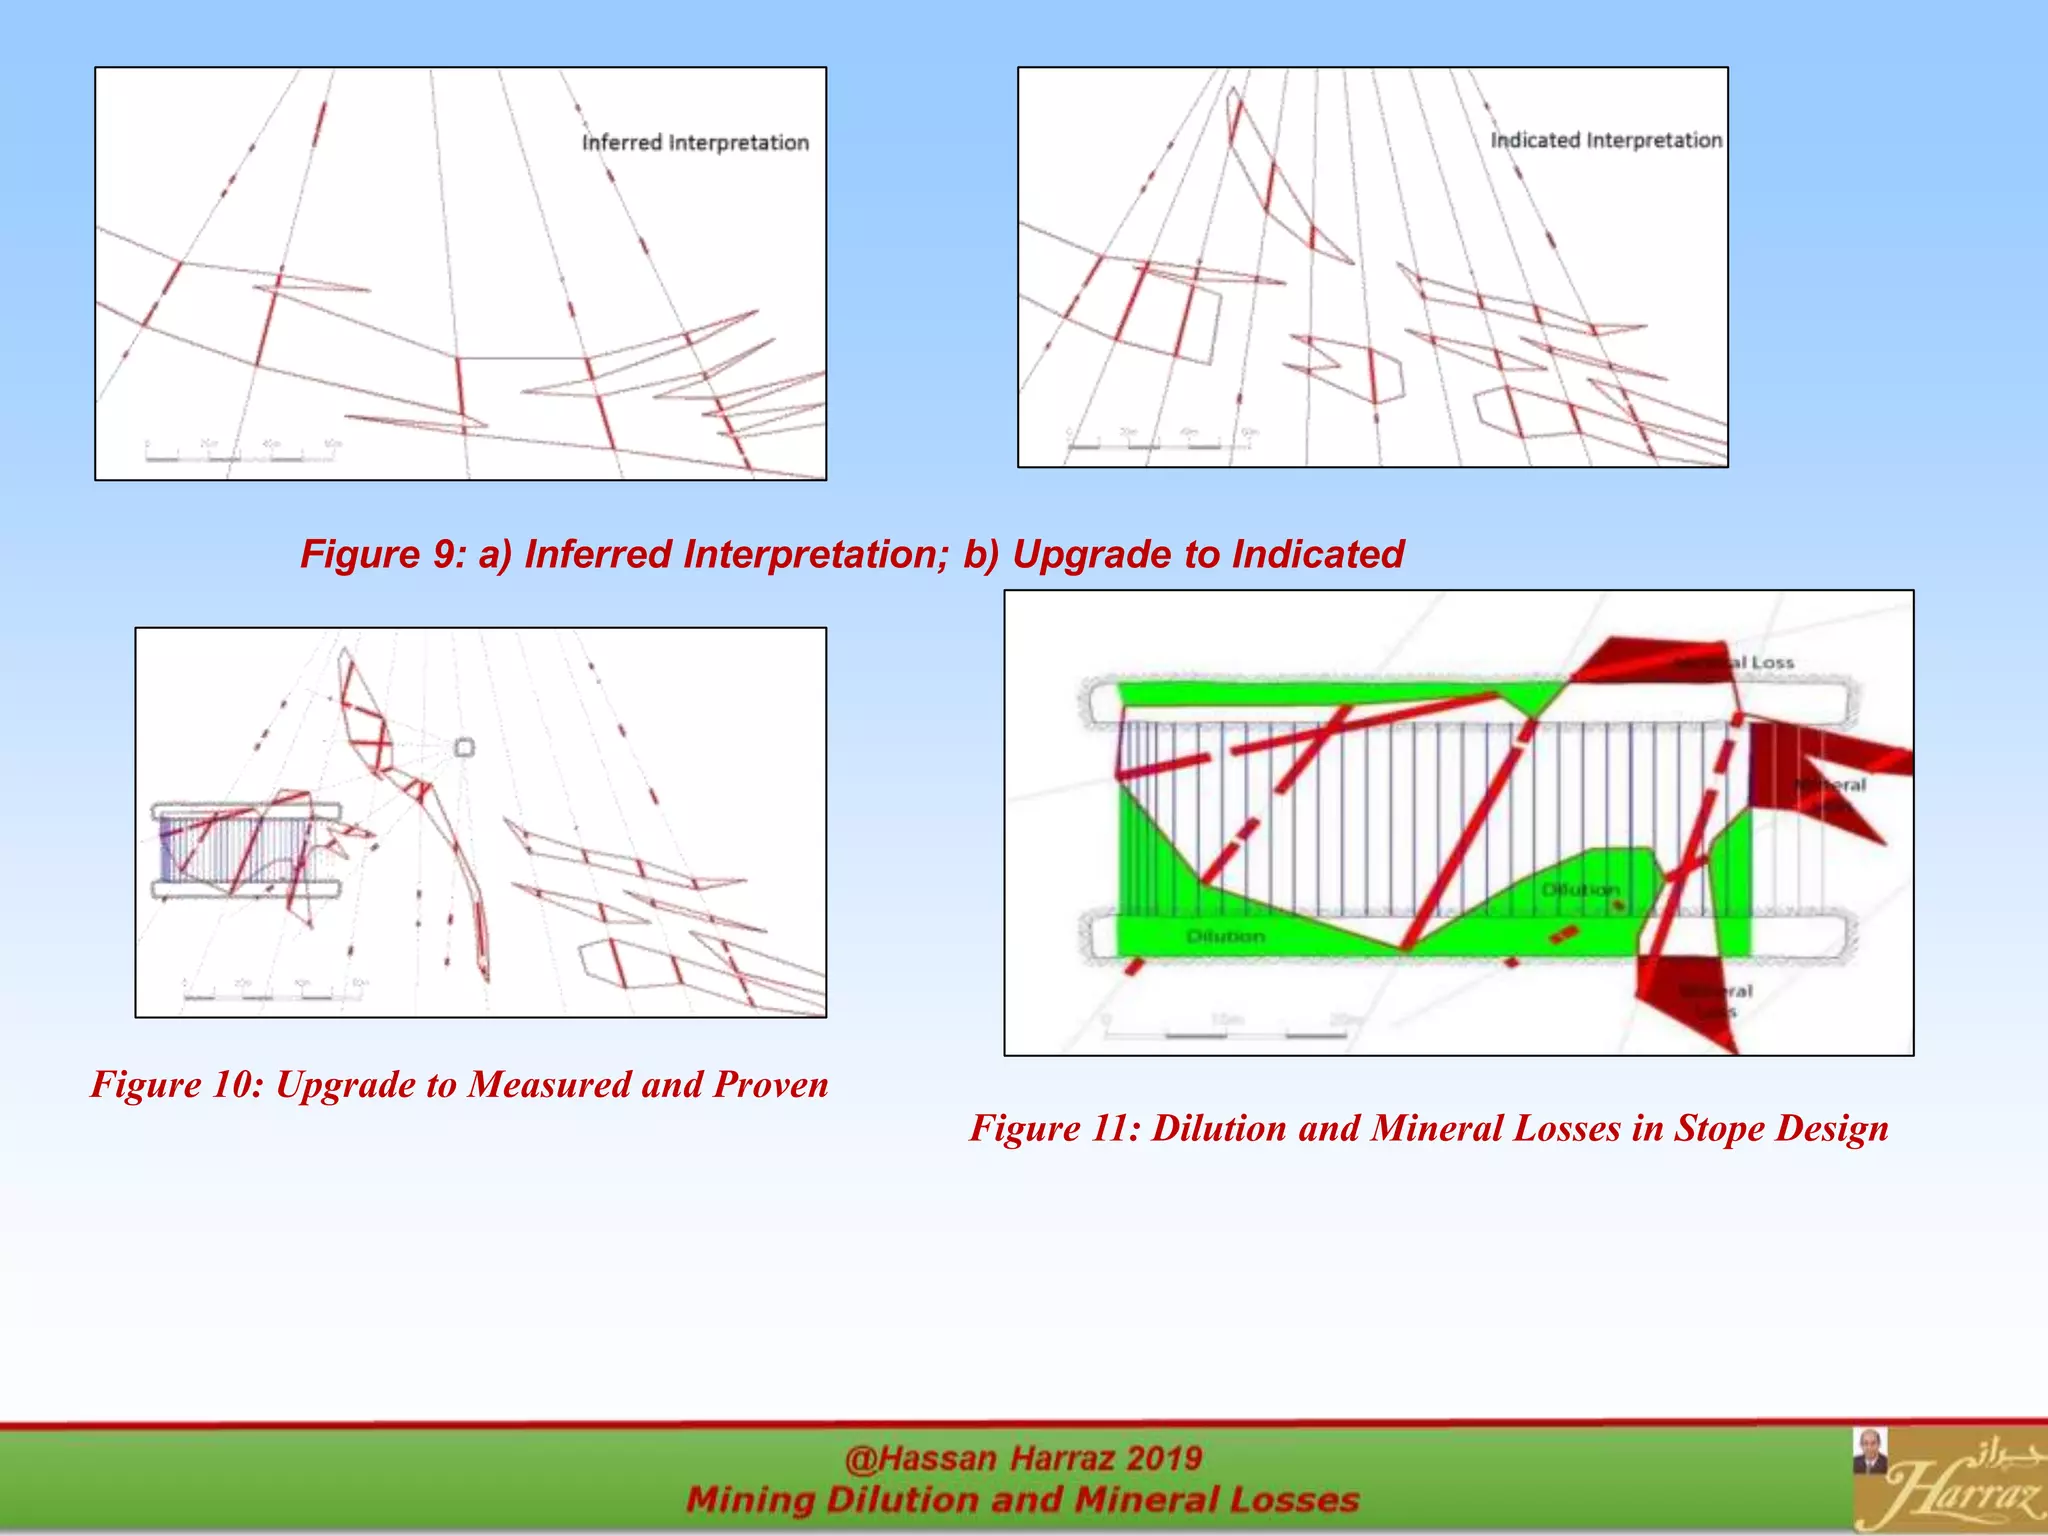
1
Prof. Dr. Hassan Z. Harraz
Geology Department, Faculty of Science, Tanta University
hharraz2006@yahoo.com
Spring 2019
@Hassan Harraz 2019
Mining Dilution and Mineral Losses
1
KEYWORDS
 Ore Dilution, Mining dilution; Mineral
losses, Mining losses, Mine
Evaluation, Mine Economics, Ore
recovery, Mining Recovery,
Underground Mining, Selectivity,
Underground Mining Studies
Outlines
Introduction
Reporting and Representation of Dilution. Examples and Case Histories
Example 1: Relationship Between Over-break and Planned Dilution
Example 2: Dilution Often Included in the Resource Model
Example 3: Manipulation of Density
Example 4: Internal Dilution within the ore Envelope
Example 5: Misleading Reports of Dilution
Example 6: Misleading Reports of Dilution and Tonnes
Sketches for Mineral Loss and Dilution
Reference Texts
Aggregate Factors for Mineral Losses
Quality of Evaluation
More Ore Will be Discovered
Mine Reserve Cut-Off Grade Too Low
High Grading and Fiscal Imprudence
Modeling, Design, Decision and Execution errors
Efforts to Combat Dilution
Resource Upgrade
Ore Contact Variability
Example 1: Ore Contact Variability and Resource Upgrade
Example 2: Ore Contact Variability Narrow Vein Longhole
Example 3: Ore Contact Variability and Planning Sublevel Intervals
Factors Affecting Dilution and Mineral Losses
INTRODUCTION
 Three mining factors; dilution, operating costs and cut-off grade are
used in current discourse as key performance indicators (KPIs) to
compare mining operations and may be used to judge whether or not a
mine is being run efficiently.
 These numbers can directly affect investor confidence, so there is a
strong motive to keep the numbers aligned with what other operations
are reporting and pressure on mine operators to report accordingly.
 If pre- production estimates for operating costs are optimistic, then
cut-off grade will be lower, and the reserve tonnage higher.
 If only over-break is reported, it will be a lesser number than total
dilution and will fall in line with what other mines report.
 The consequence of providing overly optimistic estimates has ripple
effects on government, community and investor relations and on the
credibility of our industry (Whillans 2016).
 Much of the published literature reviewed while preparing this article
dealt almost exclusively with over-break; the Mathews Stability Graph
and Equivalent Linear Over-break Slough (ELOS). These are well
developed useful tools that and have undergone extensive challenges
and verification and are not covered in this article. It is emphasized that
over-break is but a component of dilution and frequently may not be the
major source of total dilution.
 This article is a companion to a separate article titled “Improving
Accuracy of Mining Studies. An Underground Operator´s Perspective”.
REPORTING AND REPRESENTATION OF DILUTION.
EXAMPLES AND CASE HISTORIES
 Each of the following examples have
appeared more than once in our work
with operating mines.
Example 1: Relationship Between Over-break
and Planned Dilution
When stope failures are being experienced repeatedly and
production is delayed by handling of oversize and ore losses
are being experienced, at some point there will be a
temptation on the part of the stope designer to drill beyond
the ore contact into the waste, thereby expanding the stope
design with the intention of reducing oversize and speeding
up the mining cycle.
Figure 1: illustrates that the overall dilution is the same but the
proportion of planned to over-break changes.
Example 2: Dilution Often Included in
the Resource Model
 CIM Best Practice Guidelines include minimum mining width among
the engineering assumptions necessary for a mineral reserve but
these assumptions in practice, are often included within mineral
resources and thus may be not be reported as a source of dilution.
Minimum mining widths may vary between 0.8m for narrow vein
and 6.0m for larger equipment and have a direct impact on the
reporting of over-break (ELOS) as shown in Figure 2. If the
minimum mining width is increased the amount of over-break
reported can be less.
Fig.2: Minimum mining widths and
over-break (ELOS)
Example 3: Manipulation of Density
 A resource geologist working at a base metal mine was accountable for ensuring
the grade predicted by technical services was the grade that was delivered to the
mill, however the engineers at site would not attribute any value higher than
15% to dilution. The geologist responded by applying the same density to waste
and ore in the block model thereby adding dilution at the modelling phase that he
could not convince the mine engineers to add at the design phase.
Example 4: Internal Dilution within the ore Envelope
 A block model should include internal dilution even if the drill hole spacing is
insufficient to get a detailed picture of what that dilution might look like, (as
illustrated in Figure 14 in the section dealing with ore contact variability below).
This internal dilution is often not be reported but can be very useful for
evaluating if a different mining method might be more appropriate.
Example 5: Misleading Reports of Dilution
 Years ago, while employed at an operating mine, we received a series of
questions about mining parameters from the Canadian Institute of Mining. The
question about dilution was the most contentious. At that time at we were
experiencing over-break in the order of 28%. It was quickly decided that a
number as high as that could not be released,
 “we´ll look like we don´t know what we´re doing”. So a much lower number was
sent back to the CIM and our mine fit in nicely with others that were reporting 10
to 15% dilution.
Example 6: Misleading Reports of Dilution
and Tonnes
 We have worked with a number of narrow vein
mines with multiple sources of mill feed where the
grade of chip samples taken perpendicular to the
vein at the stope back were used to calculate mill
feed grade as shown in Figure 3. A dilution factor,
often in the range of 15% was added and the
resulting grade was applied to the volume mined
even when the measured stope width indicated
dilution exceeded 100%. 15% dilution appeared in
the reports and in monthly ore reconciliation
calculations and other sources of mill feed were
penalized to compensate for misreporting.
 Some of the above examples show an effort on the
part of mine operators to appear to be keeping in
line with expectations which may be based on
mining texts or studies with incomplete information.
Unfortunately, mining texts are based on data
provided by operating mines which themselves may
be incomplete as per example 5 above. This
represents a serious difficulty in obtaining reliable
benchmarked numbers that can be used for studies
of mines have not yet started to produce.
Figure 3 Narrow Vein Dilution
SKETCHES FOR MINERAL LOSS AND DILUTION
 The importance of using sketches to investigate all sources of
dilution is emphasized as a best practice because dilution comes
from many sources, all of which need to be checked for their
influence on mill feed grade.
Figure 4: evaluation of mineral losses.
 Figure 4 is an evaluation of mineral losses for a specific mining
condition. The value for mineral loss is higher than can be
found in reference texts, but in fact some of the numbers are
aggressive. The sill pillar is narrow and the unfavourable
geometries around the post pillars would have to be looked at.
The estimate of mineral loss and dilution from the mucking
floor is perhaps the most contentious.
 There is an increasing tendency to use the software solution of
dilution “skins” expanding the ore envelope to calculate the
grade of the dilution as shown in Figure 5. Dilution is not
uniform as Figure 5.might suggest, it has to be understood,
and the best way to achieve this is by providing sketches and
through interaction and discussion. We have also found that the
amount of dilution towers in importance over the grade of the
dilution in almost every project we have worked on, reaffirming
the importance of sketches.
Fig.5: Dilution "Skin"
 Figure 6 indicates that over-break, even
if it is added to hangingwall arch and
development notching is still much less
than the total value of dilution.
Fig.6: Assessment of Dilution
REFERENCE TEXTS
Mining Method
Rock Dilution (%) Ore Losses (%)
Ingler Wright O´Hara BeFo S.A. Ingler Wright BeFo S.A.
Stoping 5-30 5-10 10-30 15.00 32.00 5-15 3-5 16 14
Room and Pillar 0-10 - 10-30 5-12 - 5-30 - 28.00 -
Cut and Fill 5-10 15-30 5-25 12-16 - 5-10 5-7 6-15 -
Shrinkage - 10-15 10-30 - - - 5-7 - -
Sublevel Caving 10-30 10-15 - 25.00 - 10-30 12-15 18 -
Block Caving 10-30 15-20 - - - 0-30 15-20 - -
Table 1: Rock Dilution and Ore Losses
 The numbers we have seen in the previous illustrations are not
the numbers that appear in reference texts as per the example
that follows:
 The average of the numbers in Table 1 indicate values which are much lower than our
experience indicates, and when referring to dilution it is probable that only over-break is
expressed. As mentioned above, over-break can appear lower by increasing planned dilution
or in the case of narrower orebodies, by increasing the minimum mining width. Values for
dilution in Table 1 appear without units, waste/ore (w/o) or waste/ore+waste (w/o+w) or
separation of data based on density. Figure 7 How Dilution is Reported Figure 7 illustrates
how density impacts the reporting of dilution. In tonnage-weighted reporting, the apparent
dilution will be much less for a base metals mine where the density of the ore may be over
80% higher than the surrounding rock, than for a gold mine where the density of ore tends to
match the density of the surrounding rock.
 At higher rates of dilution such as experienced in narrow vein
mines, there can be a big difference in units between reporting
w/o and w/o+w. It is recommended that the industry standard for
underground mining should be volume based, m³waste/m³ore
then it should become easier to compare between mines. ELOS is
volume-based but deals only with over-break.
Figure 7: How Dilution is Reported
AGGREGATE FACTORS FOR MINERAL LOSSES
 In the context of this lecture/document, Mineral Loss includes any
mineral that is part of a mineral resource or reserve, that is above
cut-off grade and that for any reason is not mined.
 It is used in preference to “Mining Loss” because it is inclusive of
losses experienced through upgrading the resource through
inferred to indicated to measured and might include
metallurgical loss.
 Many mining studies will simply peg mining loss between 5% and
15% whereas in our experience, if all factors are considered, the
losses will often be much greater and will affect shorter term
economics by having to increase ramp and access development by
as much as 30% (in some cases, more) to compensate for ore
losses.
 The following aggregate factors when combined, indicate higher
values for mineral losses than often appear in mining studies:
i) Quality of Evaluation
ii) More Ore Will be Discovered
iii) Mine Reserve Cut-Off Grade Too Low
iv) High Grading and Fiscal Imprudence
v) Modeling, Design, Decision and Execution errors
vi) Efforts to Combat Dilution
vii) Resource Upgrade
i) Quality of Evaluation:
Contemporary perception among some in our industry is that mineral losses are not that important and
have only minimal impact on project net present value (NPV). This is only true if mineral losses are very
low. We have not yet worked at a mine where mineral losses were as low as 10%.
ii) More Ore Will be Discovered:
Years ago, while employed at an operating mine, I was fretting over not recovering some of the ore in a
corner of the stope. It was explained to me that “we actually don´t worry too much about mineral losses,
the geologists will find more ore to replace whatever we don´t mine.” In fact, there is a significant cost
and significant inherent risk in finding more ore.
iii) Mine Reserve Cut-Off Grade Too Low:
As mentioned above, the cut-off grade which is used to calculate mineral reserves has an impact on
shareholder confidence, so there is a motive to show a greater tonnage of reserve and hint that it can be
mined at a lower cost. Underground mines may carry a cut-off grade for reserves that is lower than what
can actually be mined at break even. Over time, as the better grade stopes are mined out, the marginal
grade remains and many years may pass by before the cut-off grade is finally adjusted and the lower
grade material removed from reserves resulting in a shortening of mine life.
iv) High Grading and Fiscal Imprudence:
High grading used to be considered a serious offence 30 years ago and people used to lose their jobs
because of it. Now we all do it! It helps the Net Present Value (NPV) of the project.
The problem is actually not with high-grading but with fiscal imprudence. Are the profits from high
grading fully reinvested in the mine or are they spent on something else? Fiscal imprudence is part of
how countries, provinces, municipalities and we, as individuals function. Mining companies can do it as
well.
v) Modeling, Design, Decision and Execution errors:
Human errors occur at every stage of a mining operation and include errors in geological modelling and
stope design as well as errors in decision making at every level and errors of execution of the work
underground. When mines are under pressure to produce as a result of an overly optimistic mine plan
errors combine and aggregate.
Conditions like those shown in Figure 8 may not appear in reports but impact mine life and by doing so,
increase the relative cost of mine development. Secondary 2 on the right side of Figure 8 was a pillar
between two primaries. The sterilized mineral amounted to some 100,000 tonnes.
Figure 8: Examples of Low Reported Dilution but Significant Mineral Losses
vi) Efforts to Combat Dilution:
Attempts to reduce dilution may have a direct impact on mineral losses. This is especially the case with narrow vein orebodies when we
attempt to reduce the width that is mined but in fact may end up losing ore as illustrated in Figure 19 in the section dealing with ore
contact variability that follows.
When mining on top of waste fill or backfill, there will be mixing of ore and waste on the mucking floor. Mucking less and leaving ore on
the floor mixed with waste will reduce dilution but impact mineral losses.
vii) Resource Upgrade:
Inferred resources may be included in a Preliminary Economic Assessment (PEA) but when inferred resources are upgraded to indicated
and measured there is commonly a loss of resource tonnage brought about by better defining the mineralized zone as illustrated in the
following section dealing with ore contact variability. The loss of resource tonnage through upgrade will vary according to local conditions
and may fall between 30% and may be as high as 70%. If it is known there is a likelihood there could be a tonnage drop associated with
the resource upgrade, then it should be considered in the PEA. In fact the statement that “there is no guarantee that a mineral resource will
become a mineral reserve” is misleading because it leaves out information important enough to invalidate the accuracy of some PEAs. In
a similar way, mineral losses associated with upgrading from indicated to measured should also be considered for higher level studies.
ORE CONTACT VARIABILITY
 Ore contact variability is hardly
mentioned in literature and deserves
close attention. Examples follow.
Example 1: Ore Contact Variability and
Resource Upgrade
 Figure 9 and Figure 10 show what can
happen when an inferred resource is
upgraded through additional drilling and
development. These diagrams illustrate
the effect on resource tonnes and
increasing complexity of the ore outline
as more is known about the orebody. This
impacts both mineral loss and dilution.
Figure 9: a) Inferred Interpretation; b) Upgrade to Indicated
Figure 10: Upgrade to Measured and Proven
Figure 11: Dilution and Mineral Losses in Stope Design
 Figure 11 shows internal dilution and
mineral losses as part of the stope
design.
 The above diagrams indicate that the
complexity of the ore contact outline
increases as more information is gained
about the mineralized zone. There is a
point to which it is practical to collect
ever more detailed information. So the
ore contact that might be visible during
stope development may hint at greater
complexities as shown in Figure 12 and
Figure 13 below.
Figure 12: Ore visible in the development
headings may hint at more complexities
Instead, it is assumed that the dilution within the ore outline as modelled should be
represented in the block modeling. The dilution included within the block model
should be reported as it may point to a need to alter mining method or designs for some
areas.
Figure 13: Stope design showing hypothetical
ore outline
Example 2: Ore Contact Variability
Narrow Vein Longhole
 Figure 14 shows detailed information used to
determine stope boundaries for narrow vein
longhole mining that resulted in the selection of a
mining outline top and bottom and a wireframe
created between the sublevels.
 Figure 15 shows the wireframe and with some
chagrin I have to say this is my work from years
ago and that there was absolutely no consideration
for ore contact variability in the vertical sense.
When stope production started at this mine,
geologists were initially polite and respectful in
asking if we could recover the ore in the open stope
left on the hangingwall or footwall. Over time they
became much more assertive.
Figure 14: Determination of Mining Outline
Figure 15: Resulting Wireframe
Example 3: Ore Contact Variability and
Planning Sublevel Intervals
Figure 16 is an example from an operating mine and further
illustrates the importance of considering ore contact
variability. It shows wireframing between sublevels based on
the back mapping. (We like straight lines in mining)
Drift mapping of the ore will show ore contact variability in
the horizontal sense as shown in Figure 17
If this mapping information is applied to sections as shown in
Figure 18 it will provide an indication of ore continuity in the
vertical sense and can be used to set a practical sublevel
interval.
Figure 18 illustrates that dilution might be a way of ensuring
that the ore is mined, especially for the vein on the left side
of the image, but if overbreak happens on the hangingwall
and not the footwall, ore loss is significant. There are a
number of narrow vein mines that could have improved
conventional selective mining techniques but instead switched
to longhole mining in the past 10 years in conditions similar
and with greater or contact variability than shown in Figure
18.
Figure 16: Interpolation between Sublevels Figure 17. Mapping of ore outlines
Figure 18: What the ore might look like
CONCLUSIONS
 For the underground operator, dilution is often
synonymous with over-break, which mining
operations struggle to control. However, there are
many additional factors impacting dilution which may
surpass the importance of overbreak, and these also
need to be considered when assessing a project.
Among these, ore contour variability is an important
component of both dilution and mineral losses which
is often overlooked.
 Mineral losses are often considered to be less
important because it is considered that they will only
have a small impact on net present value. This is not
necessarily the case and in fact mineral losses may be
much higher than indicated in mining studies due to
aggregate factors and may have an important impact
on shorter term economics.
REFERENCES
 Whillans, P.T. (2018). Mining Dilution and
Mineral Losses, An Underground Operator´s
Perspective. As presented at the following
conferences: 2018-06 Mining Tech Santiago
Chile; Revised 2018-07-29
 Whillans, P.T. (2016). Underground Mining. The
Difference between Optimal and Real CIM MEMO
Sudbury 2016-10.
 Elbrond, J. (1994). Economic effects of ore
losses and rock dilution CIM 1994-03-01.
 Prinsloo, P Bulyanhulu 2001.
Follow me on Social Media
http://facebook.com/hzharraz
http://www.slideshare.net/hzharraz
https://www.linkedin.com/in/hassan-harraz-3172b235

mining dilution and mineral losses

  • 1.
    1 Prof. Dr. HassanZ. Harraz Geology Department, Faculty of Science, Tanta University hharraz2006@yahoo.com Spring 2019 @Hassan Harraz 2019 Mining Dilution and Mineral Losses 1
  • 2.
    KEYWORDS  Ore Dilution,Mining dilution; Mineral losses, Mining losses, Mine Evaluation, Mine Economics, Ore recovery, Mining Recovery, Underground Mining, Selectivity, Underground Mining Studies
  • 3.
    Outlines Introduction Reporting and Representationof Dilution. Examples and Case Histories Example 1: Relationship Between Over-break and Planned Dilution Example 2: Dilution Often Included in the Resource Model Example 3: Manipulation of Density Example 4: Internal Dilution within the ore Envelope Example 5: Misleading Reports of Dilution Example 6: Misleading Reports of Dilution and Tonnes Sketches for Mineral Loss and Dilution Reference Texts Aggregate Factors for Mineral Losses Quality of Evaluation More Ore Will be Discovered Mine Reserve Cut-Off Grade Too Low High Grading and Fiscal Imprudence Modeling, Design, Decision and Execution errors Efforts to Combat Dilution Resource Upgrade Ore Contact Variability Example 1: Ore Contact Variability and Resource Upgrade Example 2: Ore Contact Variability Narrow Vein Longhole Example 3: Ore Contact Variability and Planning Sublevel Intervals Factors Affecting Dilution and Mineral Losses
  • 4.
    INTRODUCTION  Three miningfactors; dilution, operating costs and cut-off grade are used in current discourse as key performance indicators (KPIs) to compare mining operations and may be used to judge whether or not a mine is being run efficiently.  These numbers can directly affect investor confidence, so there is a strong motive to keep the numbers aligned with what other operations are reporting and pressure on mine operators to report accordingly.  If pre- production estimates for operating costs are optimistic, then cut-off grade will be lower, and the reserve tonnage higher.  If only over-break is reported, it will be a lesser number than total dilution and will fall in line with what other mines report.  The consequence of providing overly optimistic estimates has ripple effects on government, community and investor relations and on the credibility of our industry (Whillans 2016).  Much of the published literature reviewed while preparing this article dealt almost exclusively with over-break; the Mathews Stability Graph and Equivalent Linear Over-break Slough (ELOS). These are well developed useful tools that and have undergone extensive challenges and verification and are not covered in this article. It is emphasized that over-break is but a component of dilution and frequently may not be the major source of total dilution.  This article is a companion to a separate article titled “Improving Accuracy of Mining Studies. An Underground Operator´s Perspective”.
  • 5.
    REPORTING AND REPRESENTATIONOF DILUTION. EXAMPLES AND CASE HISTORIES  Each of the following examples have appeared more than once in our work with operating mines.
  • 6.
    Example 1: RelationshipBetween Over-break and Planned Dilution When stope failures are being experienced repeatedly and production is delayed by handling of oversize and ore losses are being experienced, at some point there will be a temptation on the part of the stope designer to drill beyond the ore contact into the waste, thereby expanding the stope design with the intention of reducing oversize and speeding up the mining cycle. Figure 1: illustrates that the overall dilution is the same but the proportion of planned to over-break changes.
  • 7.
    Example 2: DilutionOften Included in the Resource Model  CIM Best Practice Guidelines include minimum mining width among the engineering assumptions necessary for a mineral reserve but these assumptions in practice, are often included within mineral resources and thus may be not be reported as a source of dilution. Minimum mining widths may vary between 0.8m for narrow vein and 6.0m for larger equipment and have a direct impact on the reporting of over-break (ELOS) as shown in Figure 2. If the minimum mining width is increased the amount of over-break reported can be less. Fig.2: Minimum mining widths and over-break (ELOS)
  • 8.
    Example 3: Manipulationof Density  A resource geologist working at a base metal mine was accountable for ensuring the grade predicted by technical services was the grade that was delivered to the mill, however the engineers at site would not attribute any value higher than 15% to dilution. The geologist responded by applying the same density to waste and ore in the block model thereby adding dilution at the modelling phase that he could not convince the mine engineers to add at the design phase. Example 4: Internal Dilution within the ore Envelope  A block model should include internal dilution even if the drill hole spacing is insufficient to get a detailed picture of what that dilution might look like, (as illustrated in Figure 14 in the section dealing with ore contact variability below). This internal dilution is often not be reported but can be very useful for evaluating if a different mining method might be more appropriate. Example 5: Misleading Reports of Dilution  Years ago, while employed at an operating mine, we received a series of questions about mining parameters from the Canadian Institute of Mining. The question about dilution was the most contentious. At that time at we were experiencing over-break in the order of 28%. It was quickly decided that a number as high as that could not be released,  “we´ll look like we don´t know what we´re doing”. So a much lower number was sent back to the CIM and our mine fit in nicely with others that were reporting 10 to 15% dilution.
  • 9.
    Example 6: MisleadingReports of Dilution and Tonnes  We have worked with a number of narrow vein mines with multiple sources of mill feed where the grade of chip samples taken perpendicular to the vein at the stope back were used to calculate mill feed grade as shown in Figure 3. A dilution factor, often in the range of 15% was added and the resulting grade was applied to the volume mined even when the measured stope width indicated dilution exceeded 100%. 15% dilution appeared in the reports and in monthly ore reconciliation calculations and other sources of mill feed were penalized to compensate for misreporting.  Some of the above examples show an effort on the part of mine operators to appear to be keeping in line with expectations which may be based on mining texts or studies with incomplete information. Unfortunately, mining texts are based on data provided by operating mines which themselves may be incomplete as per example 5 above. This represents a serious difficulty in obtaining reliable benchmarked numbers that can be used for studies of mines have not yet started to produce. Figure 3 Narrow Vein Dilution
  • 10.
    SKETCHES FOR MINERALLOSS AND DILUTION  The importance of using sketches to investigate all sources of dilution is emphasized as a best practice because dilution comes from many sources, all of which need to be checked for their influence on mill feed grade. Figure 4: evaluation of mineral losses.
  • 11.
     Figure 4is an evaluation of mineral losses for a specific mining condition. The value for mineral loss is higher than can be found in reference texts, but in fact some of the numbers are aggressive. The sill pillar is narrow and the unfavourable geometries around the post pillars would have to be looked at. The estimate of mineral loss and dilution from the mucking floor is perhaps the most contentious.  There is an increasing tendency to use the software solution of dilution “skins” expanding the ore envelope to calculate the grade of the dilution as shown in Figure 5. Dilution is not uniform as Figure 5.might suggest, it has to be understood, and the best way to achieve this is by providing sketches and through interaction and discussion. We have also found that the amount of dilution towers in importance over the grade of the dilution in almost every project we have worked on, reaffirming the importance of sketches. Fig.5: Dilution "Skin"
  • 12.
     Figure 6indicates that over-break, even if it is added to hangingwall arch and development notching is still much less than the total value of dilution. Fig.6: Assessment of Dilution
  • 13.
    REFERENCE TEXTS Mining Method RockDilution (%) Ore Losses (%) Ingler Wright O´Hara BeFo S.A. Ingler Wright BeFo S.A. Stoping 5-30 5-10 10-30 15.00 32.00 5-15 3-5 16 14 Room and Pillar 0-10 - 10-30 5-12 - 5-30 - 28.00 - Cut and Fill 5-10 15-30 5-25 12-16 - 5-10 5-7 6-15 - Shrinkage - 10-15 10-30 - - - 5-7 - - Sublevel Caving 10-30 10-15 - 25.00 - 10-30 12-15 18 - Block Caving 10-30 15-20 - - - 0-30 15-20 - - Table 1: Rock Dilution and Ore Losses  The numbers we have seen in the previous illustrations are not the numbers that appear in reference texts as per the example that follows:  The average of the numbers in Table 1 indicate values which are much lower than our experience indicates, and when referring to dilution it is probable that only over-break is expressed. As mentioned above, over-break can appear lower by increasing planned dilution or in the case of narrower orebodies, by increasing the minimum mining width. Values for dilution in Table 1 appear without units, waste/ore (w/o) or waste/ore+waste (w/o+w) or separation of data based on density. Figure 7 How Dilution is Reported Figure 7 illustrates how density impacts the reporting of dilution. In tonnage-weighted reporting, the apparent dilution will be much less for a base metals mine where the density of the ore may be over 80% higher than the surrounding rock, than for a gold mine where the density of ore tends to match the density of the surrounding rock.
  • 14.
     At higherrates of dilution such as experienced in narrow vein mines, there can be a big difference in units between reporting w/o and w/o+w. It is recommended that the industry standard for underground mining should be volume based, m³waste/m³ore then it should become easier to compare between mines. ELOS is volume-based but deals only with over-break. Figure 7: How Dilution is Reported
  • 15.
    AGGREGATE FACTORS FORMINERAL LOSSES  In the context of this lecture/document, Mineral Loss includes any mineral that is part of a mineral resource or reserve, that is above cut-off grade and that for any reason is not mined.  It is used in preference to “Mining Loss” because it is inclusive of losses experienced through upgrading the resource through inferred to indicated to measured and might include metallurgical loss.  Many mining studies will simply peg mining loss between 5% and 15% whereas in our experience, if all factors are considered, the losses will often be much greater and will affect shorter term economics by having to increase ramp and access development by as much as 30% (in some cases, more) to compensate for ore losses.  The following aggregate factors when combined, indicate higher values for mineral losses than often appear in mining studies: i) Quality of Evaluation ii) More Ore Will be Discovered iii) Mine Reserve Cut-Off Grade Too Low iv) High Grading and Fiscal Imprudence v) Modeling, Design, Decision and Execution errors vi) Efforts to Combat Dilution vii) Resource Upgrade
  • 16.
    i) Quality ofEvaluation: Contemporary perception among some in our industry is that mineral losses are not that important and have only minimal impact on project net present value (NPV). This is only true if mineral losses are very low. We have not yet worked at a mine where mineral losses were as low as 10%. ii) More Ore Will be Discovered: Years ago, while employed at an operating mine, I was fretting over not recovering some of the ore in a corner of the stope. It was explained to me that “we actually don´t worry too much about mineral losses, the geologists will find more ore to replace whatever we don´t mine.” In fact, there is a significant cost and significant inherent risk in finding more ore. iii) Mine Reserve Cut-Off Grade Too Low: As mentioned above, the cut-off grade which is used to calculate mineral reserves has an impact on shareholder confidence, so there is a motive to show a greater tonnage of reserve and hint that it can be mined at a lower cost. Underground mines may carry a cut-off grade for reserves that is lower than what can actually be mined at break even. Over time, as the better grade stopes are mined out, the marginal grade remains and many years may pass by before the cut-off grade is finally adjusted and the lower grade material removed from reserves resulting in a shortening of mine life. iv) High Grading and Fiscal Imprudence: High grading used to be considered a serious offence 30 years ago and people used to lose their jobs because of it. Now we all do it! It helps the Net Present Value (NPV) of the project. The problem is actually not with high-grading but with fiscal imprudence. Are the profits from high grading fully reinvested in the mine or are they spent on something else? Fiscal imprudence is part of how countries, provinces, municipalities and we, as individuals function. Mining companies can do it as well. v) Modeling, Design, Decision and Execution errors: Human errors occur at every stage of a mining operation and include errors in geological modelling and stope design as well as errors in decision making at every level and errors of execution of the work underground. When mines are under pressure to produce as a result of an overly optimistic mine plan errors combine and aggregate. Conditions like those shown in Figure 8 may not appear in reports but impact mine life and by doing so, increase the relative cost of mine development. Secondary 2 on the right side of Figure 8 was a pillar between two primaries. The sterilized mineral amounted to some 100,000 tonnes.
  • 17.
    Figure 8: Examplesof Low Reported Dilution but Significant Mineral Losses vi) Efforts to Combat Dilution: Attempts to reduce dilution may have a direct impact on mineral losses. This is especially the case with narrow vein orebodies when we attempt to reduce the width that is mined but in fact may end up losing ore as illustrated in Figure 19 in the section dealing with ore contact variability that follows. When mining on top of waste fill or backfill, there will be mixing of ore and waste on the mucking floor. Mucking less and leaving ore on the floor mixed with waste will reduce dilution but impact mineral losses. vii) Resource Upgrade: Inferred resources may be included in a Preliminary Economic Assessment (PEA) but when inferred resources are upgraded to indicated and measured there is commonly a loss of resource tonnage brought about by better defining the mineralized zone as illustrated in the following section dealing with ore contact variability. The loss of resource tonnage through upgrade will vary according to local conditions and may fall between 30% and may be as high as 70%. If it is known there is a likelihood there could be a tonnage drop associated with the resource upgrade, then it should be considered in the PEA. In fact the statement that “there is no guarantee that a mineral resource will become a mineral reserve” is misleading because it leaves out information important enough to invalidate the accuracy of some PEAs. In a similar way, mineral losses associated with upgrading from indicated to measured should also be considered for higher level studies.
  • 18.
    ORE CONTACT VARIABILITY Ore contact variability is hardly mentioned in literature and deserves close attention. Examples follow. Example 1: Ore Contact Variability and Resource Upgrade  Figure 9 and Figure 10 show what can happen when an inferred resource is upgraded through additional drilling and development. These diagrams illustrate the effect on resource tonnes and increasing complexity of the ore outline as more is known about the orebody. This impacts both mineral loss and dilution.
  • 19.
    Figure 9: a)Inferred Interpretation; b) Upgrade to Indicated Figure 10: Upgrade to Measured and Proven Figure 11: Dilution and Mineral Losses in Stope Design
  • 20.
     Figure 11shows internal dilution and mineral losses as part of the stope design.  The above diagrams indicate that the complexity of the ore contact outline increases as more information is gained about the mineralized zone. There is a point to which it is practical to collect ever more detailed information. So the ore contact that might be visible during stope development may hint at greater complexities as shown in Figure 12 and Figure 13 below.
  • 21.
    Figure 12: Orevisible in the development headings may hint at more complexities Instead, it is assumed that the dilution within the ore outline as modelled should be represented in the block modeling. The dilution included within the block model should be reported as it may point to a need to alter mining method or designs for some areas. Figure 13: Stope design showing hypothetical ore outline
  • 22.
    Example 2: OreContact Variability Narrow Vein Longhole  Figure 14 shows detailed information used to determine stope boundaries for narrow vein longhole mining that resulted in the selection of a mining outline top and bottom and a wireframe created between the sublevels.  Figure 15 shows the wireframe and with some chagrin I have to say this is my work from years ago and that there was absolutely no consideration for ore contact variability in the vertical sense. When stope production started at this mine, geologists were initially polite and respectful in asking if we could recover the ore in the open stope left on the hangingwall or footwall. Over time they became much more assertive.
  • 23.
    Figure 14: Determinationof Mining Outline Figure 15: Resulting Wireframe
  • 24.
    Example 3: OreContact Variability and Planning Sublevel Intervals Figure 16 is an example from an operating mine and further illustrates the importance of considering ore contact variability. It shows wireframing between sublevels based on the back mapping. (We like straight lines in mining) Drift mapping of the ore will show ore contact variability in the horizontal sense as shown in Figure 17 If this mapping information is applied to sections as shown in Figure 18 it will provide an indication of ore continuity in the vertical sense and can be used to set a practical sublevel interval. Figure 18 illustrates that dilution might be a way of ensuring that the ore is mined, especially for the vein on the left side of the image, but if overbreak happens on the hangingwall and not the footwall, ore loss is significant. There are a number of narrow vein mines that could have improved conventional selective mining techniques but instead switched to longhole mining in the past 10 years in conditions similar and with greater or contact variability than shown in Figure 18.
  • 25.
    Figure 16: Interpolationbetween Sublevels Figure 17. Mapping of ore outlines Figure 18: What the ore might look like
  • 26.
    CONCLUSIONS  For theunderground operator, dilution is often synonymous with over-break, which mining operations struggle to control. However, there are many additional factors impacting dilution which may surpass the importance of overbreak, and these also need to be considered when assessing a project. Among these, ore contour variability is an important component of both dilution and mineral losses which is often overlooked.  Mineral losses are often considered to be less important because it is considered that they will only have a small impact on net present value. This is not necessarily the case and in fact mineral losses may be much higher than indicated in mining studies due to aggregate factors and may have an important impact on shorter term economics.
  • 27.
    REFERENCES  Whillans, P.T.(2018). Mining Dilution and Mineral Losses, An Underground Operator´s Perspective. As presented at the following conferences: 2018-06 Mining Tech Santiago Chile; Revised 2018-07-29  Whillans, P.T. (2016). Underground Mining. The Difference between Optimal and Real CIM MEMO Sudbury 2016-10.  Elbrond, J. (1994). Economic effects of ore losses and rock dilution CIM 1994-03-01.  Prinsloo, P Bulyanhulu 2001.
  • 28.
    Follow me onSocial Media http://facebook.com/hzharraz http://www.slideshare.net/hzharraz https://www.linkedin.com/in/hassan-harraz-3172b235