Download to read offline

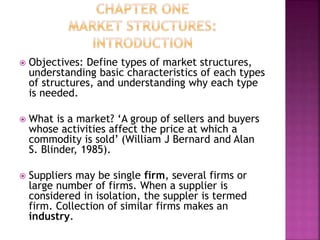
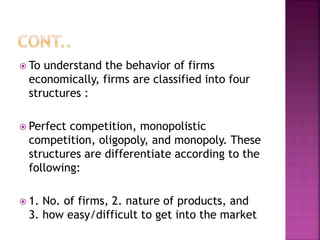
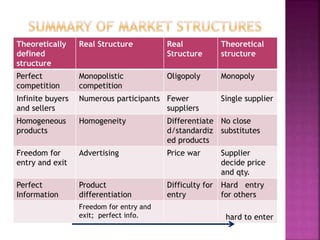
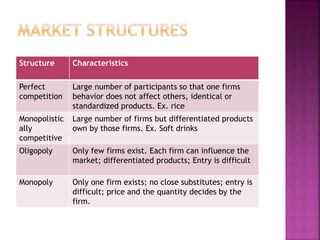


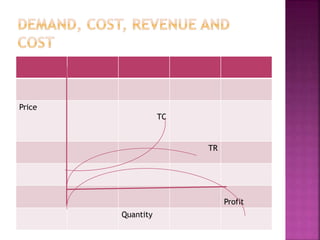


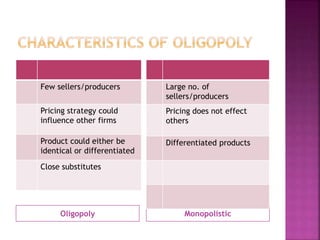
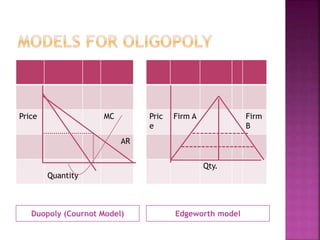


This document defines different market structures and their key characteristics. It discusses perfect competition, monopolistic competition, oligopoly, and monopoly. For each structure, it provides the number of firms, product types, barriers to entry, real world examples, and how demand and supply behave. The objectives are to understand how these structures differ and why they exist. Market structures help firms determine pricing strategies and output levels to maximize profits.


