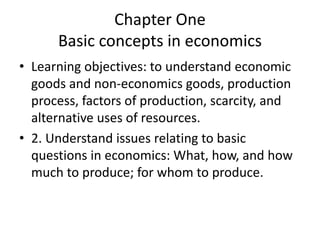
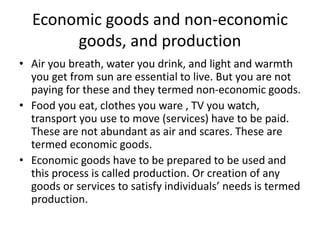
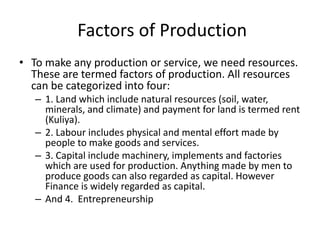
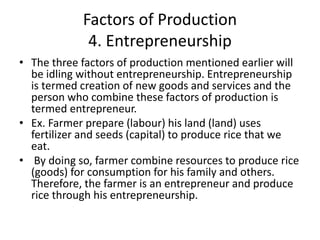
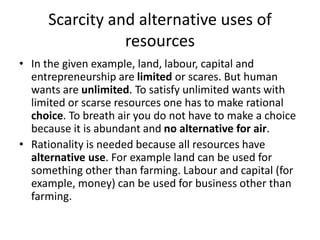
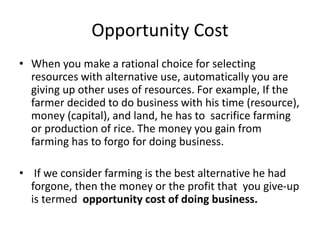
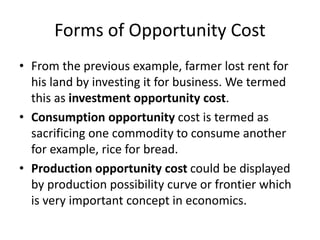
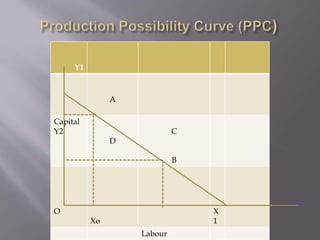
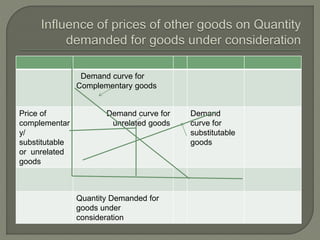
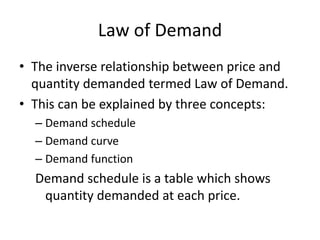
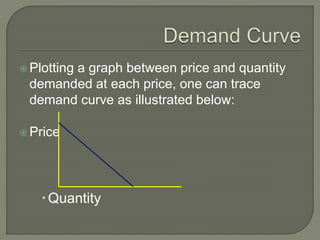
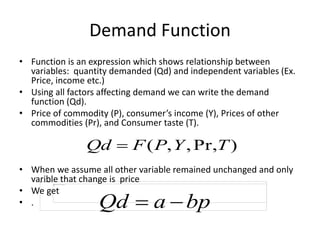
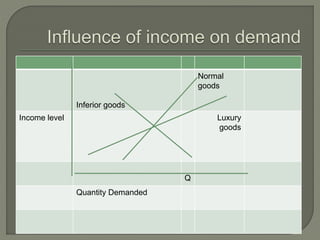
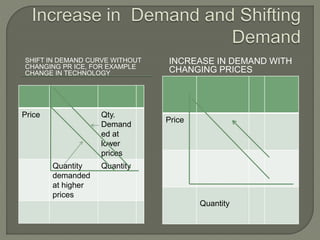
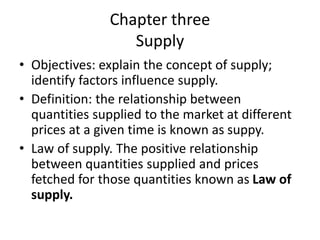
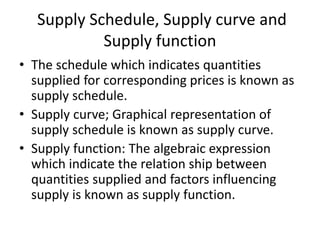
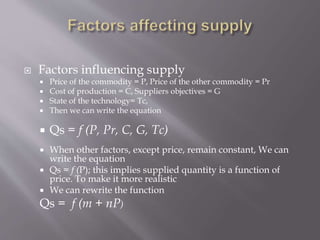
2. Chapter One
Basic concepts in economics
• Learning objectives: to understand economic
goods and non-economics goods, production
process, factors of production, scarcity, and
alternative uses of resources.
• 2. Understand issues relating to basic
questions in economics: What, how, and how
much to produce; for whom to produce.
3. Economic goods and non-economic
goods, and production
• Air you breath, water you drink, and light and warmth
you get from sun are essential to live. But you are not
paying for these and they termed non-economic goods.
• Food you eat, clothes you ware , TV you watch,
transport you use to move (services) have to be paid.
These are not abundant as air and scares. These are
termed economic goods.
• Economic goods have to be prepared to be used and
this process is called production. Or creation of any
goods or services to satisfy individuals’ needs is termed
production.
4. Factors of Production
• To make any production or service, we need resources.
These are termed factors of production. All resources
can be categorized into four:
– 1. Land which include natural resources (soil, water,
minerals, and climate) and payment for land is termed rent
(Kuliya).
– 2. Labour includes physical and mental effort made by
people to make goods and services.
– 3. Capital include machinery, implements and factories
which are used for production. Anything made by men to
produce goods can also regarded as capital. However
Finance is widely regarded as capital.
– And 4. Entrepreneurship
5. Factors of Production
4. Entrepreneurship
• The three factors of production mentioned earlier will
be idling without entrepreneurship. Entrepreneurship
is termed creation of new goods and services and the
person who combine these factors of production is
termed entrepreneur.
• Ex. Farmer prepare (labour) his land (land) uses
fertilizer and seeds (capital) to produce rice that we
eat.
• By doing so, farmer combine resources to produce rice
(goods) for consumption for his family and others.
Therefore, the farmer is an entrepreneur and produce
rice through his entrepreneurship.
6. Scarcity and alternative uses of
resources
• In the given example, land, labour, capital and
entrepreneurship are limited or scares. But human
wants are unlimited. To satisfy unlimited wants with
limited or scarse resources one has to make rational
choice. To breath air you do not have to make a choice
because it is abundant and no alternative for air.
• Rationality is needed because all resources have
alternative use. For example land can be used for
something other than farming. Labour and capital (for
example, money) can be used for business other than
farming.
7. Opportunity Cost
• When you make a rational choice for selecting
resources with alternative use, automatically you are
giving up other uses of resources. For example, If the
farmer decided to do business with his time (resource),
money (capital), and land, he has to sacrifice farming
or production of rice. The money you gain from
farming has to forgo for doing business.
• If we consider farming is the best alternative he had
forgone, then the money or the profit that you give-up
is termed opportunity cost of doing business.
8. Forms of Opportunity Cost
• From the previous example, farmer lost rent for
his land by investing it for business. We termed
this as investment opportunity cost.
• Consumption opportunity cost is termed as
sacrificing one commodity to consume another
for example, rice for bread.
• Production opportunity cost could be displayed
by production possibility curve or frontier which
is very important concept in economics.
10. Explanation for PPC
• In the given diagram, consider a country is using all the
resources to produce capital goods only. Then the country
has Y1 capital goods. If the country is using all the resources
to produce consumer goods, the country has X1 amount of
consumer goods but no any capital goods.
• If the country decided to produce both capital and
consumer goods and reach A. Buy doing so, the country has
given up (sacrifice) Y1-Y2 capital goods to produce O-Xo
amount of consumer goods.
• On Y1-X1 line the Y1-O/O-X1 (∆Y/∆X), the slope is same at
any point and it is termed fixed opportunity cost.
• The PPC become a curve indicating increasing opportunity
cost and this increasing opportunity cost is also important.
11. Basic Economic Questions
• There are three major questions that economist should
answer
– What to produce in what quintiles?
– How to produce?
– For whom to produce
• Let’s see the previous diagram. If the country needs to
produce only capital goods or consumer goods it will
remain at Y1 and X1 respectively.
• If she needs to produce both; for example, at A she
may produce O-Yo capital goods and O-Xo Consumer
goods. What to produce and how much to produce is
explained.
12. How to produce?
• Basically this is the question of technology to be
used. Assume that only two technologies are
available: labor intensive and capital intensive. In
order to answer this question transform the Axis
of previous diagram to capital (Y-axis) and Labor
(X-axis).
• Then you can see to be at A, the country needs
relatively more capital and to be at B, the country
need more labour.
• Very often, capital is more scarer than labour.
14. For whom to produce?
• Generally, national production/income of the
country should be distributed among the
owners of the factors of production.
• This is the problem of inequality which has
been faced by many governments but with
little success.
15. Chapter Two
Demand Analysis
• Objectives: Identifying the difference between
demand and effective demand; Factors
affecting demand and law of demand.
• Demand and effective demand: Demand
become effective only meeting two factors: 1.
desire for purchasing particular goods 2.
ability of customer to purchase desired goods.
16. Factors affecting demand
• Apart from price, the major factor which
associated with demand, prices of other
commodities (Pr), customer’s income (y) and
taste (T) or preference.
• Price of other commodities should have
following relationship with the price of goods
under consideration: i. substitutability ii.
complementary nature iii. unrelated goods.
17. Effect on demand due to Prices of
substitutable goods and
• Prices of substitutable goods is positively
related to prices of goods under
consideration.
• Prices of complementary goods have
negatively related prices of goods under
consideration.
• Prices of unrelated goods have no effect on
the prices of goods under consideration.
18. Demand curve for
Complementary goods
Price of
complementar
y/
substitutable
or unrelated
goods
Demand curve for
unrelated goods
Demand
curve for
substitutable
goods
Quantity Demanded for
goods under
consideration
19. Law of Demand
• The inverse relationship between price and
quantity demanded termed Law of Demand.
• This can be explained by three concepts:
– Demand schedule
– Demand curve
– Demand function
Demand schedule is a table which shows
quantity demanded at each price.
20. Plotting a graph between price and quantity
demanded at each price, one can trace
demand curve as illustrated below:
Price
Quantity
21. Demand Function
• Function is an expression which shows relationship between
variables: quantity demanded (Qd) and independent variables (Ex.
Price, income etc.)
• Using all factors affecting demand we can write the demand
function (Qd).
• Price of commodity (P), consumer’s income (Y), Prices of other
commodities (Pr), and Consumer taste (T).
• When we assume all other variable remained unchanged and only
varible that change is price
• We get
• .
)Pr,,,( TYPFQd
bpaQd
23. REAL INCOME? PRICE AND REAL INCOME
Real income is the amount
of goods one can purchase
within a unit of money.
Buying power in relation to
inflation determine the real
income.
When inflation is 2 percent
and the salary increase in
only one percent real
income drops by one
percent.
Price Rs. Quantity
demande
d
Consume
r income
Rs
50 5 250
25 10 250
10 25 250
24. Substitution effect
Substitution Effect
• When price increases
consumers tendency buy
substitutes at lower price to
fulfill the same need
attribute to the substitution
effect.
• As a result the prices of
substitute rises. Ex. Meat
and Fish
Income effect and substitution
effect . Retrieved from
https://dqydj.com/substitution-effect-income-effect
25. SHIFT IN DEMAND CURVE WITHOUT
CHANGING PR ICE, FOR EXAMPLE
CHANGE IN TECHNOLOGY
INCREASE IN DEMAND WITH
CHANGING PRICES
Price Qty.
Demand
ed at
lower
prices
Quantity
demanded
at higher
prices
Quantity
Price
Quantity
26. Chapter three
Supply
• Objectives: explain the concept of supply;
identify factors influence supply.
• Definition: the relationship between
quantities supplied to the market at different
prices at a given time is known as suppy.
• Law of supply. The positive relationship
between quantities supplied and prices
fetched for those quantities known as Law of
supply.
27. Supply Schedule, Supply curve and
Supply function
• The schedule which indicates quantities
supplied for corresponding prices is known as
supply schedule.
• Supply curve; Graphical representation of
supply schedule is known as supply curve.
• Supply function: The algebraic expression
which indicate the relation ship between
quantities supplied and factors influencing
supply is known as supply function.
28. Factors influencing supply
Price of the commodity = P, Price of the other commodity = Pr
Cost of production = C, Suppliers objectives = G
State of the technology= Tc,
Then we can write the equation
Qs = f (P, Pr, C, G, Tc)
When other factors, except price, remain constant, We can
write the equation
Qs = f (P); this implies supplied quantity is a function of
price. To make it more realistic
We can rewrite the function
Qs = f (m + nP)
31. Tracing equilibrium with supply and
demand functions
• . Demand equation
(Quantity Demanded) Qd = 50-5p
Supply equation
(Quantity supplied) Qs =-25 +5p
Finding Q and price at equilibrium level
Qs = Qd level0-5p = -25+5p
-10p = -75
Then , p = 7.5; Substituting p into equation
Qd = 50 -5 (7.5); =12.5
32. EFFECT OF TAX ON EQUILIBRIUM:
SUPPLY SHIFT UPWARDS (LEFT)
EFFECT OF SUBSIDIES:
SUPPLY SHIFTS DOWNWARD
(RIGHT)
S1
Price S2
Q
D
Demand
curve
S1
P S2
D
Q
Relief for
producer is in
red
33. Chapter Five
Concept of Elasticity
• Objectives: Define price elasticity, estimating
price elasticity of demand, stages of demand
• Elasticity of Demand
• Price elasticity of demand
. Percentage of change in qty. demand/percentage of
factor change
. Percentage of change in qty. demand/percentage
change of Price
34. Form of demand equation
Elasticity of Demand
Proportion of Quantity Change in Demand
(∆q/Q) / Proportion change Price (∆p/P)
Re-arranging above equation;
(∆q/Q)/ (∆p/P) = ∆q/Q = ∆q/∆P * P/Q
∆ P/P
35. Value of
Elasticity of
Demand (ED)
Inelastic Demand
ED < 1 >
0
Unitary Elastic of
Demand
Unit elastic of
Demand ED =1 Elastic demand
Elastic Demand
ED>1 Perfectly Elastic
Demand
Perfectly Elastic
Demand Infinity Perfectly
Inelastic demand
Perfectly inelastic
Demand 0
36. Chapter Six
Income Elasticity of Demand
• Objective: Explain Income Elasticity of
Demand, Cross elasticity of demand
• Definition: Change of demand in response to
change in income.
• Income elasticity of demand = % change in
demand / % change in income
yqEy %/%
37. Cross Price Elasticity of Demand
• Definition: Cross price elasticity of demand is
defined as the responsiveness of demand of
one commodity against changing prices of
another/other commodities.
• Percentage change in quantity of
demand/percentage of price of another
commodity
38. Do not forget of make a comment
on this presentation