Download as PDF, PPTX


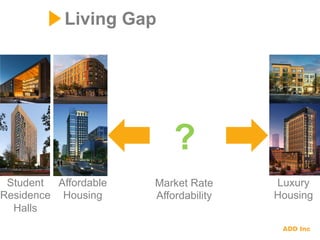


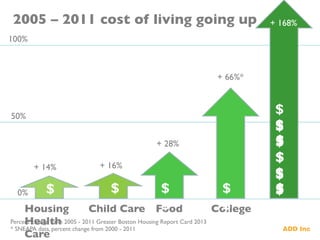
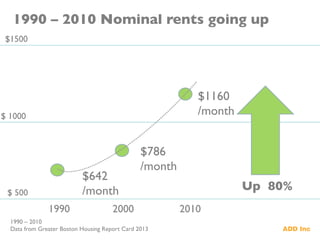
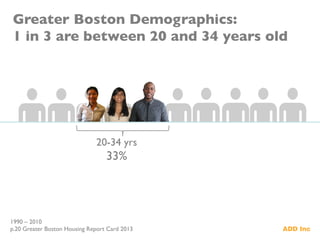
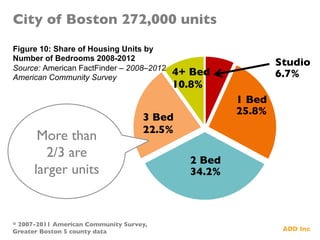
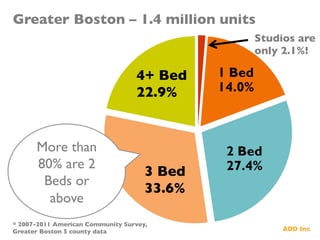
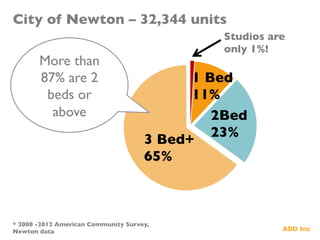
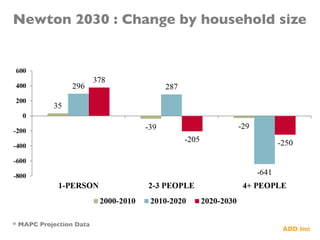
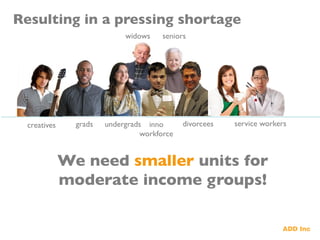
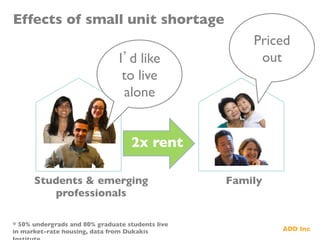
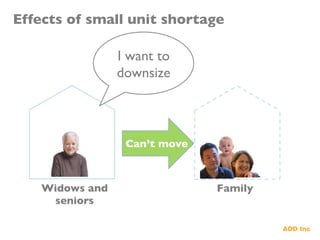
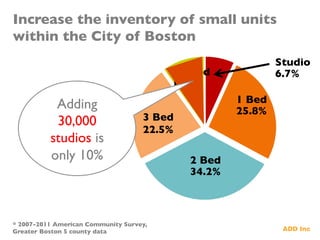

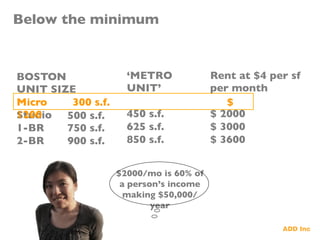

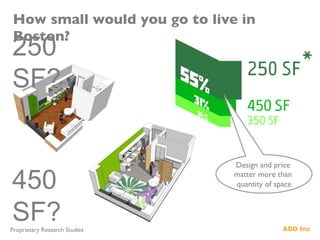


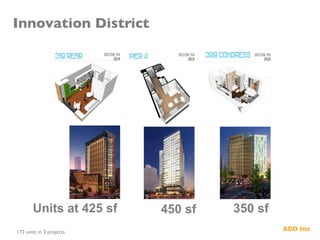
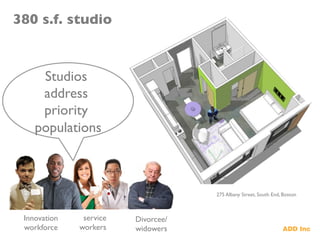
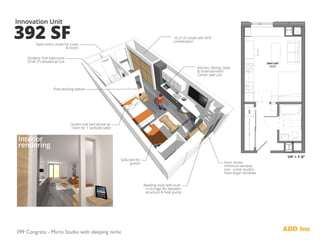
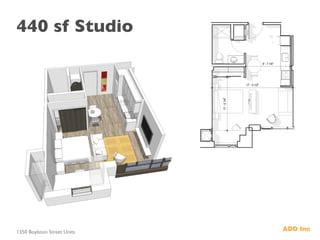
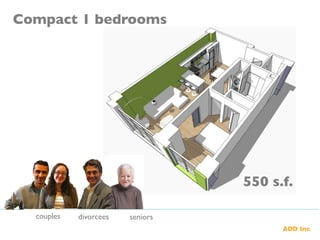
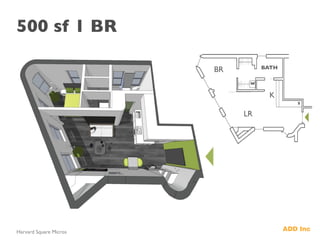
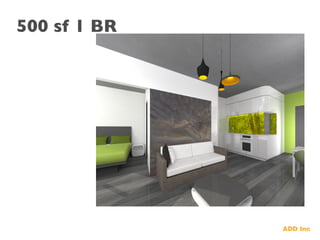
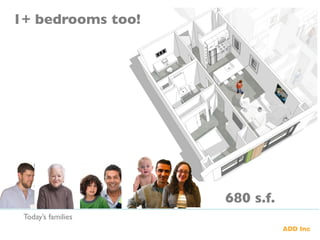
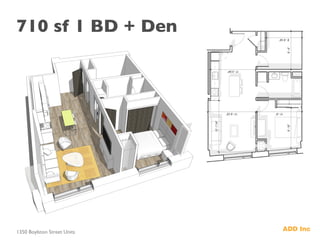

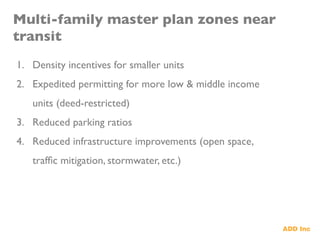


The document provides information about micro-housing and the need for smaller housing units in the Greater Boston area. It notes that housing costs have risen significantly while incomes have stagnated, leading to affordability issues. Many residents are single or older adults who would benefit from compact housing options. The document outlines examples of micro-housing projects in Boston consisting of studios and small one-bedroom units ranging from 300-700 square feet to address this need. It suggests ways city planning could support increasing the supply of smaller affordable units.