The document provides an overview of housing market indicators for the Greater Boston region in August 2015. Key points include:
- Closed home sales increased 13.5% year-over-year for single-family homes and 4.6% for condominiums.
- The median sales price was up 2.0% to $499,900 for single-family homes and 9.8% to $460,000 for condominiums.
- Inventory levels decreased with months supply of inventory down 23.3% for single-family homes and 17.5% for condominiums.
September 2015 Greater Boston Real Estate Market Trends ReportUnit Realty Group
Here’s September 2015’s Monthly Indicators report from the Greater Boston Association of Realtors®
September closed home sales up on strong buyer activity over the summer. Home prices continued to be pushed higher by strong demand and low supply in September. Six straight months of new listings added to the market are giving buyers more options.
• September single-family home sales – UP +15.0% over last year
• September Single-family median prices were UP +7.5% at $455,000
• September condo sales UP +4.1% and median prices were UP +3.4% at $428,500
• Inventory in September DOWN -10.1% to 3,870 and Condominiums DOWN -6.4% to 1,832
• SF listings added to the market in September UP +10.9% over last year. (2,040 from 1,839 in 2014)
• Condo listings added to the market UP +11.3% over last year. (1,421 from 1,277 in 2014)
February 2015 Greater Boston Real Estate Market Trends ReportUnit Realty Group
Here’s February 2015’s Monthly Indicators report from the Greater Boston Association of Realtors®
February condo sales closed down by almost two percent compared to the year before. Median prices continued to go up as supply continues to be down. Sellers were waiting out Mother Nature to add their homes to the market keeping new listings down in February.
• February single-family home sales: UP +5.0% over February 2014; median prices UP +7.9% ($439,500)
• February condo sales DOWN -1.8% over February 2014; median prices UP +3.5% ($403,568)
• Inventory in February DOWN -29.3% to 1,992 and Condominiums Down -32.9% to 1,057
• SF listings added to the market in February DOWN -38.7% over last year. (700 from 1,141 in 2014)
• Condo listings added to the market DOWN -33.7% over last year. (615 from 927 in 2014)
October 2015 Greater Boston Real Estate Market Trends ReportUnit Realty Group
Here’s October 2015’s Monthly Indicators report from the Greater Boston Association of Realtors®
October closed home sales up on strong buyer activity over the late summer/early fall. Low supply in October and ongoing buyer demand pushed home prices higher. Seven straight months of new listings added to the market are giving buyers more options.
• September single-family home sales – UP +13.0% over last year
September Single-family median prices were UP +1.1% at $440,000
• September condo sales DOWN -7.3% and median prices were UP +15.5% at $454,950
• Inventory in September DOWN -12.1% to 3,688 and Condominiums DOWN -10.0% to 1,773
• SF listings added to the market in September UP +2.6% over last year. (1,586 from 1,546 in 2014)
• Condo listings added to the market UP +5.3% over last year. (1,137 from 1,080 in 2014)
January 2015 Greater Boston Real Estate Market Trends ReportUnit Realty Group
Here’s January 2015’s Monthly Indicators report from the Greater Boston Association of Realtors®
Boston Real Estate Market Trends:
January home sales closed lower compared to last year as low inventory and end of month snow pushed off some closings. Median prices continued to go up as supply continues to be down. Sellers are waiting out Mother Nature to add their homes to the market keeping new listings down in January.
• January single-family home sales – UP +0.3% over last year and median prices UP +8.4% at $493,000
• January condo sales DOWN -18.5% and median prices UP +9.9% at $454,750
• Inventory in January DOWN -15.6% to 1,714 and condominiums DOWN -27.6% to 991
• SF listings added to the market in January DOWN -0.8% over last year. (753 from 759 in 2014)
• Condo listings added to the market DOWN -10.5% over last year. (674 from 753 in 2014)
July 2013's Monthly Indicators report - Boston Real Estate Market TrendsUnit Realty Group
Here's July 2013's Monthly Indicators report from the Greater Boston Association of Realtors.
What's going on in the Boston real estate market?
• July volume of closed sales (all property types) UP +17.2% over July, 2012
• July single-family market median sales price UP 4.5% over July, 2012
• July condo market median sales price UP 4% over July, 2012
December 2014 Greater Boston Real Estate Market Trends ReportUnit Realty Group
Here’s December 2014’s Monthly Indicators report from the Greater Boston Association of Realtors®
2014 ends on a high note with single-family closed sales up in December. Strong buyer activity, lower inventory and low interest rates pushed prices up again on homes in December. While overall inventory of homes for sale is down in our area, there continue to be pockets across that are seeing increases. 2014 was a year of lower sales, lower interest rates, lower homes for sale and higher prices.
• December single-family home sales – UP 1.3% over last year
• December Single-family median prices were UP +3.8% at $519,000
• December condo sales DOWN -4.1% and median prices UP +4.7% at $440,000
• Inventory in December DOWN -12.2% to 1,700 and Condominiums Down -28.8% to 940
• SF listings added to the market in December UP +5.6% over last year. (418 from 396 in 2013)
• Condo listings added to the DOWN -1.4% over last year. (357 from 362 in 2013)
November 2014 Greater Boston Real Estate Market Trends ReportUnit Realty Group
Here’s November 2014’s Monthly Indicators report from the Greater Boston Association of Realtors®
Strong buyer activity and low interest rates have pushed prices up on the homes that did close in November. While overall inventory of homes for sale is down statewide, there continues to be pockets across the state that are seeing increases. As the holiday season got under way in November, the number of new listings added to the market went down.
• November single-family home sales – Down 6.7% over last year.
• November Single-family median prices were UP 4.4% at $330,000
• November condo sales Down 10.2% and median prices UP 1.0% ($302,000)
• Inventory in November Down 13.2% to 19,068 and Condominiums Down 23.9% to 4,588
• SF listings added to the market in October Down 9.7% over last year. (3,575 from 3,958 in 2013)
• Condo listings added to the market Down 3.3% over last year. (1,343 from 1,389 in 2013)
April 2013's Monthly Indicators report - Boston Real Estate Market TrendsUnit Realty Group
Here's April 2013's Monthly Indicators report from the Greater Boston Association of Realtors®. What's going on in the Boston real estate market?
• Shortage of homes to buy has pushed sales down in April as buyer interest remains high.
• Prices continue to move up because demand for available homes to buy is outpacing supply.
• Sellers are gaining confidence as new listings added to the market jumped in April.
June 2013's Monthly Indicators report - Boston Real Estate Market TrendsUnit Realty Group
What’s going on in the Boston real estate market? Concerns about interest rates rising helped push activity higher in the spring, which resulted in an increase in closed sales in June. Prices continue to move up because demand for available homes to buy is outpacing supply. Sellers are gaining confidence as new listings continue to be added to the market.
June single-family home sales – Up 1.6% over last year. June Single-family median prices were UP 6.9% to $350,000 (highest point since Aug. ‘07 $357k). Condo sales up 0.4% and median prices UP 2.9% ($320,000) (only 3rd time over $300k).
September 2014 Multi-family Housing Activity Report – Boston, MA Real EstateUnit Realty Group
Here’s September 2014′s Monthly Multi-family Housing Activity Report from the Greater Boston Association of Realtors®.
(Multi-family housing activity comparing September 2014 to September 2013)
• Closed sales were up +8.0%
• Median prices were up +13.4%
• Inventory of Homes for Sale were down -18.3%
• Months Supply of Home for Sale were down -19.1%
• Days on market until sale were up +57.1%
• Percentage of original list price received were down -1.5%
• New Listings were up +13.5%
Boston By The Numbers - Boston Housing Stock (Report)Unit Realty Group
Here's an interesting report from late last year produced by the Boston Redevelopment Authority that details the history and current state of Boston housing stock. It's an interesting summary of our housing market filled with historical data, charts and graphs.
May 2014 Multi-family Housing Activity Report – Boston, MA Real EstateUnit Realty Group
Here’s April 2014′s Monthly Multi-family Housing Activity Report from the Greater Boston Association of Realtors®.
(Comparing May 2014 to May 2013)
• Closed sales were down -3.7%
• Median prices were up +14.1%
• Inventory of Homes for Sale were down -23.0%
• Months Supply of Home for Sale were down -28.2%
• Days on market until sale were down -20.7%
• Percentage of original list price received were up +1.2%
• New Listings were up +4.2%
November 2013 Multi-family Housing Activity Report – Boston, MA Real EstateUnit Realty Group
Here’s November 2013′s Monthly Multi-family Housing Activity Report from the Greater Boston Association of Realtors®.
(Comparing October 2013 to October 2012)
• Closed sales were unchanged
• Median prices were up +15.9%
• Inventory of homes for sale were down -35.8%
• Months supply of homes for sale were down -37.8%
• Days on market until sale were down -9.5%
• Percentage of original list price received were up +1.5%
• New Listings were down -23%
October 2013 Multi-family Housing Activity Report – Boston, MA Real EstateUnit Realty Group
Here’s October 2013′s Monthly Multifamily Housing Activity Report from the Greater Boston Association of Realtors®.
What’s Going On In The Market? (Comparing October 2013 to October 2012)
• Closed sales are up +10.5%
• Median Prices are up +13.3%
• Inventory is down -34.8%
• Months Supply of Homes for Sale is down -38.7%
• Days on market are down -26.1%
• New Listings are up +12.5
September 2013 Multifamily Housing Activity Report – Boston, MA Real EstateUnit Realty Group
Here’s September 2013′s Monthly Multifamily Housing Activity Report from the Greater Boston Association of Realtors®.
What’s Going On In The Market? (Comparing September 2013 to September 2012)
• Closed sales are up
• Median Prices are up
• Days on market are down
• Percentage of Original List Price to Price Received is up
• New Listings are up
June 2013 Multifamily Housing Activity Report – Boston, MA Real EstateUnit Realty Group
Here’s June’s 2013′s Monthly Multifamily Housing Activity Report from the Greater Boston Association of Realtors®.
What going on in the greater Boston multifamily housing market? Notably prices are up +19.3% and days on market are down -22.5% year to date comparing 2013 to 2013. Additionally inventory of homes for sale is down -39.4% and months of supply is down -43.2% comparing June 2013 to June 2012.
May 2013's Monthly Indicators report - Boston Real Estate Market Trends Unit Realty Group
Here's May 2013's Monthly Indicators report from the Greater Boston Association of Realtors®.
What’s going on in the Boston real estate market?
– Activity in late winter/early spring resulted in an increase in closed sales in May.
– Prices continue to move up because demand for available homes to buy is outpacing supply.
– Sellers are gaining confidence as new listings continue to be added to the market.
Note: Apologies for the low quality of these slides. As better slides become available we will replace the old ones for the new ones.
April 2013 Monthly Multi-family Housing Activity Report – Boston Real Estate Unit Realty Group
Here’s the Multi-Family Housing Activity Report, April 2013 from the Greater Boston Association of Realtors®
What’s this month’s bottom-line takeaway? Multifamily home median sale prices are up 32.1%, but sales are down by 16.2% over last April. Drops in inventory and months supply of multifamily homes for sale are both down by + 41% over last year and are responsible for the drop in closed sales.
February 2013 Monthly Multi-family Housing Activity Report - Boston Real EstateUnit Realty Group
Here's the Multi-Family Housing Activity Report, February 2013 from the Greater Boston Association of Realtors®
What's this month's bottom-line takeaway? Inventory of homes for sale and months supply of multi-homes for sale are at near record lows; down by roughly half as compared with last year in the metro Boston real estate market.
BricknBolt Understanding Load-Bearing Walls and Their Structural Support in H...BrickAndBolt
Load-bearing walls are the backbone of any home construction, providing crucial structural support that carries the weight of the house above. For companies like Brick and Bolt Mysore and Bricknbolt Faridabad, understanding and properly implementing these elements are key to constructing safe and durable buildings.
One FNG by Group 108 Sector 142 Noida Construction UpdateOne FNG
One FNG by Group 108 is launching a new commercial project in Sector 142 Noida. Office space and high street retail shops on the FNG and Noida Expressway. For more information visit the website https://www.onefng.com/
Lixin Azarmehr, a Los Angeles-based real estate development trailblazer, co-founded JL Real Estate Development (JL RED) in 2015 and serves as its CEO. Her expertise has propelled the firm to specialize in luxury residential and mixed-use commercial projects, with a portfolio that features upscale retail spaces and sophisticated care facilities.
Omaxe Sports City Dwarka stands out as a premier residential and recreational destination, offering a blend of luxury and sports-centric living. Located in the thriving area of Dwarka, this project by Omaxe Limited is designed to cater to modern lifestyle needs while promoting a healthy, active living environment.
Brigade Insignia offers meticulously designed apartments with modern architecture and premium finishes. The project features spacious 3,3.5,4 and 5 BHK units, each thoughtfully planned to provide maximum comfort, natural light, and ventilation.
https://www.newprojectbangalore.com/brigade-insignia-yelahanka-bangalore.html
Need MCA leads? No sweat! MCAs are great for small biz funding. Learn how to snag top-notch leads: businesses needing cash, with repayment ability, decision-makers, and accurate contacts. Use content, social ads, lead platforms, partnerships, and capture processes for quality leads.
https://www.leadgeneration.media/blog/b/streamline-your-mca-sales-process-with-pre-qualified-leads
Urbanrise Paradise on Earth - Unveiling Unprecedented Luxury in Exquisite Vil...JagadishKR1
Immerse yourself in the epitome of luxury living at Urbanrise Paradise on Earth. These opulent 4 BHK villas, nestled off the prestigious Kanakapura Road in Bangalore, redefine elegance and sophistication. With meticulous craftsmanship, breathtaking design, and unparalleled amenities, Urbanrise Paradise on Earth offers a sanctuary where every moment is infused with luxury and serenity. Experience a life of grandeur and indulgence at this exclusive residential enclave.
Elegant Evergreen Homes - Luxury Apartments Redefining Comfort in Yelahanka, ...JagadishKR1
Experience unmatched luxury at Elegant Evergreen Homes, offering exquisite 2, 3, and 4 BHK apartments in the serene locality of Yelahanka, Bangalore. These meticulously crafted homes blend modern design with timeless elegance, providing a harmonious living environment. Enjoy top-tier amenities and a prime location, making Elegant Evergreen Homes the ideal choice for discerning homeowners.
Avrupa Konutlari Yenimahalle - Listing TurkeyListing Turkey
Welcome to Avrupa Konutları Yenimahalle, where luxury living meets unparalleled convenience in the heart of Istanbul. Developed by Artaş Holding, one of Turkey’s leading construction companies, this prestigious residential project offers a contemporary lifestyle experience like no other.
https://listingturkey.com/property/avrupa-konutlari-yenimahalle/
Torun Center Residences Istanbul - Listing TurkeyListing Turkey
THERE IS LIFE IN ITS CENTER!
The most energetic spot of the city that will add utterly different pleasures to your life, with a park that will make Istanbul breathe, delighting indoor and outdoor bistros, cafes, restaurants, the brand-new Food Hall concept, where dozens of unique tastes are served together, market area, cinema, theater, fitness club, SPA and event venue...
All the pleasures that will enrich your lives are awaiting you on the most beautiful side of the city, at Torun Center Residences. In Mecidiyeköy, where the heart of Istanbul beats, business, life and entertainment opportunities are located at the exact center, at Torun Center, the most beautiful side of the city.
Penthouse apartments and different styles of flats from 1 + 1 to 4 + 1, from 100 to 425 square meters in a 42-story residence tower, have been designed for those who want to live in the center of magnificence. Torun Center is the redefinition of a better life with specially landscaped floor gardens, apartment options with private balconies, and automatic glass systems equipped with Trickle Ventilation that offers clean air comfort.
Business and life in the same place
Excellent service
Torun Center has many delightful details, from a swimming pool to sunbathing and resting terrace. With 24/7 concierge services, 24/7 security, valet, technical service, closed-circuit camera system (CCTV), central heating and cooling system, it makes your life easier.
Delightful details
The two-story Torun Center Lounge, with its indoor and outdoor seating areas, children's playroom, private dining and TV lounge, promises unforgettable memories to you and your loved ones with its unique Istanbul view.
Neighboring to the most pleasant square of Istanbul
A few steps from the Torun Center Residences, you can reach the city's most modern city square and open the doors of a quality city life. Torun Center Residences brings together on the same project the long-awaited city life for Istanbul and gourmet restaurants, cafes, gym and SPA, and state-of-the-art cinema and Artı Stage, hosting the most famous plays of the season.
Located at the intersection of alternative public transportation options such as the metro and Metrobus, Torun Center comes to the fore as the most accessible office for both sides of Istanbul. With a central location and rich transportation lines, Torun Center offices make life easier for employees and increase productivity.
Scanning tenants in NYC requires a thorough and compliant approach to ensure you find reliable renters. For a positive rental experience, consider hiring a property management service. Belgium Management LLC specializes in NYC rental property management and tenant relationship management. We prioritize tenant satisfaction, making us a trusted name in New York property management. Our dedicated team ensures tenants feel valued and supported throughout their lease.
MC Heights-Best Construction Company in jhanglaraibfatim009
MC Heights stands as the epitome of excellence in construction within Jhang. With a commitment to unparalleled quality and innovative design, MC Heights redefines urban living in the heart of Jhang. Offering luxurious residential spaces, cutting-edge commercial complexes, and vibrant community areas, MC Heights caters to the diverse needs of modern lifestyles. Our dedication to superior craftsmanship and customer satisfaction ensures that every aspect of MC Heights exceeds expectations, making it the premier choice for those seeking unparalleled sophistication and comfort in Jhang.
Keep Your Home Naturally Cool and Warm Out Change in Seasons
Vinra Construction is a private limited company registered under the ROC. The management has an experience of over 15 years of understanding the needs and delivering apt solutions to the end users We are providing turnkey solutions in construction fields. like Construction, Interior Designing Facility Management, Plantation Management, etc..
Vinra Construction Tech Enabled Company for Eco-Friendly Home Construction
Contact With Vinra for a Greener Future >>> Call us @ 888 4898 765
Investing In The US As A Canadian… And How To Do It RIGHT!! (feat. Erwin Szet...Volition Properties
=== Investing In The US As A Canadian… And How To Do It RIGHT!! (feat. Erwin Szeto) ===
Ever been curious about Real Estate Investing in the US?? At Volition, for the past 14 years, we have been focused on helping investors invest in over $250M of real estate and generate $100M of wealth in the Toronto market, but we are always open to learning more about other business models and learning from other investors.
The US has always been an intriguing market to invest in. But the US is a big place… if you’re interested in investing in the US, you probably have a lot of questions, like:
☑️ Specifically WHERE should you invest?
☑️ What are the best markets to invest in and why?
☑️ How much are property prices there?
☑️ What are the returns like?
☑️ What is cashflow like?
☑️ Compared to investing in Toronto or other cities in Ontario, what are the benefits / tradeoffs?
☑️ What ownership structure should I use?
☑️ What are the tax implications?
☑️ Can I get financing?
☑️ What are tenants like?
Enter Erwin Szeto, a longtime friend of Volition. Since 2005, Erwin Szeto and his team have navigated the challenging landscape of being landlords in Ontario. Now, they are shifting their focus and guiding their clients' investments toward the more landlord-friendly environment of the USA. This decision comes after assisting Canadian clients in transacting over $440,000,000 in income properties. Faced with issues like affordability constraints, tenant-friendly laws, rent control, and rental licensing in Canada, Erwin sees a clear opportunity in the U.S. Here, there is a significant influx of investments leading to the creation of high-paying manufacturing jobs. Erwin and his clients are poised to capitalize on these opportunities where landlord rights are stronger and there is no rent control.
To facilitate this transition, Erwin has partnered with and become a client of SHARE, a one-stop-shop U.S. Asset Manager. Founded by Canadians for Canadians, SHARE enables as passive an ownership experience as possible for landlords in the U.S., while still maintaining direct, 100% ownership.
Erwin is “Making Real Estate Investing Great Again”!!
Website: https://www.infinitywealth.ca/
Facebook: https://www.facebook.com/iwinrealestate and https://www.facebook.com/ErwinSzetoOfficial
Podcast: https://www.truthaboutrealestateinvesting.ca/
Instagram: https://www.instagram.com/iwinrealestate/ and https://www.instagram.com/erwinszeto/
Green Homes, Islamabad Presentation .pdfticktoktips
Green Homes Islamabad offers beautifully designed 5, 8, and 10 Marla homes near the airport and motorway. Enjoy luxury, convenience, and high rental returns in a prime location.
Referans Bahcesehir which is being constructed, in the center of the most regional destination as Bahçeşehir, shines out with its central location and unique landscape including social facilities such as a fitness center, sauna, sports facilities, children’s playground and recreational areas.
Not only drawing attention for immediate surroundings including commercial centers and private schools but also providing the easily accessible location with closeness to Tem Highway and connection roads, ongoing construction of 3rd Bridge Connection roads and Metro Projects
Bahcesehir is a rising value in the great city of Istanbul… Located at a new transportation junction in the northwest of the City… Located at such a spot that the access roads for the 3rd bridge and for the 3rd Airport will reach the region in 2016. The Marmaray and the Subway will extend all the way to Referans Bahcesehir respectively in 2018 and 2019.
465 flats and 34 stores are designed with an outstanding approach and arranged with a unique perspective offering the following options: 1 plus 1, 2 plus 1, 3 plus 1, 3.5 plus 1, 4 plus 1, and 4.5 plus 1. It is planned so as to safeguard you and your loved ones based upon a modern, technological safety approach. As you experience the joy and luxury here, you will be content and feet at ease.
It is worth seeing both inside and outside with heart-warming cafes, tasty restaurants and elegant stores… And it is ready to offer a vivacious social life with a warm and cozy space design.
A folding swimming pool and indoor swimming pools, playgrounds, Turkish bath, sauna… It has them all. Everything you need for your well-being and for having a pleasant time will be at your service. You simply need to align the rhythm of life with the rhythm of Referans Bahcesehir.
https://listingturkey.com/property/referans-bahcesehir/
500 acres of brilliance await you here at Riverview City which offers modern living, effortless convenience, and a beautiful natural setting. It is a mega township by Magarpatta City in Loni Kalbhor, Pune. Enjoy easy access to work, schools, and fun while experiencing a perfect work-life balance.
Visit - magarpattacity.developerprojects.in
Rixos Tersane Istanbul Residences Brochure_May2024_ENG.pdfListing Turkey
Tersane Suites Residences is a luxurious real estate project located in the heart of Istanbul, next to the beautiful Golden Horn. This unique development offers hotel concept residences with Rixos management, making it the perfect choice for both homeowners and investors.
The Tersane Suites Residences offers a wide range of options, from studio apartments to spacious four-bedroom units, all designed to the highest standard. The suites are finished with high-quality materials and feature modern, open-plan living spaces, fully-equipped kitchens, and large balconies with stunning views of the city and sea.
One of the standout features of Tersane Suites Residences is the Rixos management, which provides a truly exclusive and upscale living experience. Residents will have access to a range of luxury amenities, including a fitness center, spa, and indoor and outdoor swimming pools. Plus, the on-site restaurants and cafes provide a taste of the local and international cuisine.
The Tersane Suites Residences also offers a great opportunity for investors, as it provides a rental guarantee program. This means that investors can enjoy a steady income stream, with the peace of mind that their property is being managed by a reputable and experienced team.
The location of Tersane Suites Residences is also unbeatable, with easy access to the city’s main transportation links and within close proximity to the historic center, making it the perfect base for exploring all that Istanbul has to offer.
Rixos Tersane Istanbul Residences Brochure_May2024_ENG.pdf
August 2015 Greater Boston Real Estate Market Trends Report
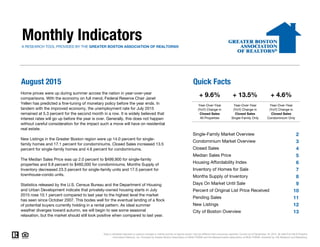
1. Monthly IndicatorsA RESEARCH TOOL PROVIDED BY THE GREATER BOSTON ASSOCIATION OF REALTORS®
August 2015 Quick Facts
2
3
4
5
6
7
8
9
10
11
12
13
Data is refreshed regularly to capture changes in market activity so figures shown may be different than previously reported. Current as of September 16, 2015. All data from MLS Property
Information Network, Inc. Provided by Greater Boston Association of REALTORS® and the Massachusetts Association of REALTORS®. Powered by 10K Research and Marketing.
+ 13.5%
Year-Over-Year
(YoY) Change in
Closed Sales
Single-Family Only
Home prices were up during summer across the nation in year-over-year
comparisons. With the economy on full mend, Federal Reserve Chair Janet
Yellen has predicted a fine-tuning of monetary policy before the year ends. In
tandem with the improved economy, the unemployment rate for July 2015
remained at 5.3 percent for the second month in a row. It is widely believed that
interest rates will go up before the year is over. Generally, this does not happen
without careful consideration for the impact such a move will have on residential
real estate.
New Listings in the Greater Boston region were up 14.0 percent for single-
family homes and 17.1 percent for condominiums. Closed Sales increased 13.5
percent for single-family homes and 4.6 percent for condominiums.
The Median Sales Price was up 2.0 percent to $499,900 for single-family
properties and 9.8 percent to $460,000 for condominiums. Months Supply of
Inventory decreased 23.3 percent for single-family units and 17.5 percent for
townhouse-condo units.
Statistics released by the U.S. Census Bureau and the Department of Housing
and Urban Development indicate that privately-owned housing starts in July
2015 rose 10.1 percent compared to last year to the highest level the market
has seen since October 2007. This bodes well for the eventual landing of a flock
of potential buyers currently holding in a rental pattern. As ideal summer
weather diverges toward autumn, we will begin to see some seasonal
relaxation, but the market should still look positive when compared to last year.
+ 4.6%
Year-Over-Year
(YoY) Change in
Closed Sales
Condominium Only
+ 9.6%
Year-Over-Year
(YoY) Change in
Closed Sales
All Properties
Single-Family Market Overview
Condominium Market Overview
Closed Sales
Median Sales Price
Housing Affordability Index
Inventory of Homes for Sale
Months Supply of Inventory
Days On Market Until Sale
Percent of Original List Price Received
City of Boston Overview
Pending Sales
New Listings
2. Single-Family Market Overview
Key market metrics for the current month and year-to-date figures for Single-Family Homes Only.
Key Metrics Historical Sparklines Aug-2014 Aug-2015 + / – YTD 2014 YTD 2015 + / –
97.6% 98.0%
+ 4.0%
+ 0.4%
Percent of Original
List Price Received
Days on Market Until Sale
97.8%
+ 2.9%
+ 0.5%
61
98.2%
Pending Sales
Median Sales Price
+ 9.9%10,421995 1,302 + 30.9% 9,484
- 13.0% -- --
- 1.0% 94 91 - 2.9%
--
Housing Affordability Index
Inventory of Homes for Sale
Months Supply of Inventory 2.7
$490,000 + 4.0%
60
90 89
71
-- -- --
4,021 3,500
2.0 - 23.3%
$499,900 + 2.0% $471,000
68
9,378 + 4.5%
All data from MLS Property Information Network, Inc. Provided by the Greater Boston Association of REALTORS® and the Massachusetts Association of REALTORS®. Powered by 10K Research and Marketing. | 2
New Listings 1,267 1,445 + 14.0% 13,339 13,766 + 3.2%
Closed Sales 1,516 1,720 + 13.5% 8,970
$490,000
8-2012 8-2013 8-2014 8-2015
8-2012 8-2013 8-2014 8-2015
8-2012 8-2013 8-2014 8-2015
8-2012 8-2013 8-2014 8-2015
8-2012 8-2013 8-2014 8-2015
8-2012 8-2013 8-2014 8-2015
8-2012 8-2013 8-2014 8-2015
8-2012 8-2013 8-2014 8-2015
8-2012 8-2013 8-2014 8-2015
3. Condominium Market Overview
Key market metrics for the current month and year-to-date figures for Condominium Properties Only.
Key Metrics Historical Sparklines Aug-2014 Aug-2015 + / – YTD 2014 YTD 2015 + / –
- 2.0%
Median Sales Price $419,000 $460,000 + 9.8% $417,000 $450,000 + 7.9%
Closed Sales 1,138 1,190 + 4.6% 7,179 7,035
- 6.4%
Inventory of Homes for Sale 1,758 1,516 - 13.8% -- -- --
Housing Affordability Index 106 97 - 8.0% 106 99
--
Days on Market Until Sale 52 46 - 12.5% 56 51 - 9.5%
Months Supply of Inventory 1.5 1.3 - 17.5% -- --
+ 0.7%
Pending Sales 721 842 + 16.8% 7,574 7,842 + 3.5%
Percent of Original
List Price Received
99.9% 100.5% + 0.6% 99.6% 100.3%
+ 2.6%
All data from MLS Property Information Network, Inc. Provided by the Greater Boston Association of REALTORS® and the Massachusetts Association of REALTORS®. Powered by 10K Research and Marketing. | 3
New Listings 777 910 + 17.1% 9,234 9,470
8-2012 8-2013 8-2014 8-2015
8-2012 8-2013 8-2014 8-2015
8-2012 8-2013 8-2014 8-2015
8-2012 8-2013 8-2014 8-2015
8-2012 8-2013 8-2014 8-2015
8-2012 8-2013 8-2014 8-2015
8-2012 8-2013 8-2014 8-2015
8-2012 8-2013 8-2014 8-2015
8-2012 8-2013 8-2014 8-2015
4. Closed Sales
A count of the actual sales that have closed in a given month.
Single-Family
YoY
Change
Condominium
YoY
Change
Sep-2014 1,067 - 6.3% 862 - 7.5%
Oct-2014 1,047 - 3.9% 864 + 6.9%
Nov-2014 960 - 7.8% 651 - 14.2%
Dec-2014 1,116 + 3.2% 811 - 2.9%
Jan-2015 742 + 1.4% 480 - 15.5%
Feb-2015 554 + 6.5% 449 - 0.2%
Mar-2015 711 - 0.1% 579 - 16.3%
Apr-2015 787 - 8.7% 677 - 21.9%
May-2015 1,083 - 10.2% 948 - 5.1%
Jun-2015 1,872 + 11.2% 1,374 + 8.3%
Jul-2015 1,909 + 9.8% 1,338 + 11.9%
Aug-2015 1,720 + 13.5% 1,190 + 4.6%
Total 13,568 + 1.9% 10,223 - 2.8%
All data from MLS Property Information Network, Inc. Provided by the Greater Boston Association of REALTORS® and the Massachusetts Association of REALTORS®. Powered by 10K Research and Marketing. | 4
1,694
1,335
1,516
1,138
1,720
1,190
Single-Family Condominium
August
200
400
600
800
1,000
1,200
1,400
1,600
1,800
2,000
Jan-2003 Jan-2004 Jan-2005 Jan-2006 Jan-2007 Jan-2008 Jan-2009 Jan-2010 Jan-2011 Jan-2012 Jan-2013 Jan-2014 Jan-2015
Historical Closed Sales Activity Single-Family Condominium
+4.6%-14.8%-10.5%
20152014 20152014
9,539
7,592
8,970
7,179
9,378
7,035
Single-Family Condominium
Year to Date
-2.0%-5.4%-6.0%
20152014 20152014
+13.5% +4.5%
2013 2013 2013 2013
5. Median Sales Price
Median price point for all closed sales, not accounting for seller concessions, in a given month.
Single-Family
YoY
Change
Condominium
YoY
Change
Sep-2014 $424,900 - 1.5% $414,500 + 4.9%
Oct-2014 $435,000 + 3.6% $394,500 - 0.5%
Nov-2014 $450,000 + 8.4% $415,000 + 5.1%
Dec-2014 $443,500 + 2.0% $425,000 + 4.9%
Jan-2015 $446,000 + 6.7% $442,500 + 10.8%
Feb-2015 $438,500 + 7.6% $407,135 + 4.4%
Mar-2015 $432,500 + 1.3% $449,000 + 6.9%
Apr-2015 $470,000 + 6.8% $438,500 + 10.5%
May-2015 $480,000 + 3.4% $456,325 + 9.3%
Jun-2015 $526,655 + 3.3% $459,500 + 4.5%
Jul-2015 $525,000 + 4.0% $460,000 + 9.8%
Aug-2015 $499,900 + 2.0% $460,000 + 9.8%
Median $473,500 + 4.2% $440,000 + 7.3%
All data from MLS Property Information Network, Inc. Provided by the Greater Boston Association of REALTORS® and the Massachusetts Association of REALTORS®. Powered by 10K Research and Marketing. | 5
$470,000
$405,000
$490,000
$419,000
$499,900
$460,000
Single-Family Condominium
August
$250,000
$300,000
$350,000
$400,000
$450,000
$500,000
$550,000
$600,000
Jan-2003 Jan-2004 Jan-2005 Jan-2006 Jan-2007 Jan-2008 Jan-2009 Jan-2010 Jan-2011 Jan-2012 Jan-2013 Jan-2014 Jan-2015
Historical Median Sales Price Single-Family Condominium
+9.8%+3.5%+4.3%
20152014 20152014
$440,000
$390,000
$471,000
$417,000
$490,000
$450,000
Single-Family Condominium
Year to Date
+7.9%+6.9%+7.0%
20152014 20152014
+2.0% +4.0%
2013 2013 2013 2013
6. Housing Affordability Index
Single-Family
YoY
Change
Condominium
YoY
Change
Sep-2014 103 + 0.3% 106 - 5.9%
Oct-2014 102 - 3.0% 113 + 1.0%
Nov-2014 99 - 12.1% 108 - 9.3%
Dec-2014 101 - 1.4% 106 - 4.2%
Jan-2015 103 + 1.0% 103 - 2.7%
Feb-2015 105 - 1.2% 113 + 1.9%
Mar-2015 105 + 3.4% 101 - 2.0%
Apr-2015 97 - 0.3% 104 - 3.6%
May-2015 96 + 0.4% 101 - 5.0%
Jun-2015 86 - 1.1% 98 - 2.3%
Jul-2015 84 - 3.1% 96 - 8.2%
Aug-2015 89 - 1.0% 97 - 8.0%
Average 98 -1.5% 104 -4.0%
This index measures housing affordability for the region. An index of 120 means the median household income was 120% of what is necessary
to qualify for the median-priced home under prevailing interest rates. A higher number means greater affordability.
All data from MLS Property Information Network, Inc. Provided by the Greater Boston Association of REALTORS® and the Massachusetts Association of REALTORS®. Powered by 10K Research and Marketing. | 6
93
108
90
106
89
97
Single-Family Condominium
August
50
60
70
80
90
100
110
120
130
140
150
Jan-2004 Jan-2005 Jan-2006 Jan-2007 Jan-2008 Jan-2009 Jan-2010 Jan-2011 Jan-2012 Jan-2013 Jan-2014 Jan-2015
Historical Housing Affordability Index Single-Family Condominium
-8.0%-2.2%-2.9%
99
112
94
106
91
99
Single-Family Condominium
Year to Date
-6.4%-5.4%-5.5%
20152014 20152014 20152014 20152014
-1.0% -2.9%
2013 2013 2013 2013
7. Inventory of Homes for Sale
The number of properties available for sale in active status at the end of a given month.
Single-Family
YoY
Change
Condominium
YoY
Change
Sep-2014 4,301 + 5.9% 1,951 - 12.4%
Oct-2014 4,185 + 7.5% 1,961 - 9.0%
Nov-2014 3,499 + 3.7% 1,640 - 10.6%
Dec-2014 2,771 + 2.7% 1,289 - 13.9%
Jan-2015 2,634 - 1.8% 1,300 - 13.7%
Feb-2015 2,425 - 14.3% 1,239 - 21.4%
Mar-2015 2,593 - 16.0% 1,379 - 18.0%
Apr-2015 3,310 - 8.1% 1,741 - 7.0%
May-2015 3,829 - 8.1% 1,911 - 6.2%
Jun-2015 3,932 - 7.1% 1,863 - 7.0%
Jul-2015 3,818 - 8.2% 1,725 - 10.4%
Aug-2015 3,500 - 13.0% 1,516 - 13.8%
Average 3,400 - 4.7% 1,626 - 11.6%
All data from MLS Property Information Network, Inc. Provided by the Greater Boston Association of REALTORS® and the Massachusetts Association of REALTORS®. Powered by 10K Research and Marketing. | 7
3,820
2,001
4,021
1,758
3,500
1,516
Single-Family Condominium
August
1,000
2,000
3,000
4,000
5,000
6,000
7,000
8,000
9,000
10,000
Jan-2003 Jan-2004 Jan-2005 Jan-2006 Jan-2007 Jan-2008 Jan-2009 Jan-2010 Jan-2011 Jan-2012 Jan-2013 Jan-2014 Jan-2015
Historical Inventory of Homes for Sale Single-Family Condominium
-13.8%-12.1%+5.3%
20152014 20152014
-13.0%
2013 2013
8. Months Supply of Inventory
The inventory of homes for sale at the end of a given month, divided by the average monthly pending sales from the last 12 months.
Single-Family
YoY
Change
Condominium
YoY
Change
Sep-2014 4.0 + 13.0% 2.3 - 5.3%
Oct-2014 4.0 + 11.8% 2.3 - 14.9%
Nov-2014 3.6 + 12.5% 2.5 + 4.3%
Dec-2014 2.5 - 0.6% 1.6 - 11.3%
Jan-2015 3.5 - 3.1% 2.7 + 2.1%
Feb-2015 4.4 - 19.6% 2.8 - 21.2%
Mar-2015 3.6 - 15.9% 2.4 - 2.0%
Apr-2015 4.2 + 0.7% 2.6 + 19.0%
May-2015 3.5 + 2.3% 2.0 - 1.1%
Jun-2015 2.1 - 16.5% 1.4 - 14.1%
Jul-2015 2.0 - 16.4% 1.3 - 19.9%
Aug-2015 2.0 - 23.3% 1.3 - 17.5%
Average 3.1 - 1.3% 1.9 - 6.0%
All data from MLS Property Information Network, Inc. Provided by the Greater Boston Association of REALTORS® and the Massachusetts Association of REALTORS®. Powered by 10K Research and Marketing. | 8
2.3
1.5
2.7
1.5
2.0
1.3
Single-Family Condominium
August
0
2
4
6
8
10
12
14
16
Jan-2004 Jan-2005 Jan-2006 Jan-2007 Jan-2008 Jan-2009 Jan-2010 Jan-2011 Jan-2012 Jan-2013 Jan-2014 Jan-2015
Historical Months Supply of Inventory Single-Family Condominium
-17.5%+3.1%+17.6%
20152014 20152014
-23.3%
2013 2013
9. Days on Market Until Sale
Average number of days between when a property is listed and when an offer is accepted in a given month.
Single-Family
YoY
Change
Condominium
YoY
Change
Sep-2014 67 + 5.4% 53 + 6.3%
Oct-2014 70 + 12.5% 53 + 10.0%
Nov-2014 75 + 6.8% 57 + 0.5%
Dec-2014 79 + 11.2% 55 - 2.9%
Jan-2015 90 + 10.7% 63 - 3.8%
Feb-2015 105 + 11.2% 78 - 2.2%
Mar-2015 100 + 12.9% 69 - 0.4%
Apr-2015 90 + 4.7% 59 + 1.2%
May-2015 71 + 9.0% 47 - 8.4%
Jun-2015 60 + 2.0% 42 - 9.6%
Jul-2015 54 - 3.6% 41 - 19.4%
Aug-2015 61 + 2.9% 46 - 12.5%
Total 72 + 5.6% 50 - 5.1%
All data from MLS Property Information Network, Inc. Provided by the Greater Boston Association of REALTORS® and the Massachusetts Association of REALTORS®. Powered by 10K Research and Marketing. | 9
51
42
60
52
61
46
Single-Family Condominium
August
30
50
70
90
110
130
150
170
Jan-2003 Jan-2004 Jan-2005 Jan-2006 Jan-2007 Jan-2008 Jan-2009 Jan-2010 Jan-2011 Jan-2012 Jan-2013 Jan-2014 Jan-2015
Historical Days on Market Until Sale Single-Family Condominium
-12.5%+22.9%+17.1%
74
56
68
56
71
51
Single-Family Condominium
Year to Date
-9.5%-0.5%-8.2%
20152014 20152014 20152014 20152014
+2.9% +4.0%
2013 2013 2013 2013
10. Percent of Original List Price Received
Single-Family
YoY
Change
Condominium
YoY
Change
Sep-2014 96.7% - 0.2% 99.0% + 0.2%
Oct-2014 96.5% - 0.4% 98.5% - 0.1%
Nov-2014 96.3% + 0.2% 98.2% - 0.4%
Dec-2014 95.3% - 0.6% 97.9% + 0.1%
Jan-2015 95.6% + 0.3% 97.8% + 0.7%
Feb-2015 95.1% - 0.7% 97.9% - 0.1%
Mar-2015 96.2% - 0.2% 98.6% - 0.2%
Apr-2015 97.2% - 0.2% 100.3% + 1.0%
May-2015 98.8% + 0.6% 100.8% + 0.2%
Jun-2015 99.2% + 0.5% 101.6% + 0.8%
Jul-2015 99.1% + 1.0% 101.1% + 1.3%
Aug-2015 98.2% + 0.5% 100.5% + 0.6%
Average 97.5% + 0.2% 99.7% + 0.5%
All data from MLS Property Information Network, Inc. Provided by the Greater Boston Association of REALTORS® and the Massachusetts Association of REALTORS®. Powered by 10K Research and Marketing. | 10
Percentage found when dividing a property’s sales price by its original list price, then taking the average for all properties sold in a given month,
not accounting for seller concessions.
97.6% 99.5%97.8% 99.9%98.2% 100.5%
Single-Family Condominium
August
89%
91%
93%
95%
97%
99%
101%
103%
105%
Jan-2003 Jan-2004 Jan-2005 Jan-2006 Jan-2007 Jan-2008 Jan-2009 Jan-2010 Jan-2011 Jan-2012 Jan-2013 Jan-2014 Jan-2015
Historical Percent of Original List Price Received Single-Family Condominium
+0.6%+0.4%+0.1%
96.8% 98.8%97.6% 99.6%98.0% 100.3%
Single-Family Condominium
Year to Date
+0.7%+0.8%+0.9%
20152014 20152014 20152014 20152014
+0.5% +0.4%
2013 2013 2013 2013
11. Pending Sales
A count of the properties in UAG status between the first and last day in a given month, regardless of current status (based on Off Market Date).
Single-Family
YoY
Change
Condominium
YoY
Change
Sep-2014 1,058 0.0% 836 + 2.5%
Oct-2014 1,171 + 2.8% 823 - 4.5%
Nov-2014 916 + 3.9% 654 - 2.5%
Dec-2014 651 + 9.4% 447 + 1.8%
Jan-2015 718 + 11.3% 558 - 11.7%
Feb-2015 667 - 15.9% 568 - 23.9%
Mar-2015 1,156 - 7.8% 985 - 6.5%
Apr-2015 1,588 + 7.7% 1,271 + 3.8%
May-2015 1,775 + 9.9% 1,282 + 13.7%
Jun-2015 1,835 + 21.1% 1,369 + 20.0%
Jul-2015 1,380 + 15.8% 967 + 4.2%
Aug-2015 1,302 + 30.9% 842 + 16.8%
Total 14,217 + 8.0% 10,602 + 2.3%
All data from MLS Property Information Network, Inc. Provided by the Greater Boston Association of REALTORS® and the Massachusetts Association of REALTORS®. Powered by 10K Research and Marketing. | 11
1,100
799
995
721
1,302
842
Single-Family Condominium
August
200
400
600
800
1,000
1,200
1,400
1,600
1,800
2,000
Jan-2003 Jan-2004 Jan-2005 Jan-2006 Jan-2007 Jan-2008 Jan-2009 Jan-2010 Jan-2011 Jan-2012 Jan-2013 Jan-2014 Jan-2015
Historical Pending Sales Activity Single-Family Condominium
+16.8%-9.8%-9.5%
10,259
8,229
9,484
7,574
10,421
7,842
Single-Family Condominium
Year to Date
+3.5%-8.0%-7.6%
20152014 20152014 20152014 20152014
+30.9% +9.9%
2013 2013 2013 2013
12. New Listings
A count of the properties that have been newly listed on the market in a given month.
Single-Family
YoY
Change
Condominium
YoY
Change
Sep-2014 1,839 + 2.2% 1,277 - 3.0%
Oct-2014 1,547 + 5.4% 1,080 + 0.2%
Nov-2014 796 - 9.9% 599 + 0.3%
Dec-2014 590 + 9.7% 396 + 0.8%
Jan-2015 894 - 4.6% 709 - 10.5%
Feb-2015 697 - 38.9% 616 - 33.5%
Mar-2015 1,545 - 13.0% 1,253 - 4.0%
Apr-2015 2,525 + 12.6% 1,745 + 11.3%
May-2015 2,586 + 4.3% 1,617 + 9.5%
Jun-2015 2,359 + 18.1% 1,547 + 16.8%
Jul-2015 1,715 + 14.5% 1,073 + 0.8%
Aug-2015 1,445 + 14.0% 910 + 17.1%
Total 18,538 + 2.8% 12,822 + 1.6%
All data from MLS Property Information Network, Inc. Provided by the Greater Boston Association of REALTORS® and the Massachusetts Association of REALTORS®. Powered by 10K Research and Marketing. | 12
1,366
947
1,267
777
1,445
910
Single-Family Condominium
August
0
250
500
750
1,000
1,250
1,500
1,750
2,000
2,250
2,500
2,750
Jan-2003 Jan-2004 Jan-2005 Jan-2006 Jan-2007 Jan-2008 Jan-2009 Jan-2010 Jan-2011 Jan-2012 Jan-2013 Jan-2014 Jan-2015
Historical New Listing Activity Single-Family Condominium
+17.1%-18.0%-7.2%
13,454
10,042
13,339
9,234
13,766
9,470
Single-Family Condominium
Year to Date
+2.6%-8.0%-0.9%
20152014 20152014 20152014 20152014
+14.0% +3.2%
2013 2013 2013 2013
13. City of Boston – Market Overview
Key market metrics for the current month and year-to-date figures for the City of Boston.
Key Metrics Historical Sparklines Aug-2014 Aug-2015 + / – YTD 2014 YTD 2015 + / –
- 2.4%
Median Sales Price $450,000 $525,000 + 16.7% $469,350 $510,000 + 8.7%
Closed Sales 594 605 + 1.9% 3,693 3,604
- 2.9%
Inventory of Homes for Sale 856 726 - 15.2% -- -- --
Housing Affordability Index 90 89 - 1.0% 94 91
--
Days on Market Until Sale 42 44 + 4.1% 49 48 - 1.9%
Months Supply of Inventory 1.4 1.2 - 16.7% -- --
+ 0.4%
Pending Sales 335 417 + 24.5% 3,867 3,989 + 3.2%
Percent of Original
List Price Received
99.6% 100.0% + 0.4% 99.6% 100.0%
+ 0.4%
All data from MLS Property Information Network, Inc. Provided by the Greater Boston Association of REALTORS® and the Massachusetts Association of REALTORS®. Powered by 10K Research and Marketing. | 13
New Listings 381 439 + 15.2% 4,797 4,816
8-2012 8-2013 8-2014 8-2015
8-2012 8-2013 8-2014 8-2015
8-2012 8-2013 8-2014 8-2015
8-2012 8-2013 8-2014 8-2015
8-2012 8-2013 8-2014 8-2015
8-2012 8-2013 8-2014 8-2015
8-2012 8-2013 8-2014 8-2015
8-2012 8-2013 8-2014 8-2015
8-2012 8-2013 8-2014 8-2015