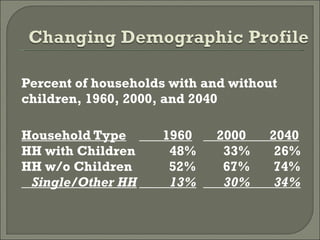
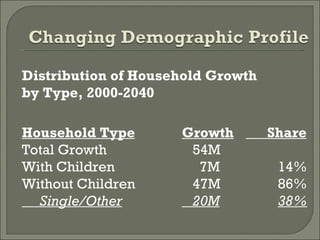
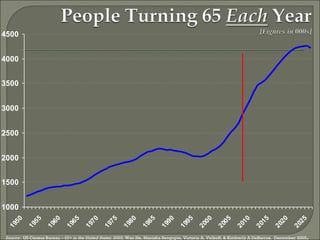
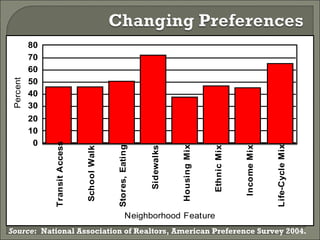
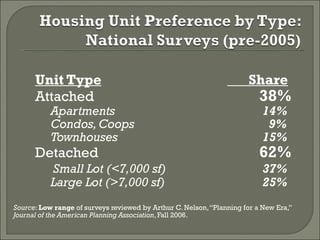
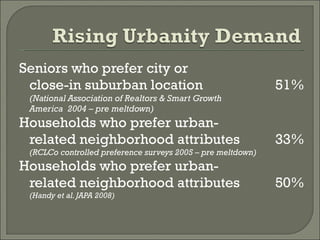
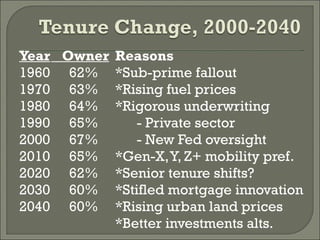
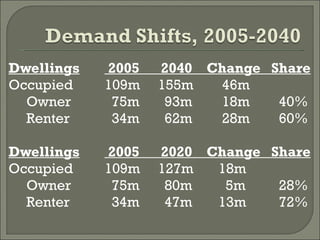
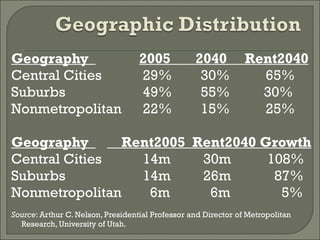
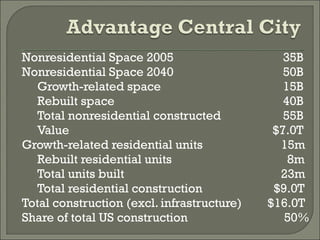
Arthur C. Nelson, Ph.D., FAICP Presidential Professor and Director of Metropolitan Research University of Utah University of Pennsylvania October 24, 2008
Changing Demographic Profile Changing Preferences Housing Tenure Changes Trends to Mid Century
Percent of households with and without children, 1960, 2000, and 2040   Household Type   1960   2000  2040 HH with Children   48%   33%  26% HH w/o Children  52%  67%  74%   Single/Other HH   13%   30%  34%
Distribution of Household Growth  by Type, 2000-2040 Household Type Growth   Share Total Growth   54M With Children     7M 14% Without Children   47M 86% Single/Other   20M 38%
Source:  US Census Bureau  – 65+ in the United States: 2005;  Wan He, Manisha Sengupta, Victoria A. Velkoff, & Kimberly A DeBarros.  December 2005 .
Source :  National Association of Realtors, American Preference Survey 2004.
Unit Type   Share Attached 38%   Apartments   14%   Condos, Coops   9%   Townhouses   15% Detached 62%     Small Lot (<7,000 sf)   37%   Large Lot (>7,000 sf)   25% Source :  Low range  of surveys reviewed by Arthur C. Nelson, “Planning for a New Era,”  Journal of the American Planning Association , Fall 2006.
Seniors who prefer city or close-in suburban location 51% (National Association of Realtors & Smart Growth  America  2004 – pre meltdown) Households who prefer urban- related neighborhood attributes 33% (RCLCo controlled preference surveys 2005 – pre meltdown) Households who prefer urban- related neighborhood attributes 50% (Handy et al. JAPA 2008)
Year Units  Detached  Share  Own 2003 1,889  1,461   77%  67% 2004 2,052  1,596   78%   69% 2005 2,070  1,613   78%   69% 2006 2,155  1,682   78%   69% 2007 1,839  1,378   75%    68% Total  10,006  7,731   77% Ave. 2,001  1,546   77%   68% Source : Census data compiled by Arthur C. Nelson, Presidential Professor and Director of Metropolitan Research, University of Utah.
Year   Owner Reasons 1960   62% *Sub-prime fallout 1970   63% *Rising fuel prices 1980   64% *Rigorous underwriting 1990   65%   - Private sector 2000   67%   - New Fed oversight 2010   65% *Gen-X, Y, Z+ mobility pref. 2020   62% *Senior tenure shifts? 2030   60% *Stifled mortgage innovation 2040   60% *Rising urban land prices *Better investments alts.
Dwellings  2005  2040  Change  Share Occupied 109m  155m   46m Owner   75m  93m   18m   40% Renter   34m  62m   28m   60% Dwellings  2005  2020  Change  Share Occupied 109m  127m   18m Owner   75m  80m   5m   28% Renter   34m  47m   13m   72%
Geography  2005  2040  Rent2040 Central Cities    29%  30%  65% Suburbs    49%  55%   30% Nonmetropolitan   22%  15%  25% Geography    Rent2005  Rent2040 Growth Central Cities    14m 30m 108% Suburbs    14m 26m   87% Nonmetropolitan    6m   6m   5% Source : Arthur C. Nelson, Presidential Professor and Director of Metropolitan Research, University of Utah.
Nonresidential Space 2005   35B Nonresidential Space 2040   50B Growth-related space   15B Rebuilt space   40B Total nonresidential constructed   55B Value     $7.0T Growth-related residential units    15m Rebuilt residential units   8m Total units built  23m Total residential construction   $9.0T Total construction (excl. infrastructure)   $16.0T Share of total US construction   50%

THE NEW URBANITY

  • 1.
    Arthur C. Nelson,Ph.D., FAICP Presidential Professor and Director of Metropolitan Research University of Utah University of Pennsylvania October 24, 2008
  • 2.
    Changing Demographic ProfileChanging Preferences Housing Tenure Changes Trends to Mid Century
  • 3.
    Percent of householdswith and without children, 1960, 2000, and 2040   Household Type 1960 2000 2040 HH with Children 48% 33% 26% HH w/o Children 52% 67% 74% Single/Other HH 13% 30% 34%
  • 4.
    Distribution of HouseholdGrowth by Type, 2000-2040 Household Type Growth Share Total Growth 54M With Children 7M 14% Without Children 47M 86% Single/Other 20M 38%
  • 5.
    Source: USCensus Bureau – 65+ in the United States: 2005; Wan He, Manisha Sengupta, Victoria A. Velkoff, & Kimberly A DeBarros. December 2005 .
  • 6.
    Source : National Association of Realtors, American Preference Survey 2004.
  • 7.
    Unit Type Share Attached 38% Apartments 14% Condos, Coops 9% Townhouses 15% Detached 62% Small Lot (<7,000 sf) 37% Large Lot (>7,000 sf) 25% Source : Low range of surveys reviewed by Arthur C. Nelson, “Planning for a New Era,” Journal of the American Planning Association , Fall 2006.
  • 8.
    Seniors who prefercity or close-in suburban location 51% (National Association of Realtors & Smart Growth America 2004 – pre meltdown) Households who prefer urban- related neighborhood attributes 33% (RCLCo controlled preference surveys 2005 – pre meltdown) Households who prefer urban- related neighborhood attributes 50% (Handy et al. JAPA 2008)
  • 9.
    Year Units Detached Share Own 2003 1,889 1,461 77% 67% 2004 2,052 1,596 78% 69% 2005 2,070 1,613 78% 69% 2006 2,155 1,682 78% 69% 2007 1,839 1,378 75% 68% Total 10,006 7,731 77% Ave. 2,001 1,546 77% 68% Source : Census data compiled by Arthur C. Nelson, Presidential Professor and Director of Metropolitan Research, University of Utah.
  • 10.
    Year Owner Reasons 1960 62% *Sub-prime fallout 1970 63% *Rising fuel prices 1980 64% *Rigorous underwriting 1990 65% - Private sector 2000 67% - New Fed oversight 2010 65% *Gen-X, Y, Z+ mobility pref. 2020 62% *Senior tenure shifts? 2030 60% *Stifled mortgage innovation 2040 60% *Rising urban land prices *Better investments alts.
  • 11.
    Dwellings 2005 2040 Change Share Occupied 109m 155m 46m Owner 75m 93m 18m 40% Renter 34m 62m 28m 60% Dwellings 2005 2020 Change Share Occupied 109m 127m 18m Owner 75m 80m 5m 28% Renter 34m 47m 13m 72%
  • 12.
    Geography 2005 2040 Rent2040 Central Cities 29% 30% 65% Suburbs 49% 55% 30% Nonmetropolitan 22% 15% 25% Geography Rent2005 Rent2040 Growth Central Cities 14m 30m 108% Suburbs 14m 26m 87% Nonmetropolitan 6m 6m 5% Source : Arthur C. Nelson, Presidential Professor and Director of Metropolitan Research, University of Utah.
  • 13.
    Nonresidential Space 2005 35B Nonresidential Space 2040 50B Growth-related space 15B Rebuilt space 40B Total nonresidential constructed 55B Value $7.0T Growth-related residential units 15m Rebuilt residential units 8m Total units built 23m Total residential construction $9.0T Total construction (excl. infrastructure) $16.0T Share of total US construction 50%

Editor's Notes

  • #6 Arthur C. Nelson, Presidential Professor, Utah
  • #7 Dr. Arthur C. Nelson, FAICP. See Use, and Disclaimer and Limited Liability slide.