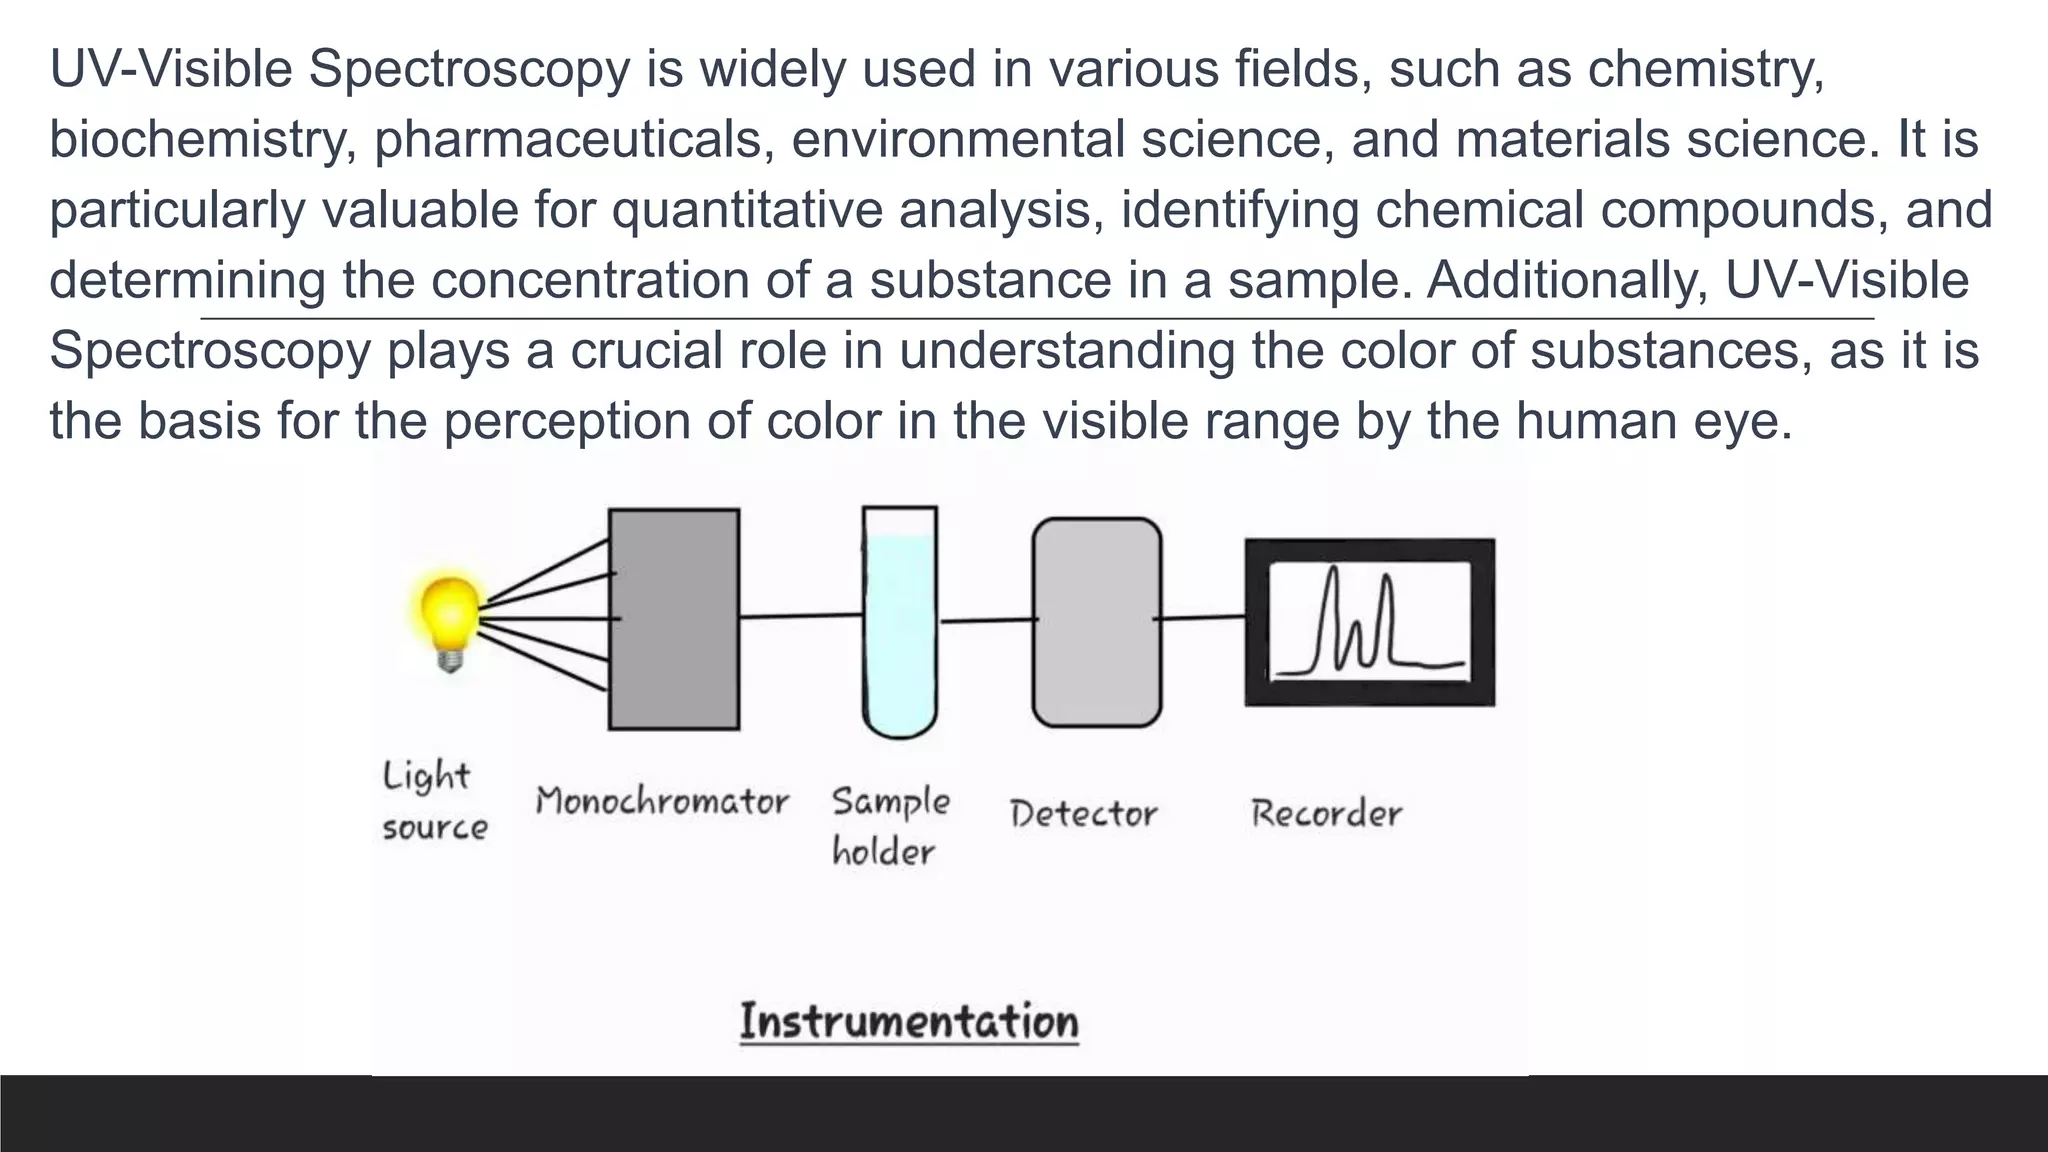
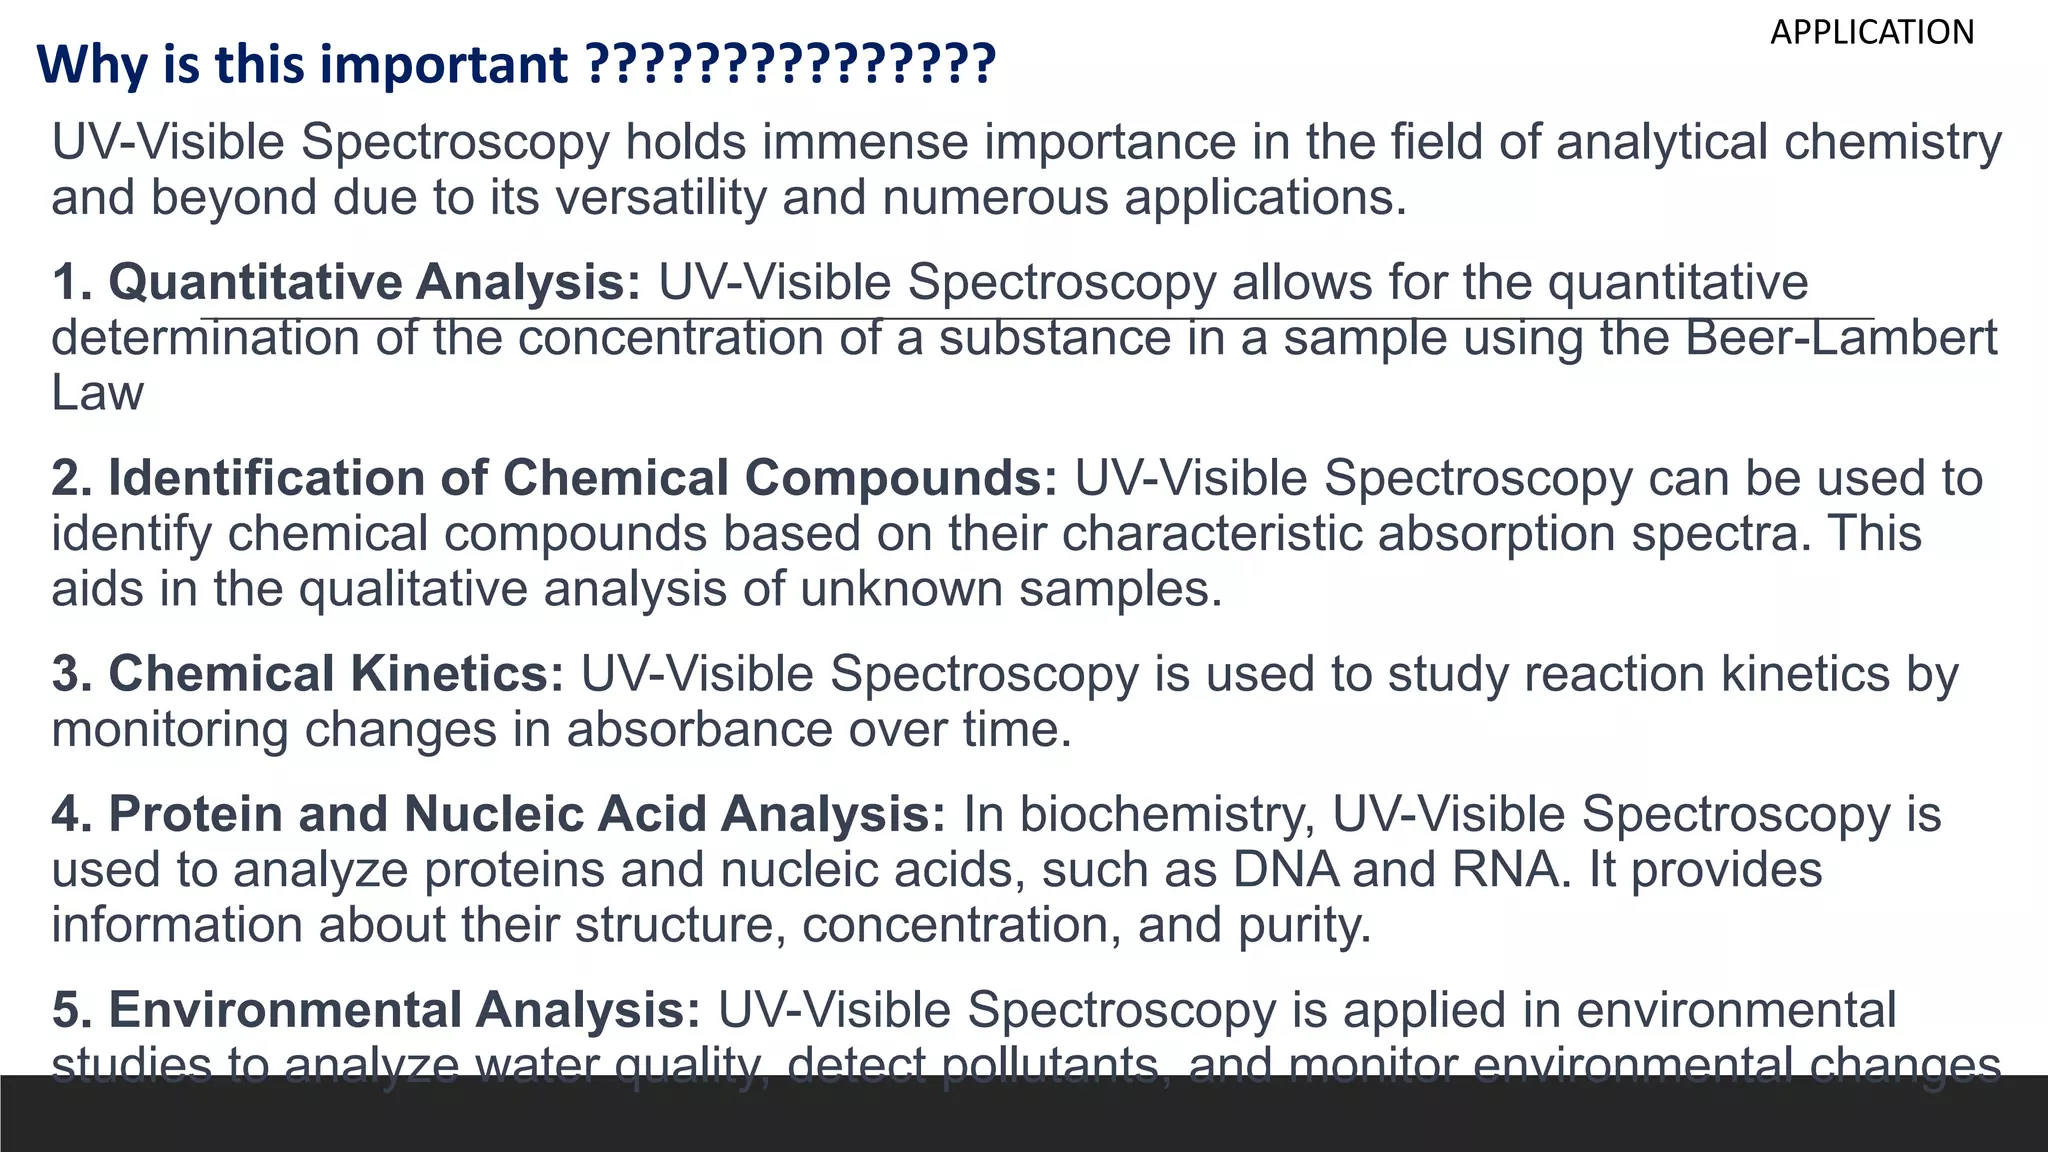
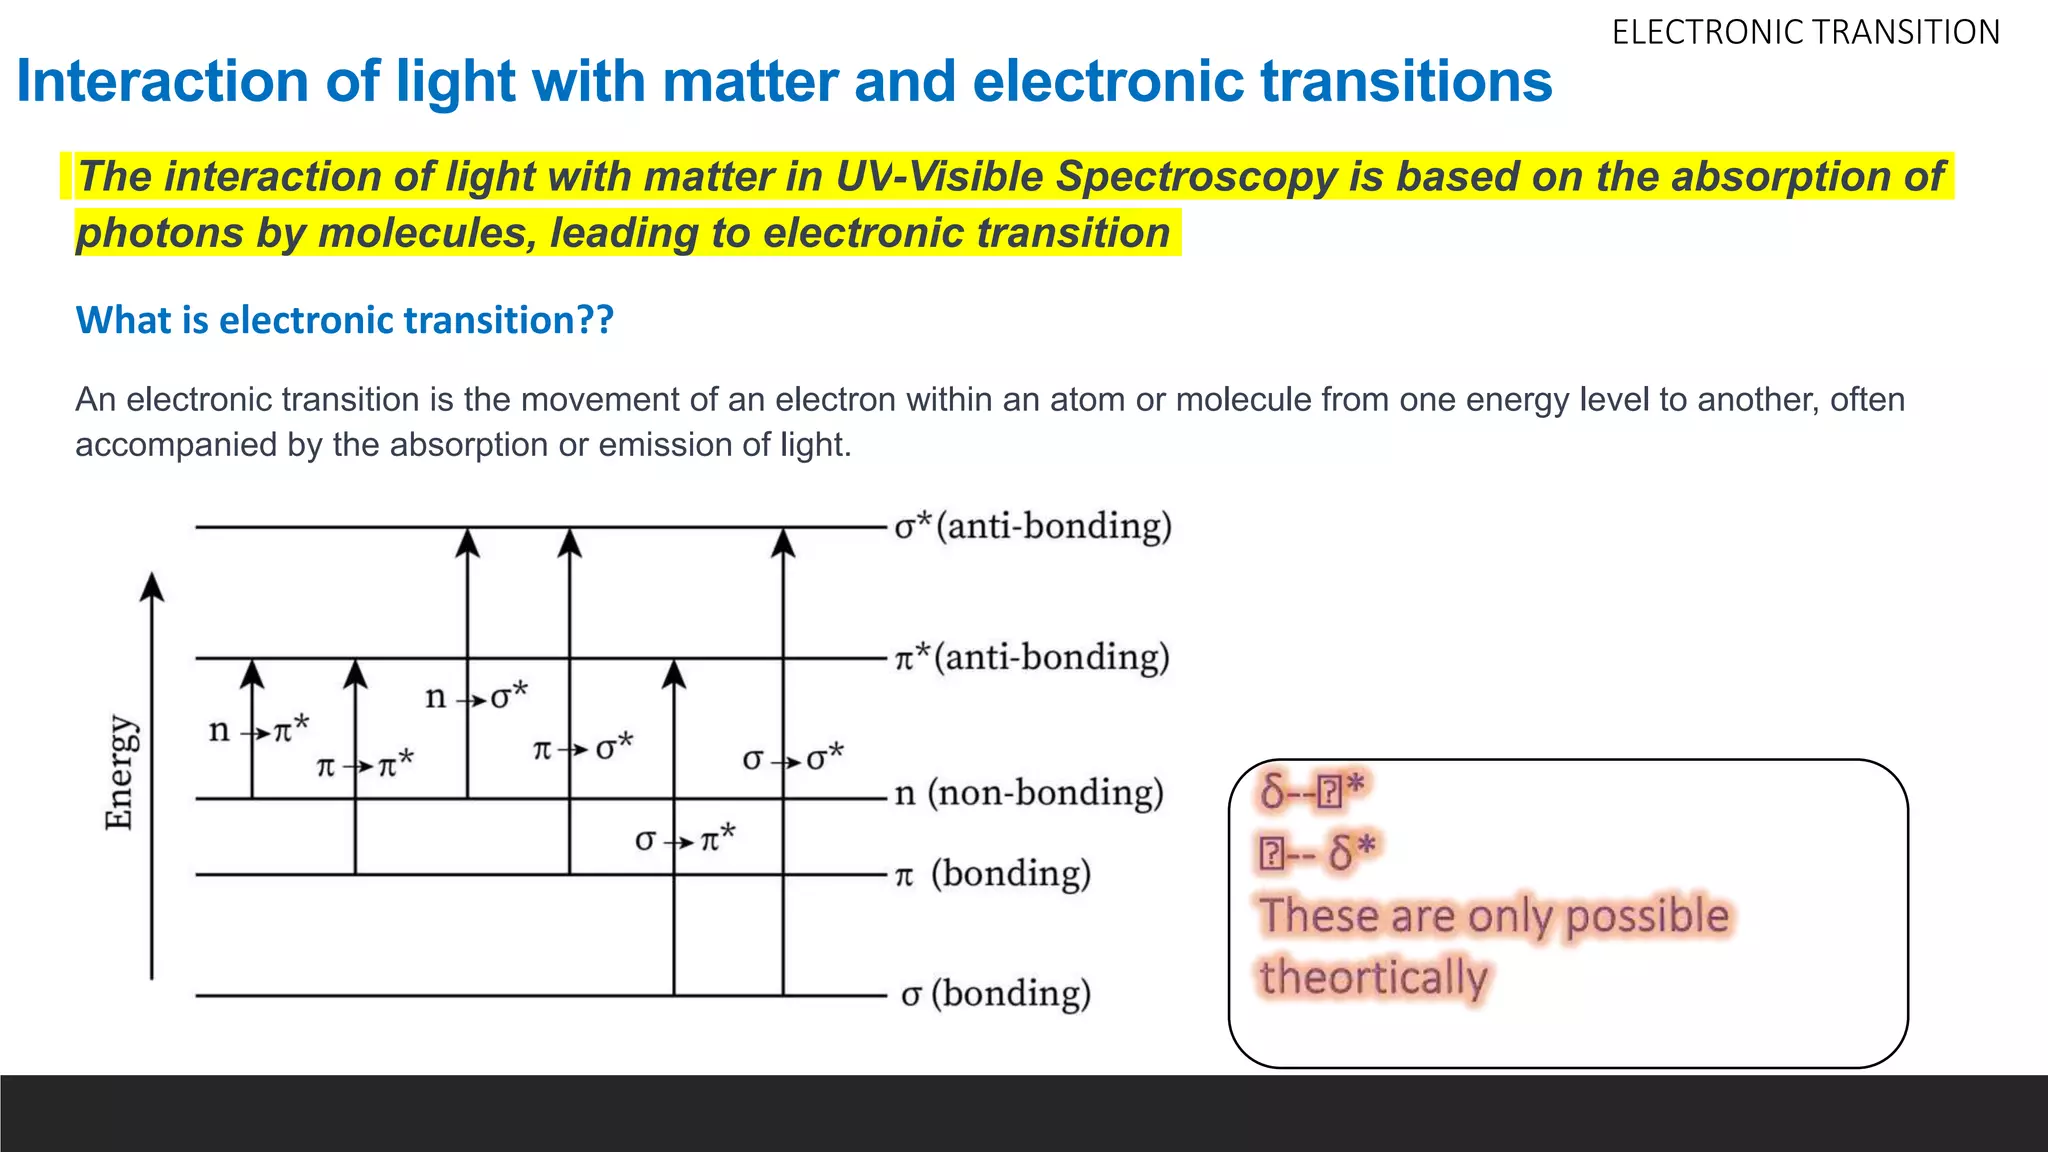
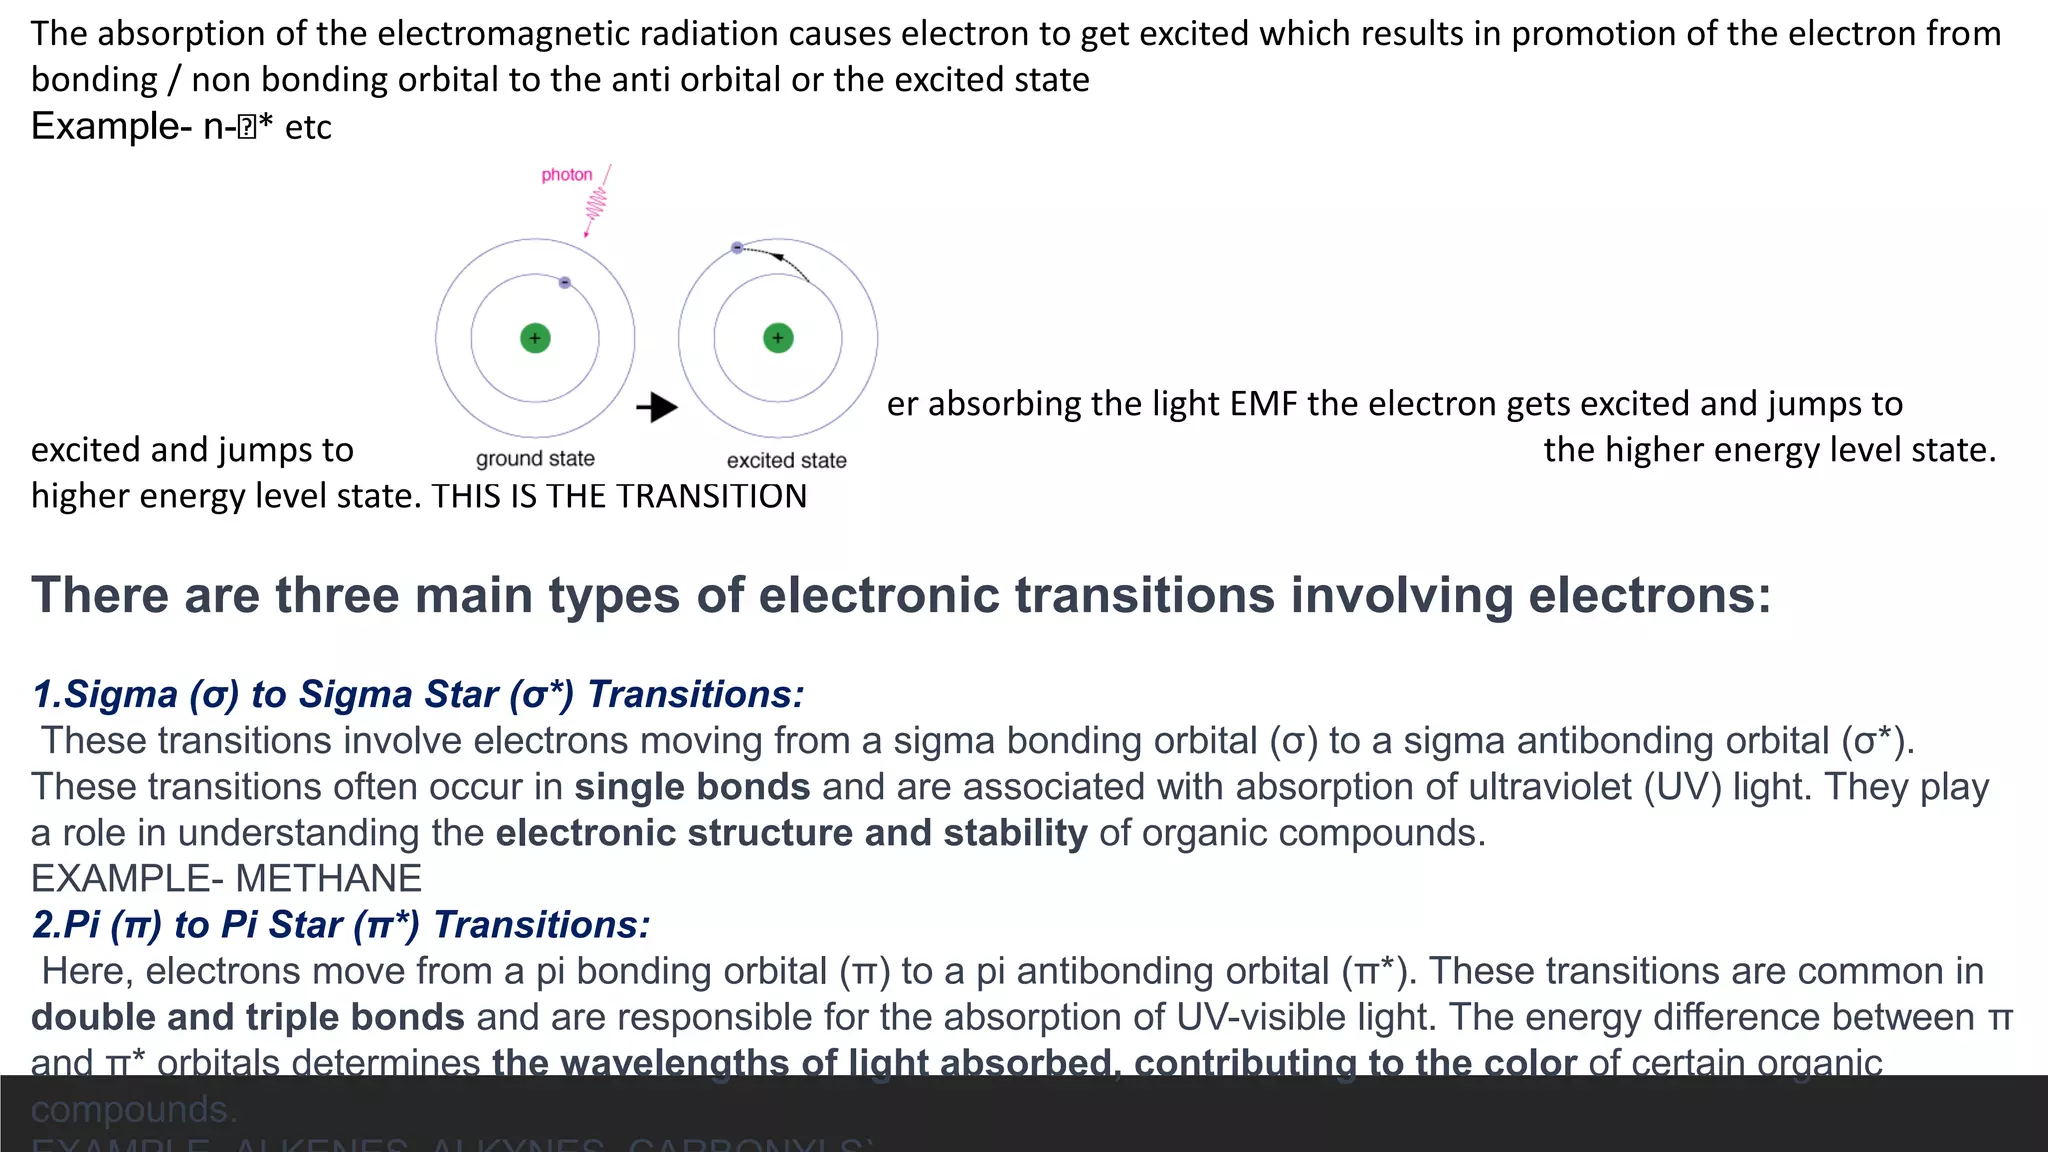
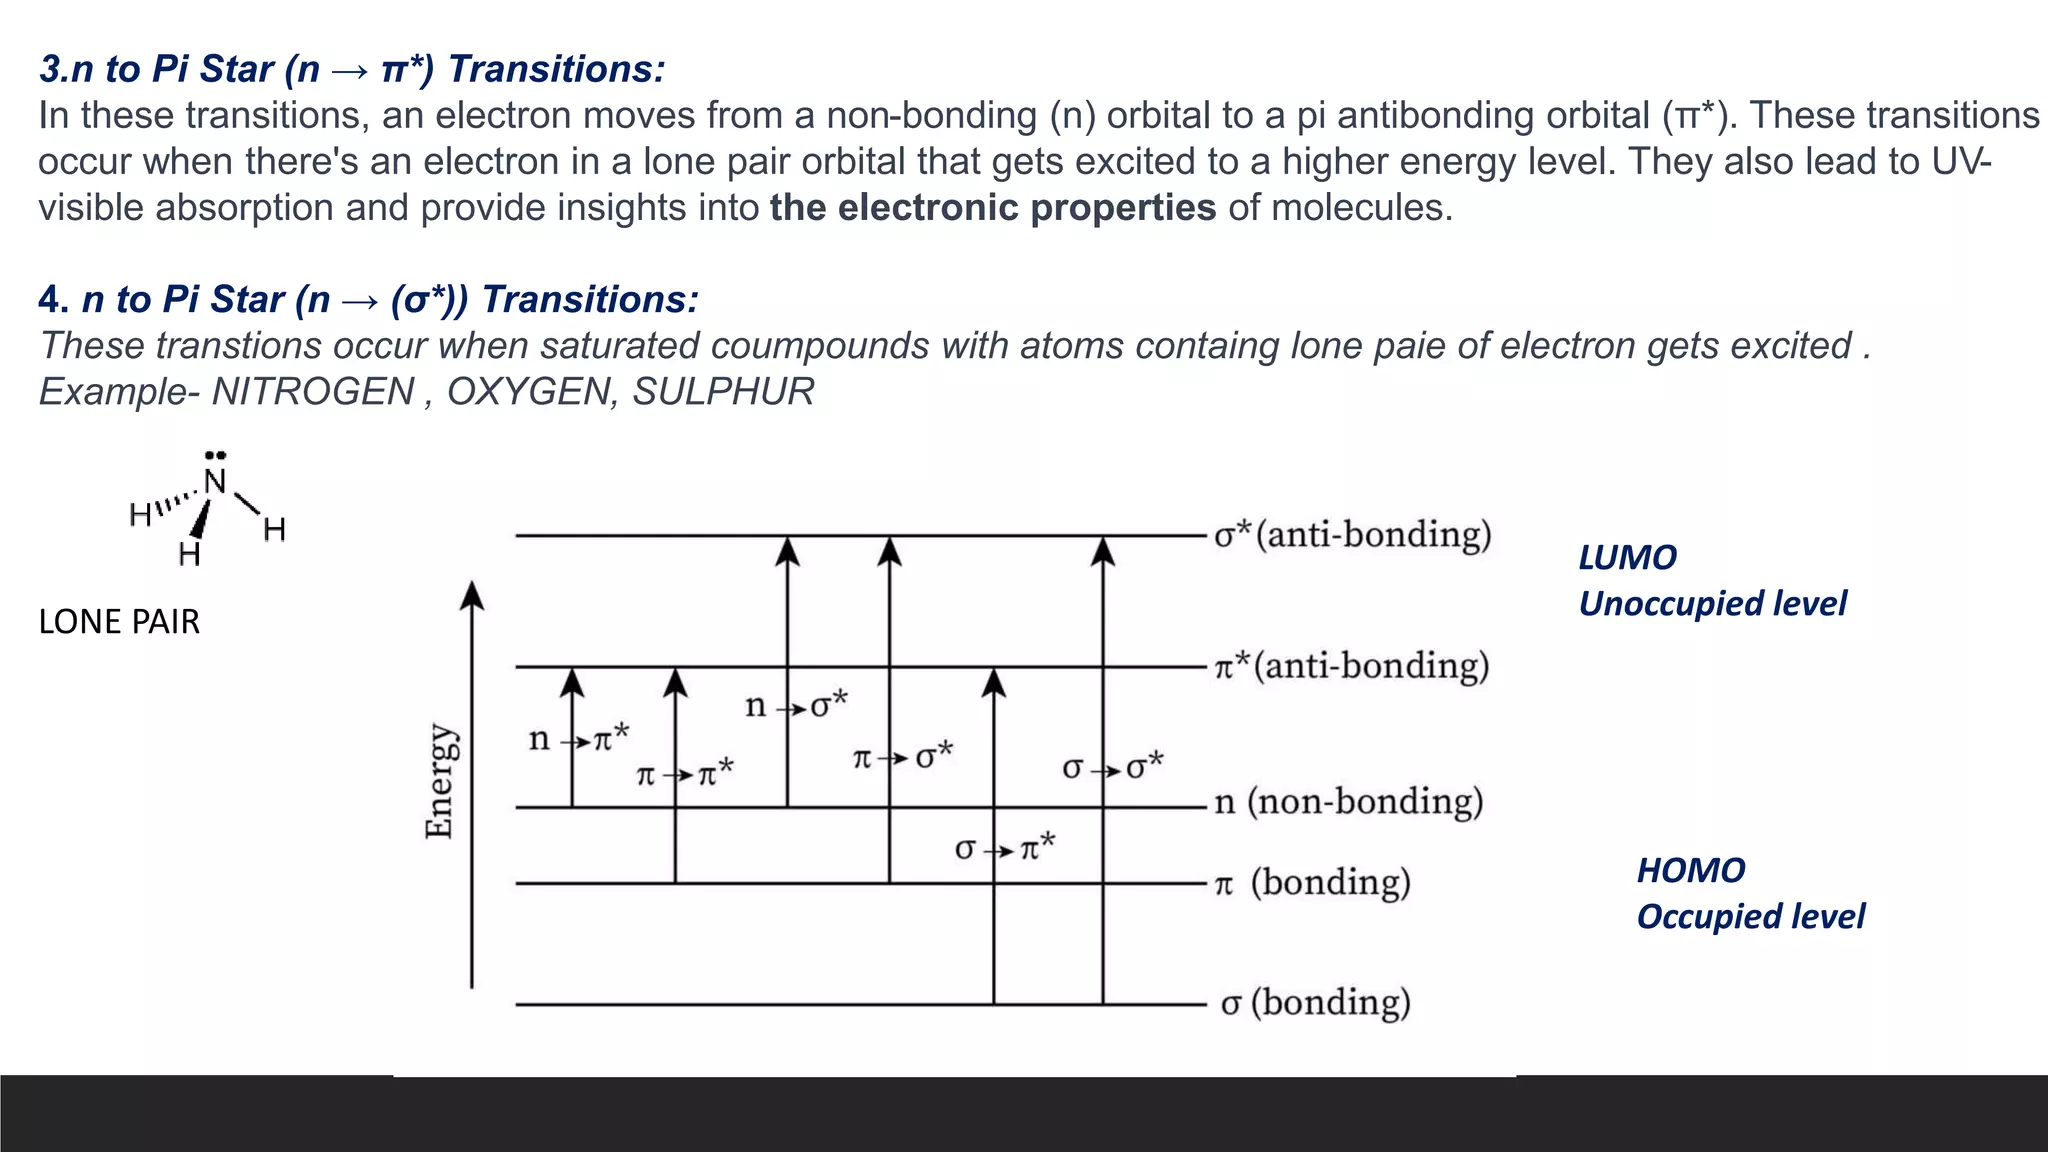
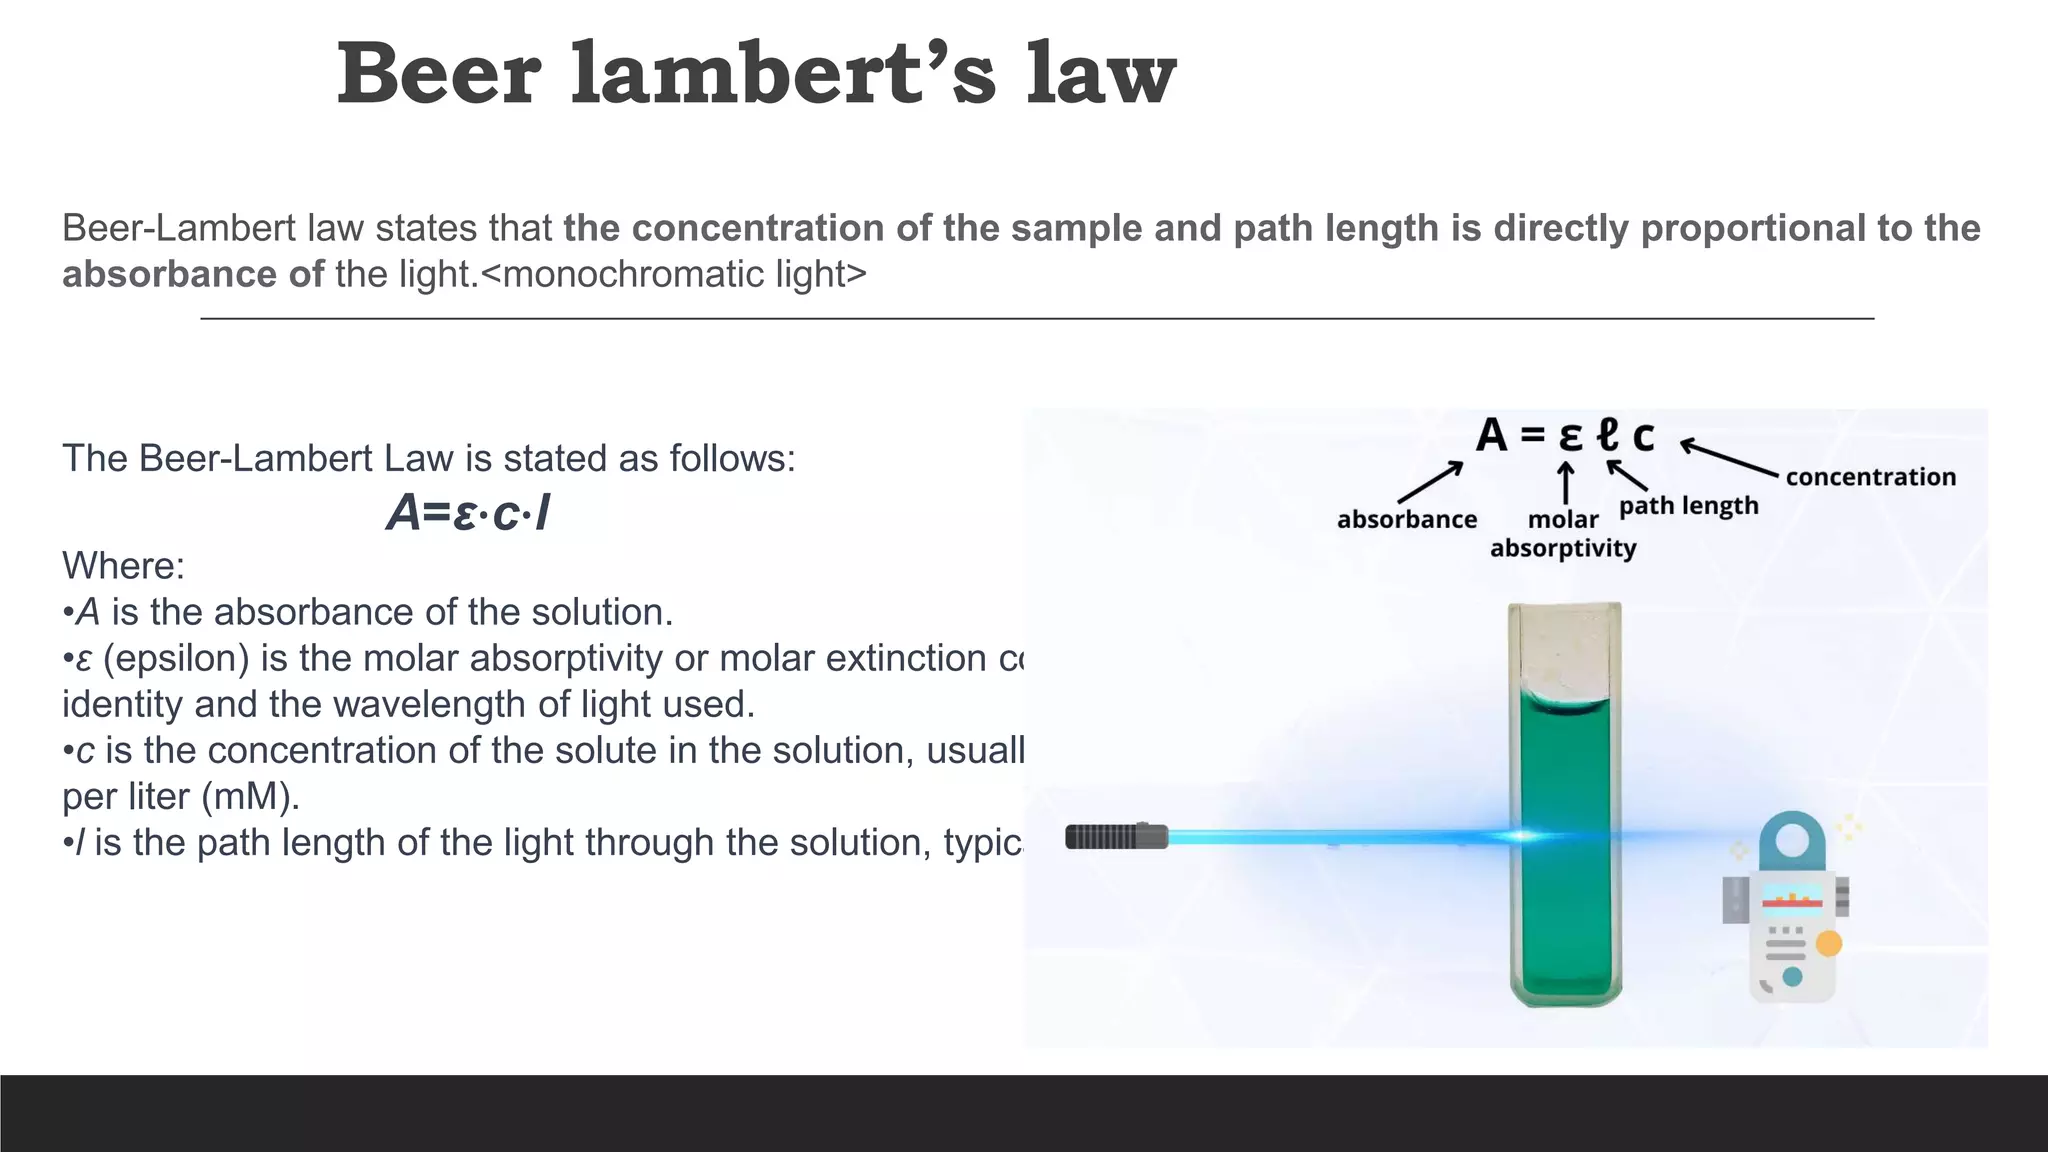
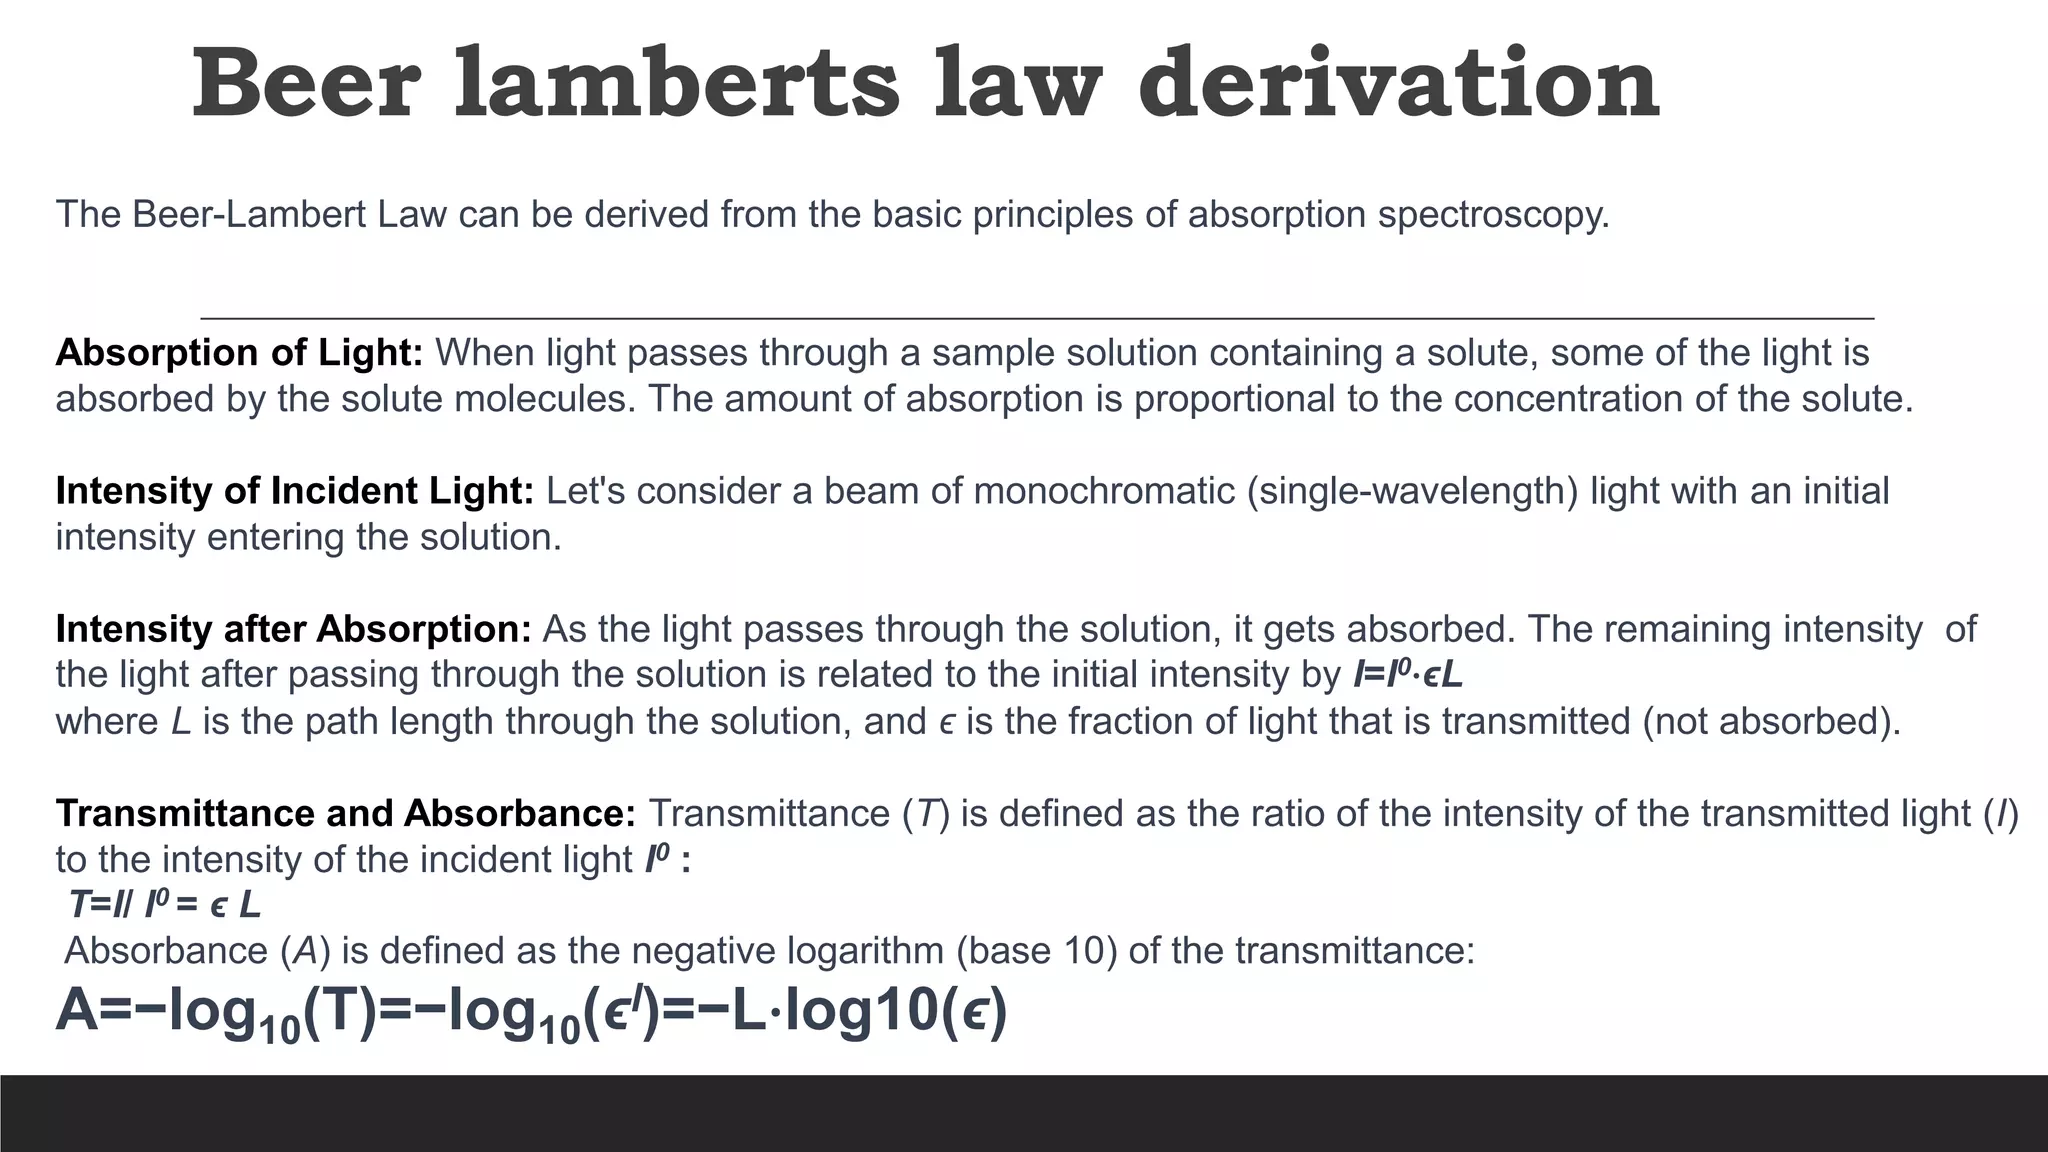
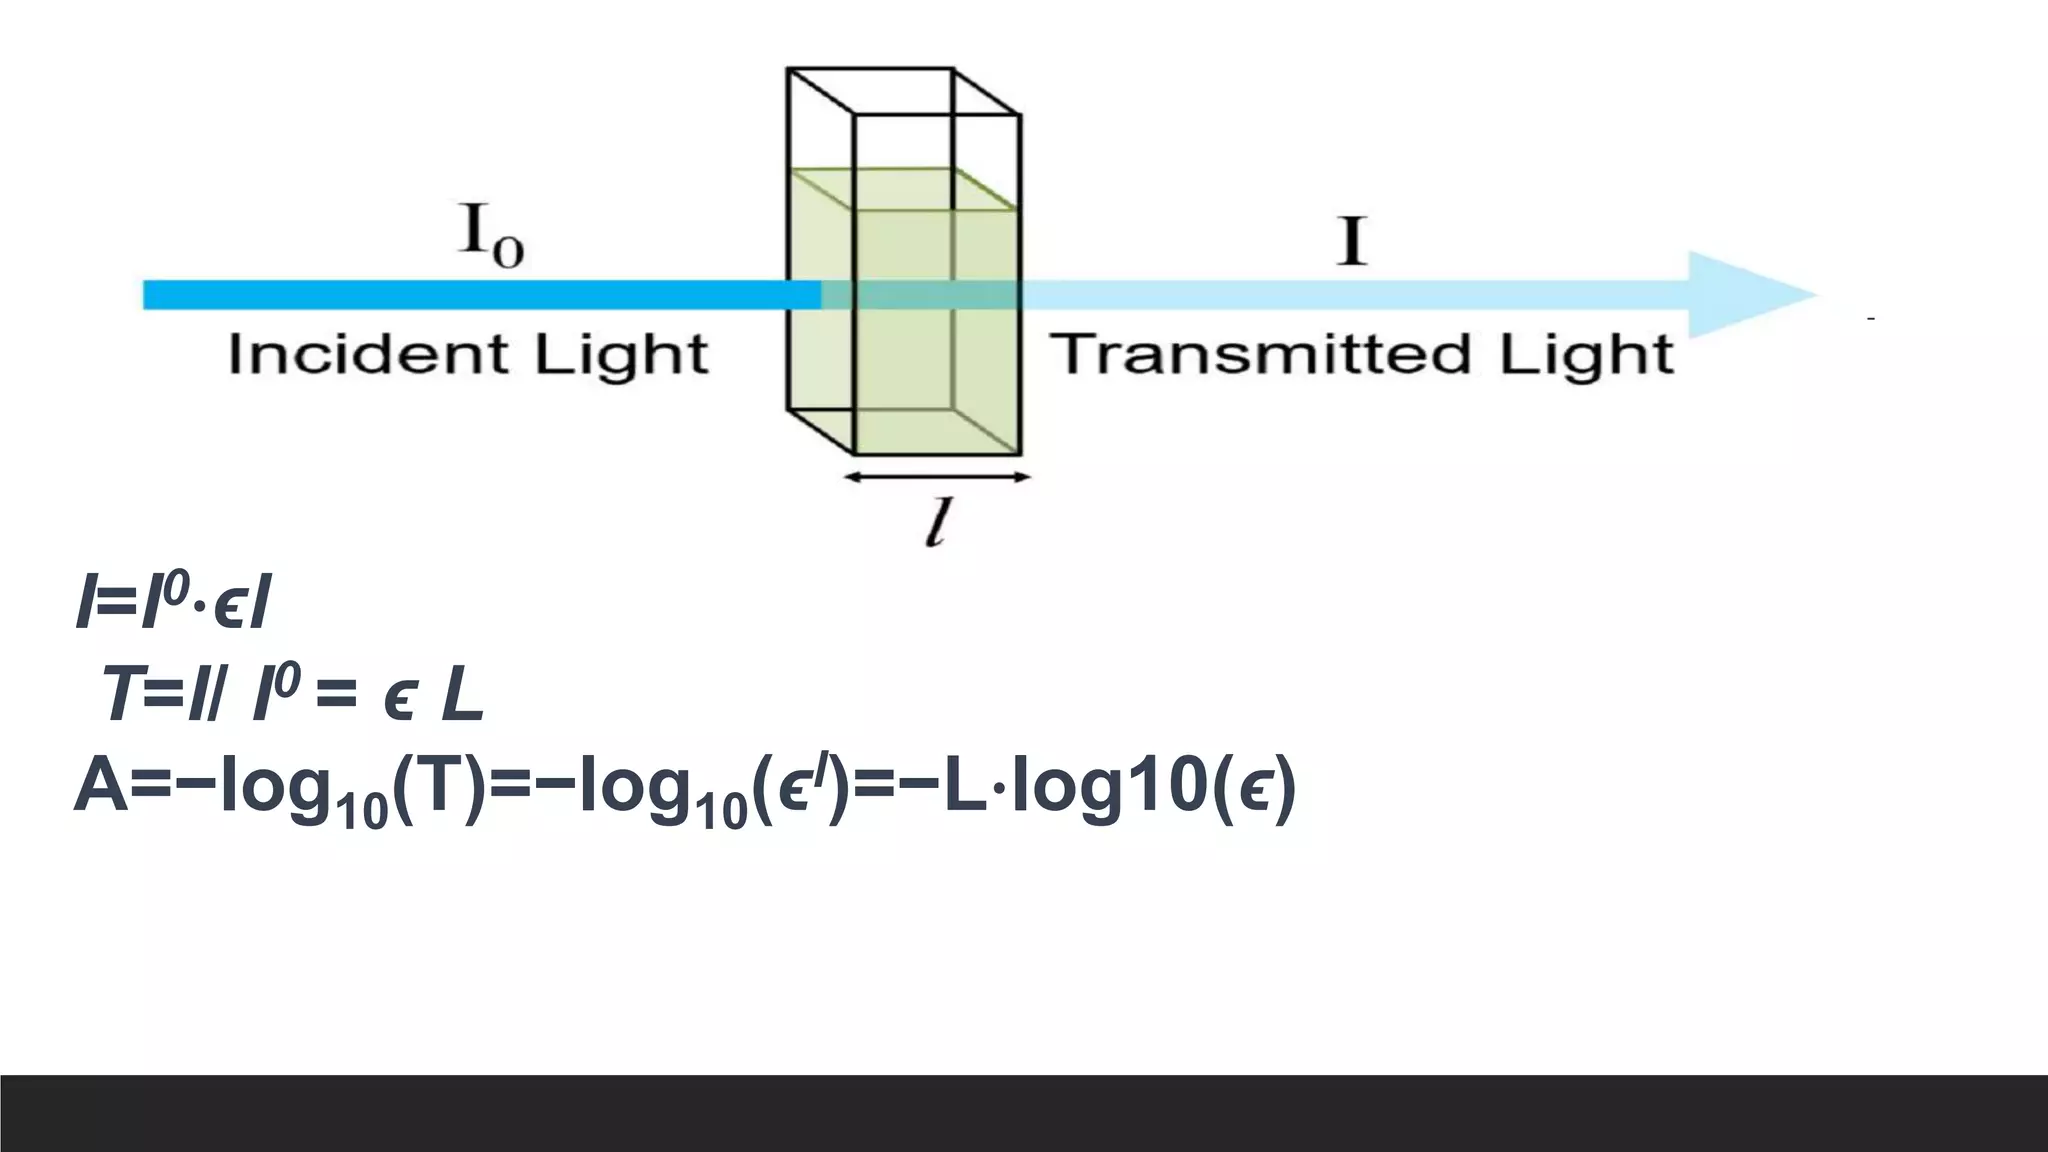
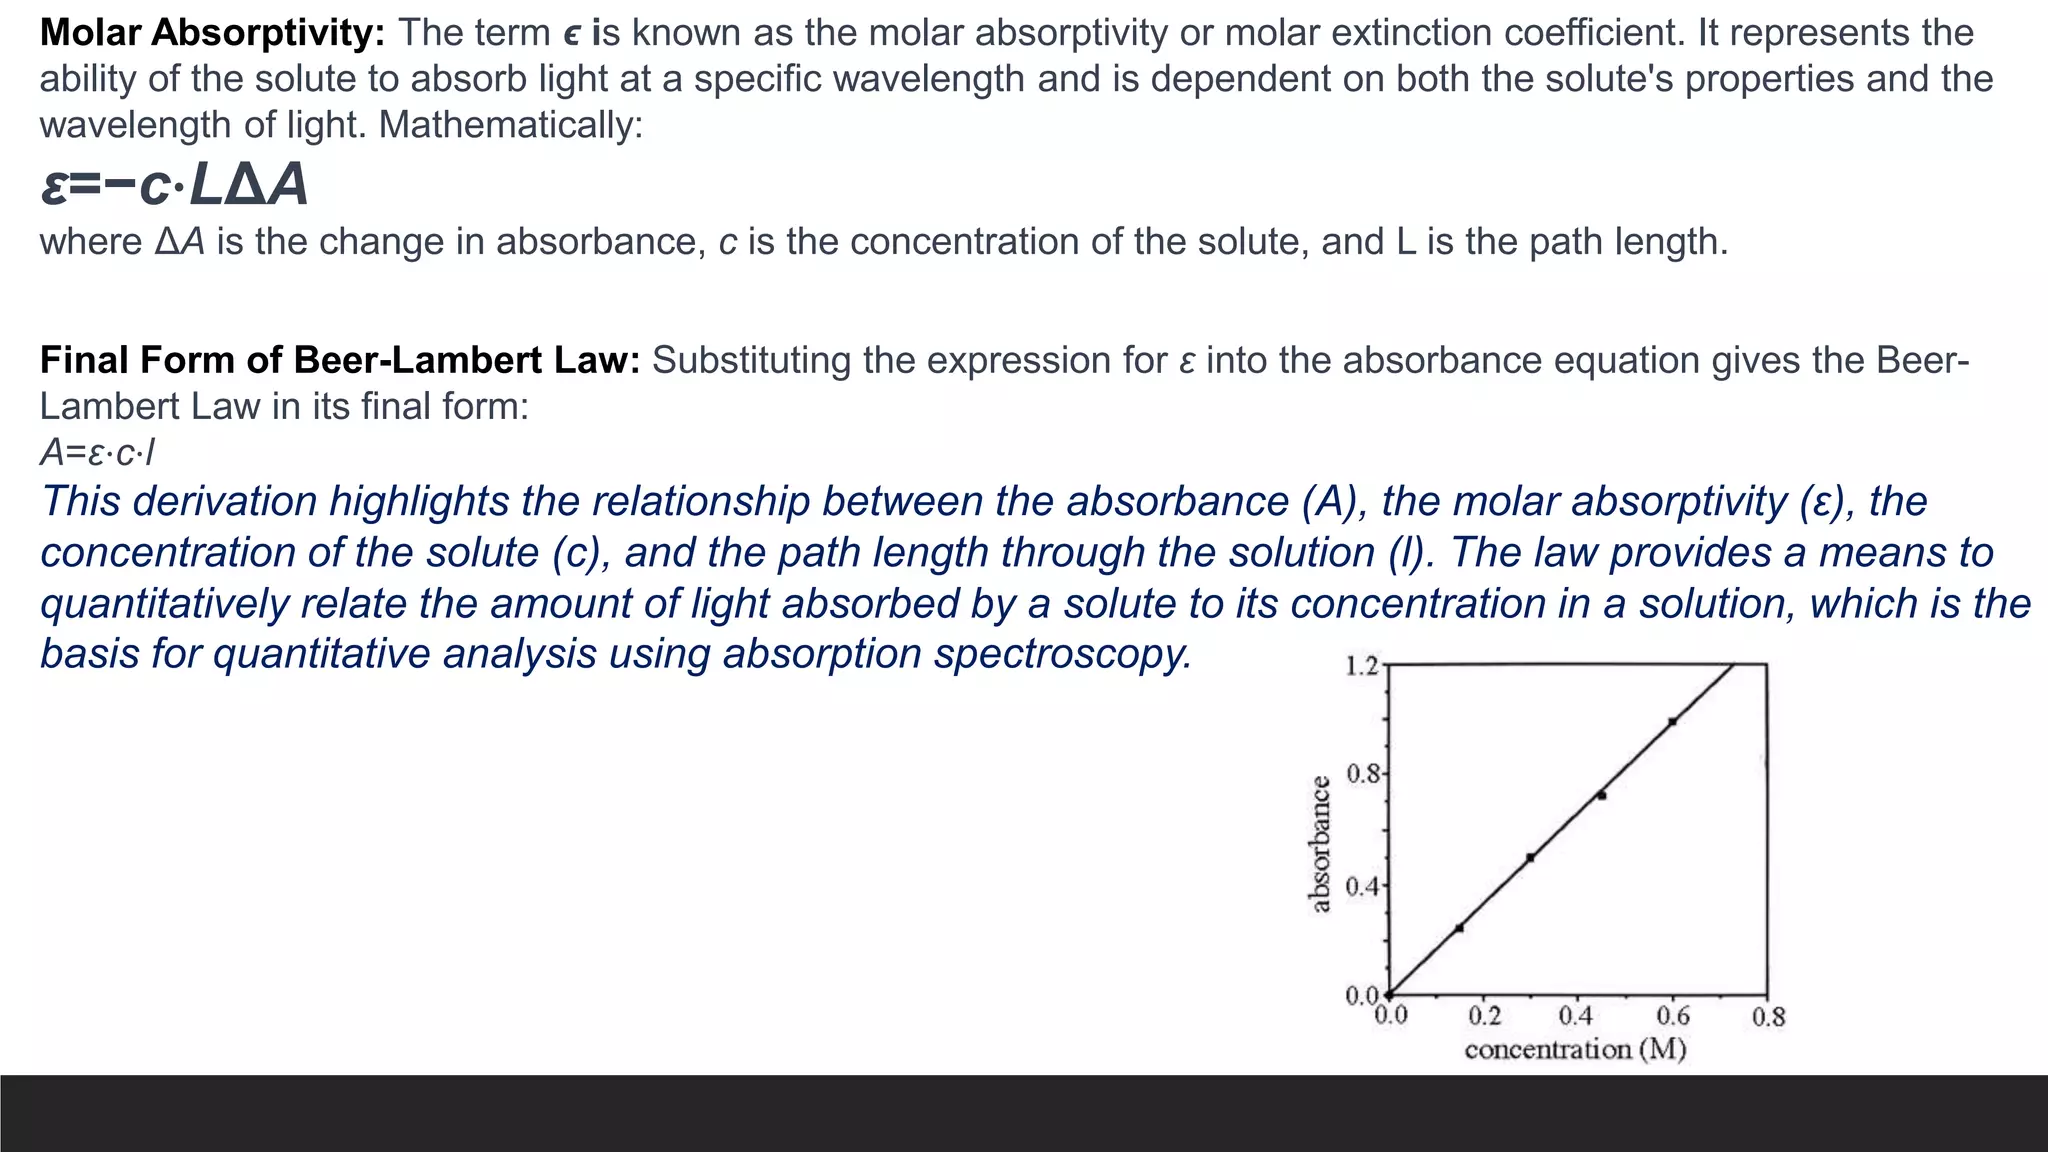
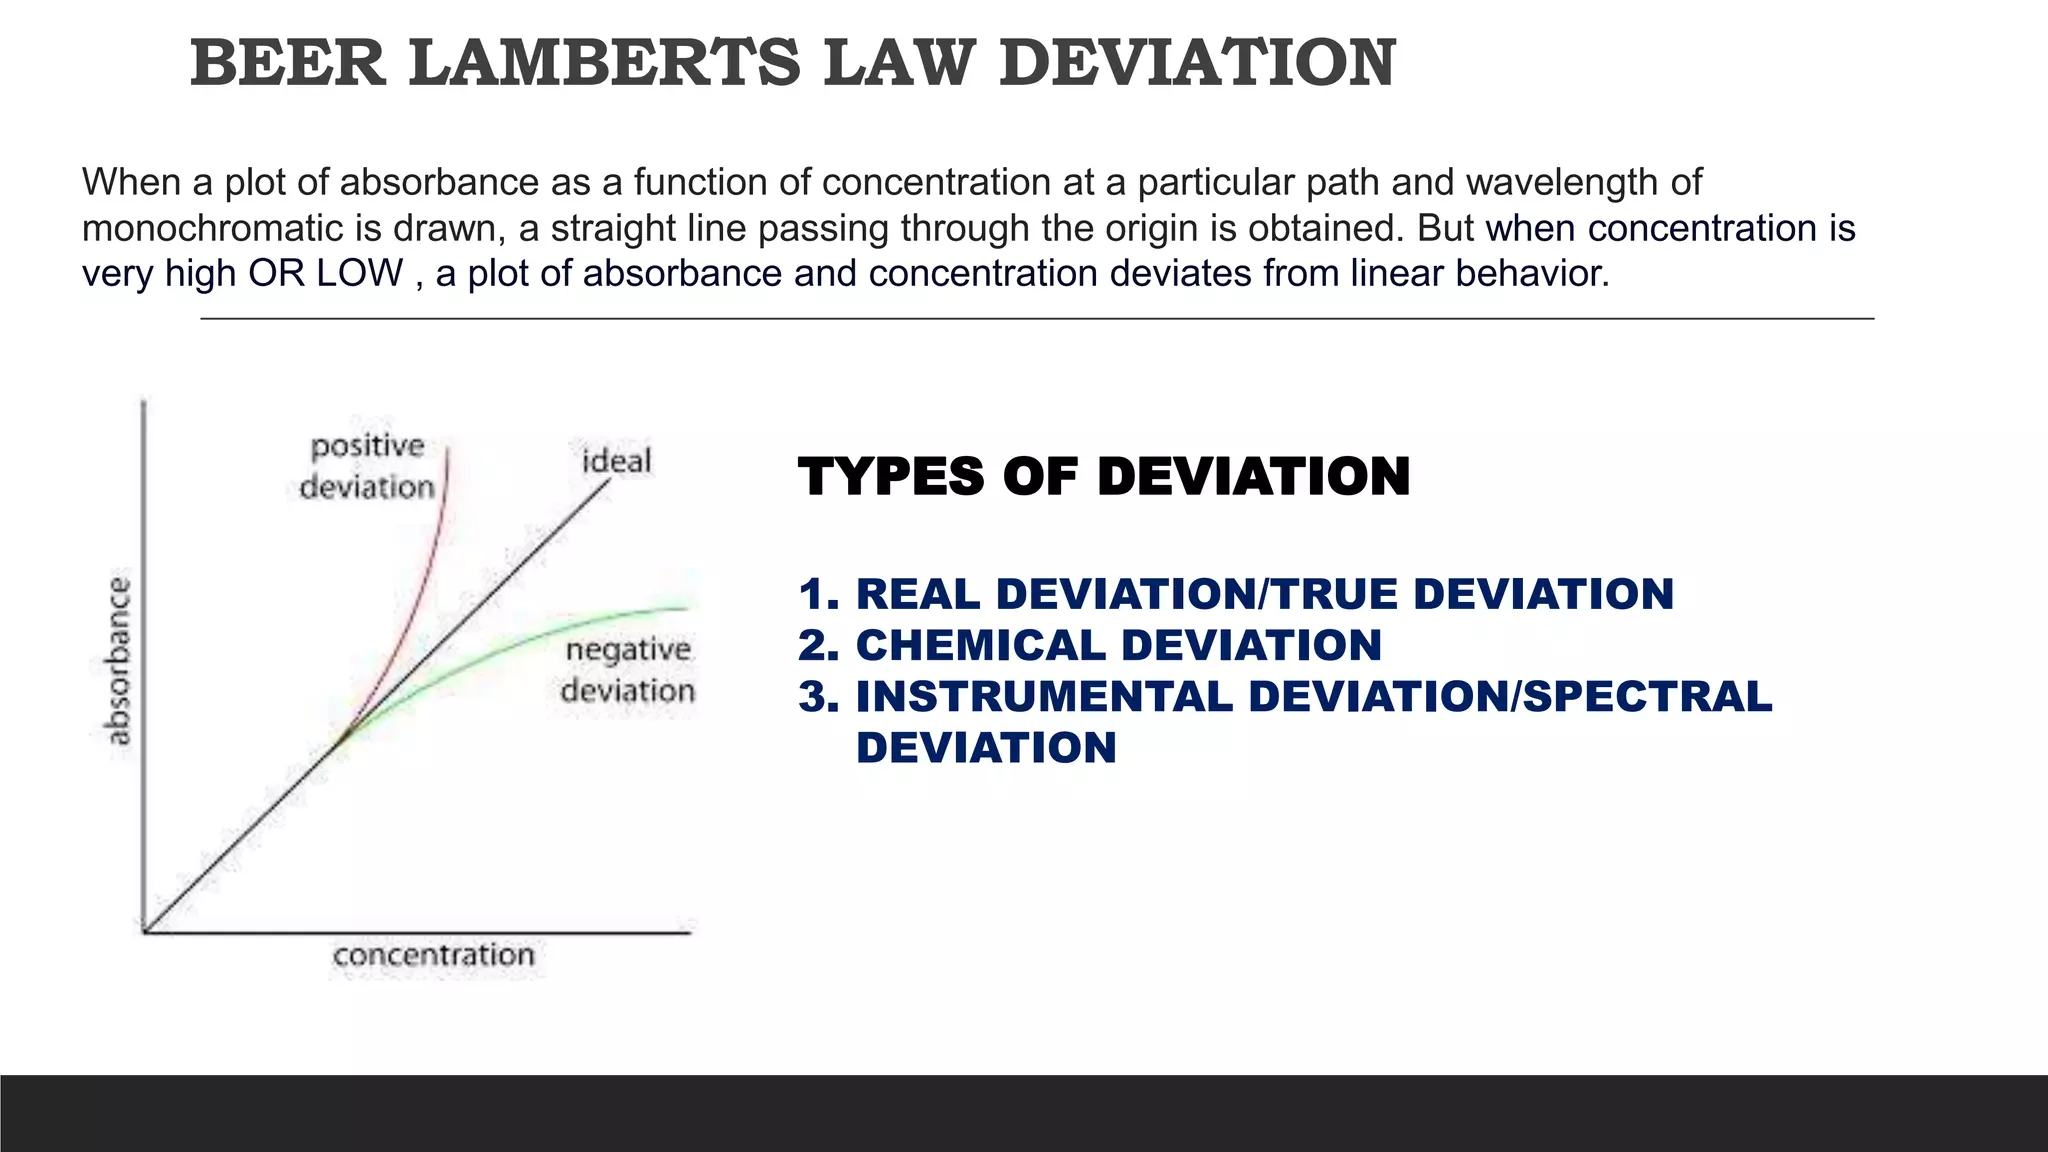
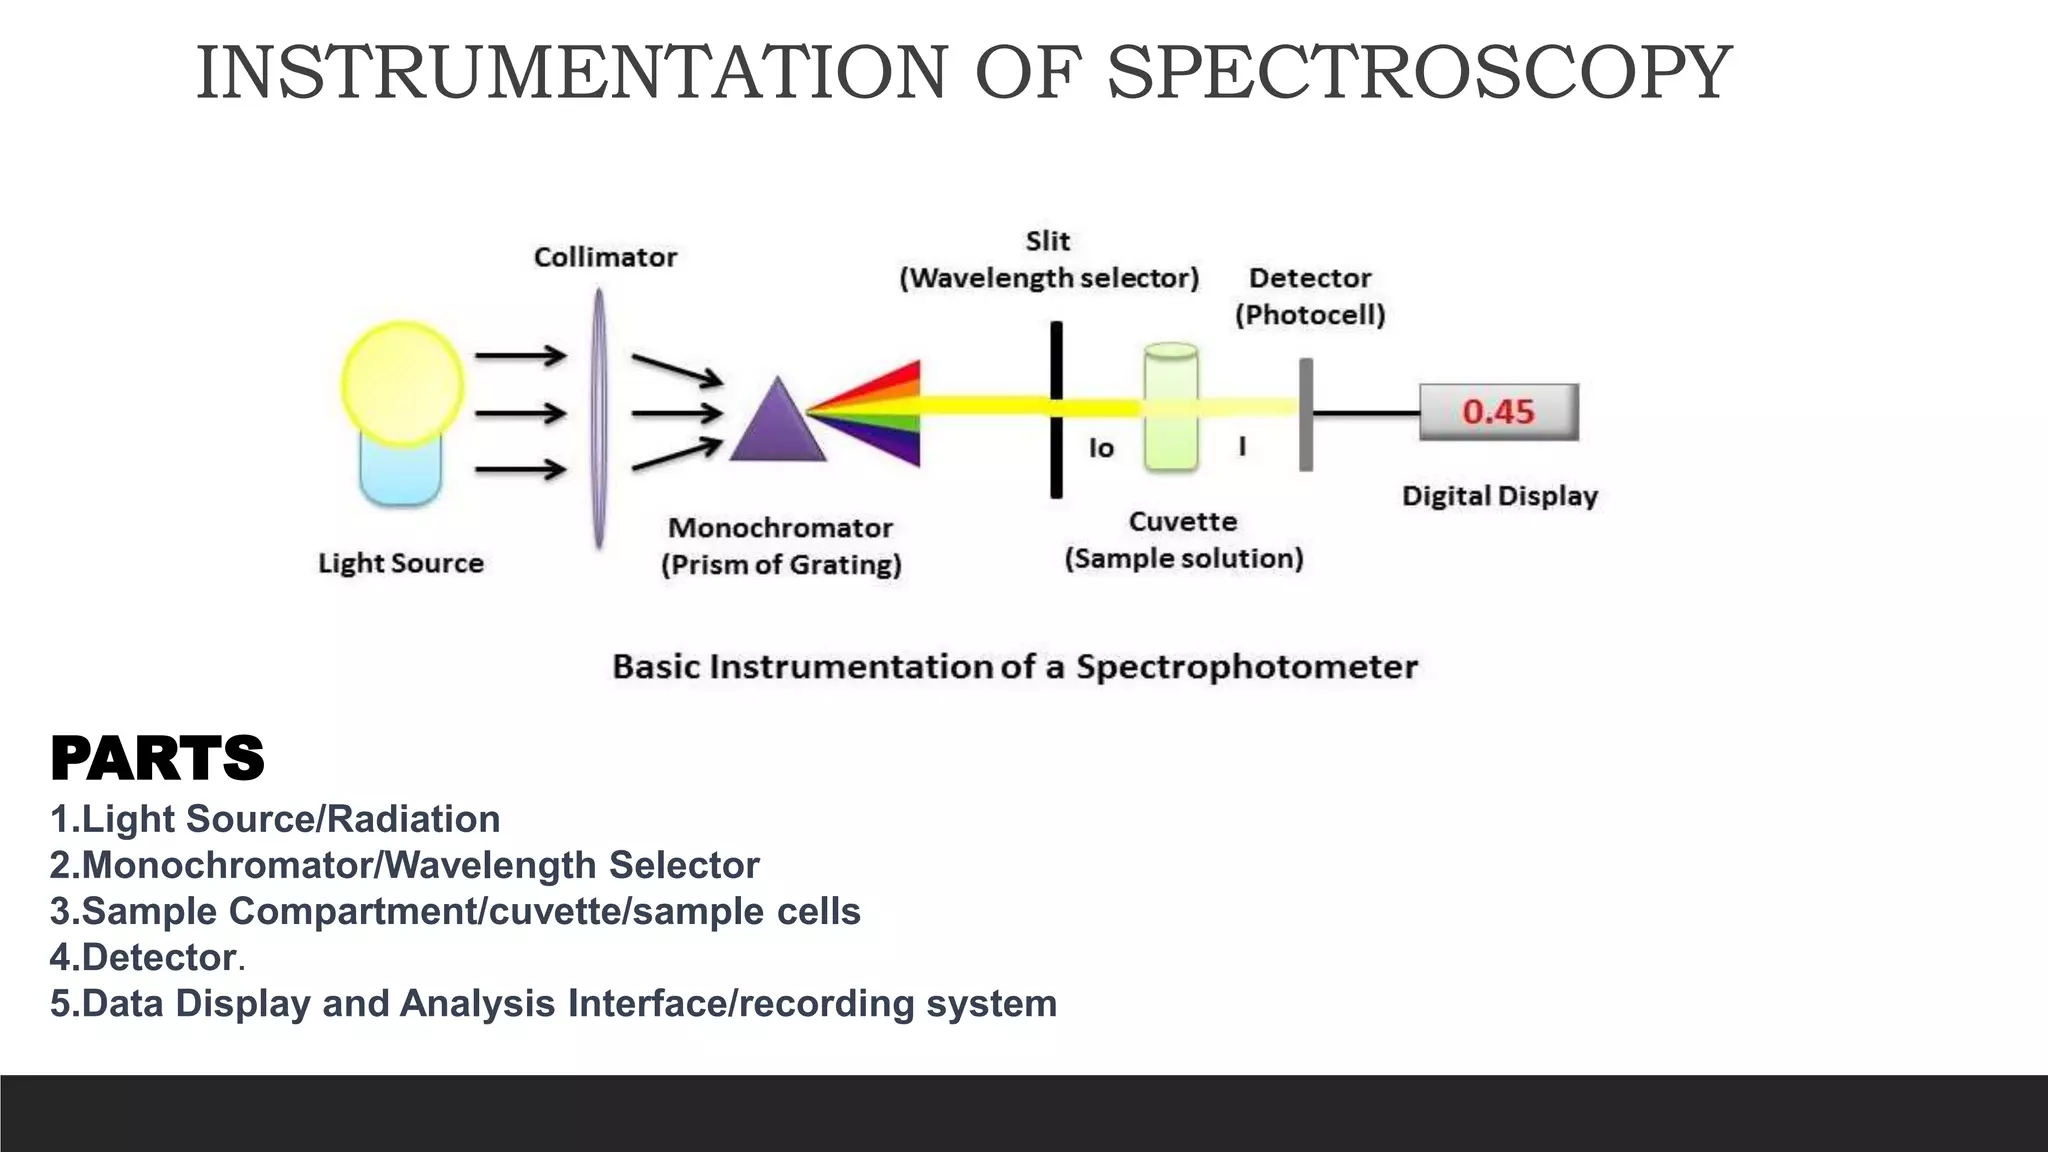
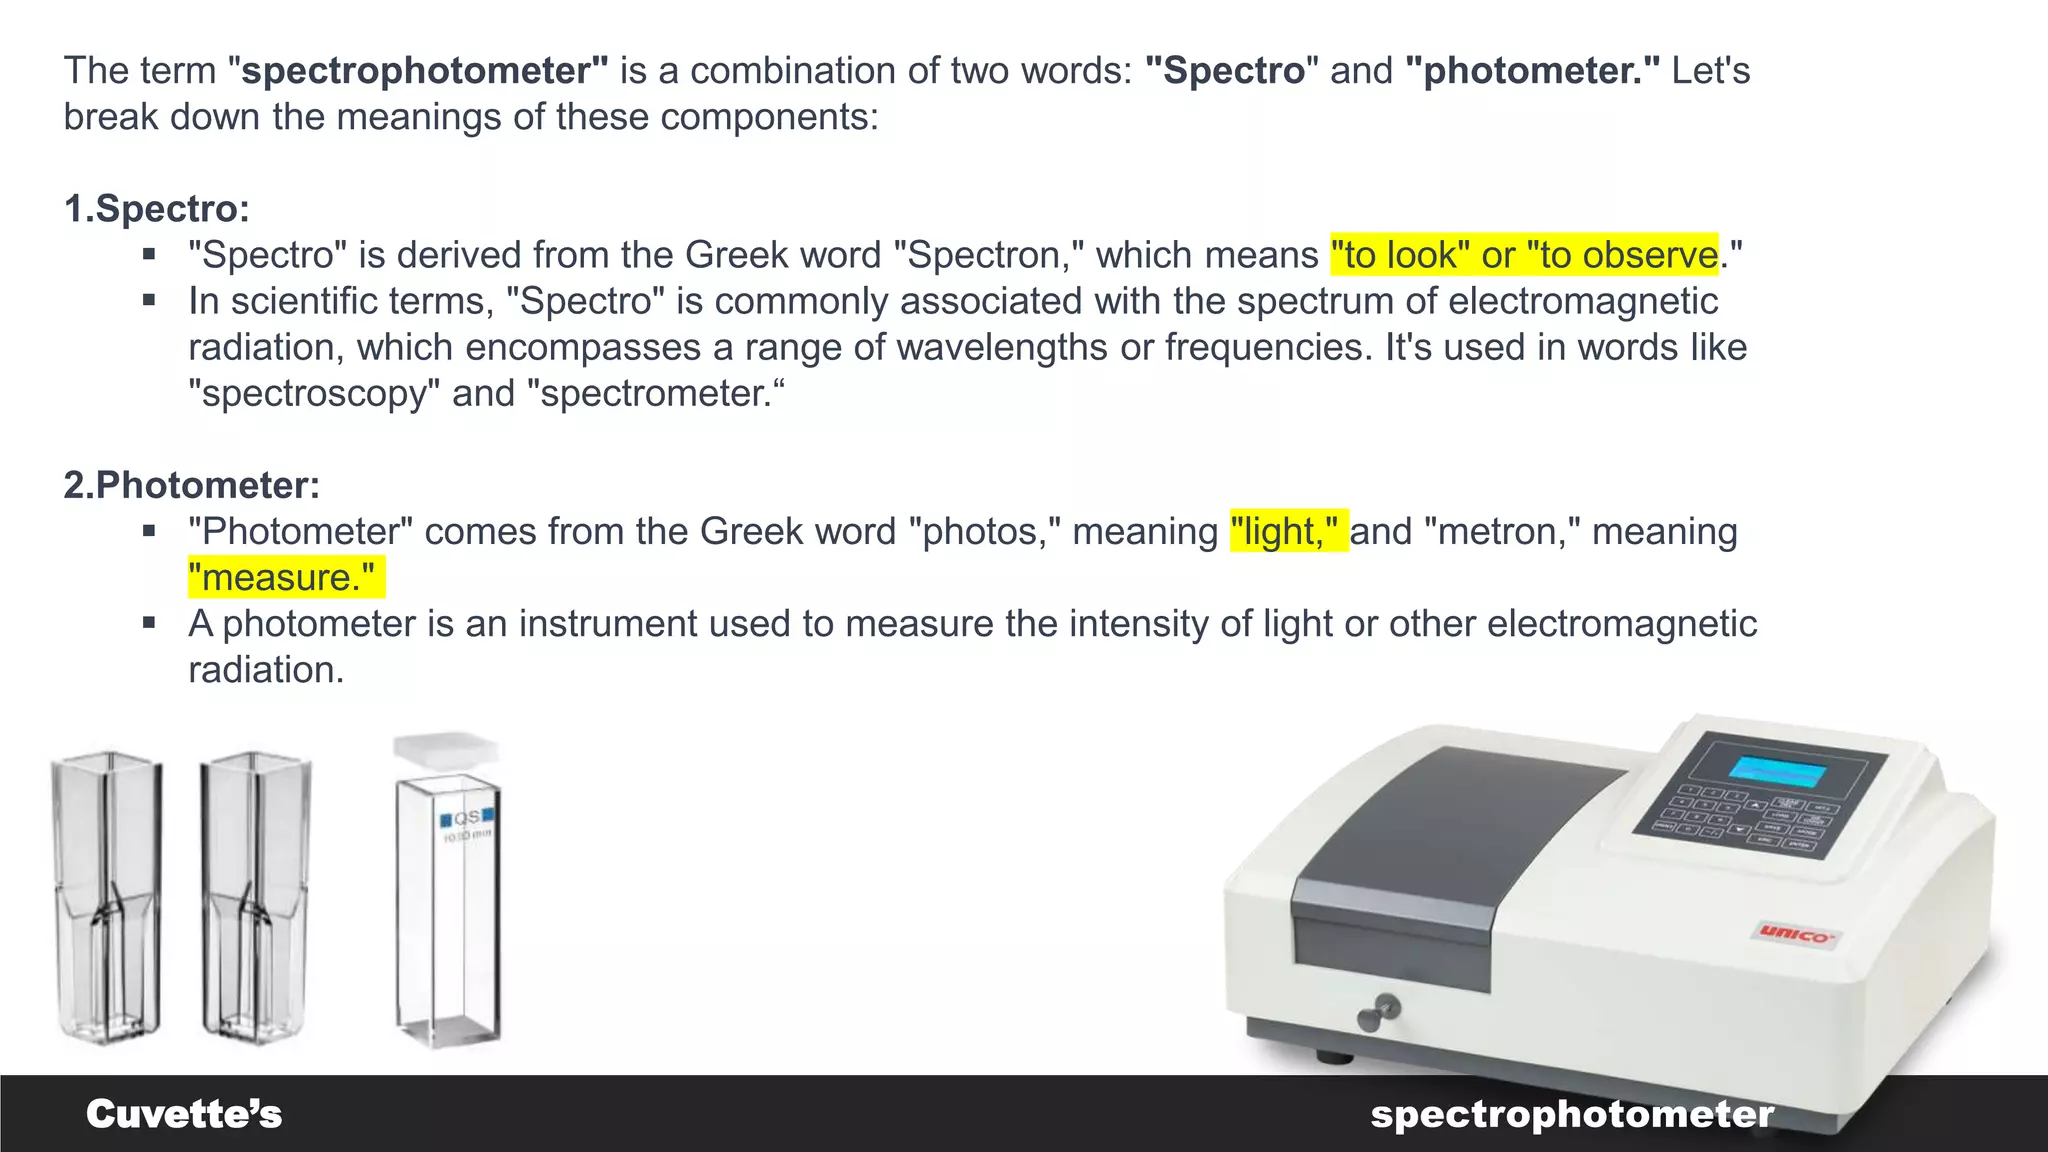
UV-Visible Spectroscopy is a technique that uses light in the UV and visible range to analyze molecules. It works by measuring how much light a sample absorbs or transmits at different wavelengths. Electronic transitions within molecules correspond to specific absorbed wavelengths. A spectrophotometer generates light that passes through a sample, and the amount of light absorbed provides information about the sample's structure and composition. The Beer-Lambert law quantitatively relates absorbance to concentration and path length. UV-Vis spectroscopy has many applications in fields like chemistry, biochemistry, pharmaceuticals and more.
2. • UV-Visible Spectroscopy is a analytical technique used to study the interaction of light with
matter. It involves the measurement of the absorption or transmission of ultraviolet (UV) and
visible (Visible) light by molecules in a sample. When light passes through a sample, some
wavelengths are absorbed by the molecules present in the sample, while others are
transmitted. The absorbed wavelengths correspond to specific energy transitions
within the molecules.
In this technique, a spectrophotometer is used to generate a beam of UV or visible light,
which is then passed through the sample. The amount of light absorbed by the molecules in
the sample is detected and measured. The resulting absorption spectrum provides valuable
information about the electronic structure of the molecules, including their energy levels and
electronic transitions that are transmitted. The absorbed wavelengths correspond to specific
energy transitions within the molecules.
WHAT UV-VISIBLE SPECTROSCOPY IS?
INTRODUCTION
3. UV-Visible Spectroscopy is widely used in various fields, such as chemistry,
biochemistry, pharmaceuticals, environmental science, and materials science. It is
particularly valuable for quantitative analysis, identifying chemical compounds, and
determining the concentration of a substance in a sample. Additionally, UV-Visible
Spectroscopy plays a crucial role in understanding the color of substances, as it is
the basis for the perception of color in the visible range by the human eye.
4. UV-Visible Spectroscopy holds immense importance in the field of analytical chemistry
and beyond due to its versatility and numerous applications.
1. Quantitative Analysis: UV-Visible Spectroscopy allows for the quantitative
determination of the concentration of a substance in a sample using the Beer-Lambert
Law
2. Identification of Chemical Compounds: UV-Visible Spectroscopy can be used to
identify chemical compounds based on their characteristic absorption spectra. This
aids in the qualitative analysis of unknown samples.
3. Chemical Kinetics: UV-Visible Spectroscopy is used to study reaction kinetics by
monitoring changes in absorbance over time.
4. Protein and Nucleic Acid Analysis: In biochemistry, UV-Visible Spectroscopy is
used to analyze proteins and nucleic acids, such as DNA and RNA. It provides
information about their structure, concentration, and purity.
5. Environmental Analysis: UV-Visible Spectroscopy is applied in environmental
studies to analyze water quality, detect pollutants, and monitor environmental changes
Why is this important ???????????????
APPLICATION
5. 6. Color Analysis and Dye Chemistry: UV-Visible Spectroscopy is essential in the study of dyes and
pigments. It helps determine the color characteristics and stability of dyes used in textiles, paints, and other
industries.
7. Pharmaceutical Formulation Development: In the pharmaceutical industry, UV-Visible Spectroscopy
is used to develop and optimize drug formulations. It enables the quantification of active pharmaceutical
ingredients and their degradation products.
8. Material Science and Nanotechnology: UV-Visible Spectroscopy is employed to study the electronic
and optical properties of materials, including nanoparticles and thin films. It aids in the characterization of
nanomaterials and their applications in various fields.
9. Life Sciences Research: UV-Visible Spectroscopy is widely used in life sciences research
10. Educational and Research Tool: UV-Visible Spectroscopy serves as a valuable educational tool for
teaching fundamental principles of molecular absorption and spectroscopic analysis. It also provides a
foundation for research in various scientific disciplines.
6. Interaction of light with matter and electronic transitions
The interaction of light with matter in UV-Visible Spectroscopy is based on the absorption of
photons by molecules, leading to electronic transition
What is electronic transition??
An electronic transition is the movement of an electron within an atom or molecule from one energy level to another, often
accompanied by the absorption or emission of light.
ELECTRONIC TRANSITION
7. The absorption of the electromagnetic radiation causes electron to get excited which results in promotion of the electron from
bonding / non bonding orbital to the anti orbital or the excited state
Example- n- * etc
After absorbing the light EMF the electron gets excited and jumps to
excited and jumps to . the higher energy level state.
higher energy level state. THIS IS THE TRANSITION
There are three main types of electronic transitions involving electrons:
1.Sigma (σ) to Sigma Star (σ*) Transitions:
These transitions involve electrons moving from a sigma bonding orbital (σ) to a sigma antibonding orbital (σ*).
These transitions often occur in single bonds and are associated with absorption of ultraviolet (UV) light. They play
a role in understanding the electronic structure and stability of organic compounds.
EXAMPLE- METHANE
2.Pi (π) to Pi Star (π*) Transitions:
Here, electrons move from a pi bonding orbital (π) to a pi antibonding orbital (π*). These transitions are common in
double and triple bonds and are responsible for the absorption of UV-visible light. The energy difference between π
and π* orbitals determines the wavelengths of light absorbed, contributing to the color of certain organic
compounds.
8. 3.n to Pi Star (n → π*) Transitions:
In these transitions, an electron moves from a non-bonding (n) orbital to a pi antibonding orbital (π*). These transitions
occur when there's an electron in a lone pair orbital that gets excited to a higher energy level. They also lead to UV-
visible absorption and provide insights into the electronic properties of molecules.
4. n to Pi Star (n → (σ*)) Transitions:
These transtions occur when saturated coumpounds with atoms containg lone paie of electron gets excited .
Example- NITROGEN , OXYGEN, SULPHUR
LONE PAIR
LUMO
Unoccupied level
HOMO
Occupied level
10. Chromophores
A chromophore is a part of a molecule that absorbs light and imparts color to the compound.
It is responsible for the characteristic colors we see in various substances.
The absorption of light by the chromophore triggers electronic transitions within the molecule, which can
lead to changes in energy levels and the emission of light at specific wavelengths.
In simpler terms, a chromophore is the "color-causing" component in molecules that gives them their
distinct colors.
The color we perceive is a result of the wavelengths of light that are absorbed by the chromophore and
those that are transmitted or reflected. The color we see corresponds to the complementary color of
the absorbed wavelength. For example, a compound that absorbs blue light appears yellow
because yellow is the complementary color to blue.
11. Example
Nitro compound ----NO SHOWS YELLOW COLOUR
NO here is a chromophore which exhibits colour
Colourless benzene+ NO----PALE YELLOW
PALE YELLOW+ Hydroxyl group - DARK YELLOW
Here hydroxyl group is a Auxochrome
Examples of some chromophore
• Ethylene
• Acetylenic
• Esters
• Nitriles
Compound containing chromophore is a chromogen
12. Types of chromophores
Independent Chromophores:
These are chromophores within a molecule that absorb light and contribute to its color individually. Each
independent chromophore absorbs light independently of the others and adds to the overall color of the molecule.
The resulting color is a combination of the colors produced by each separate chromophore.
ex-azo group , Nitro group
Dependent Chromophores:
In contrast, dependent chromophores interact with each other within a molecule, affecting their absorption
properties and resulting in a collective color. The presence of one chromophore can influence the absorption
characteristics of another nearby chromophore. This interaction can shift the absorption wavelengths and alter
the overall color compared to what would be expected from the individual chromophores.
Ex-acetone- 1 keto group-clourless
2 keto group –yellow clour
3 keto group- orange colour
13. Auxochromes
Auxochromes, often referred to as auxochromes, are functional groups or substituents that, when attached
to a chromophore (color-causing group) in a molecule.
They modify and enhance its color characteristics.
Auxochromes do not have significant color on their own but can influence the color of the molecule they are
attached to. They achieve this by affecting the electronic properties of the chromophore, typically by
donating or withdrawing electrons through resonance effects.
This interaction between the auxochrome and the chromophore leads to shifts in absorption wavelengths
and intensities, ultimately altering the color perceived.
Auxochromes also increases the wavelength in the sample thus increasing the absorbance
14. SPECTRAL SHIFTS
Spectral shifts are changes in the wavelengths of electromagnetic radiation OR A change in absorbance, including
ultraviolet (UV) light, due to various factors like structural changes or solvent changes
Intensity
of
max.
absorbance
Emax
Types of spectral shifts
1. Hypsochromic/blue shift
2. Bathochromic/red shift
3. Hyperchromic shift
4. Hypochromic shift
Wavelength
15. Bathochromic Shift/Red shift :
The bathochromic shift, also known as a redshift , is a phenomenon where the absorption or emission peak of a
molecule or compound shifts towards longer wavelengths (lower energy) in the electromagnetic spectrum. This
shift is often caused by changes in the molecular structure, environment, or interactions.
Hypsochromic Shift in a Nutshell:
The Hypsochromic shift is a phenomenon in which the absorption or emission peak of a molecule or compound
shifts towards shorter wavelengths (higher energy) in the electromagnetic spectrum. This shift is typically
triggered by changes in the molecular structure, environmental conditions, or interactions.
Hypo chromic shift:
Its an effect in which the absorption maximum is reduced that is the Emax is reduced
This is caused by the entry of the group which distorts or disable the geometry of molecules
Hyperchromic shifts:
Its an effect in which the intensity of absorbed maximum increased that’s is the value if Emax
16. Exploring the Impact of Solvent on UV Absorption Spectra
Solvents can affect the UV spectra of a sample due to their polarity and hydrogen bonding capabilities. The choice of
solvent can impact the position, intensity, and shape of the absorption bands in the UV spectra. Understanding the solvent
effects is crucial in interpreting the spectra and obtaining accurate results.
Polarity decrease = Absorption maximum increase
Solvent Polarity: Solvent polarity can affect the strength of the interactions between a solute's molecules. A more
polar solvent can stabilize charge distributions in a molecule, leading to changes in its electronic structure and
subsequently its absorption spectrum.
Water> methanol> ethanol> benzene> hexane
Aggregation and Solvation Effects: Some compounds can form aggregates or complexes in solution due to
interactions with solvent molecules. These interactions can influence the electronic transitions responsible for
absorption spectra.
17.
18.
19.
20. Beer lambert’s law
Beer-Lambert law states that the concentration of the sample and path length is directly proportional to the
absorbance of the light.<monochromatic light>
The Beer-Lambert Law is stated as follows:
A=ε⋅c⋅l
Where:
•A is the absorbance of the solution.
•ε (epsilon) is the molar absorptivity or molar extinction coefficient, a constant that depends on the substance's
identity and the wavelength of light used.
•c is the concentration of the solute in the solution, usually expressed in units like moles per liter (M) or millimoles
per liter (mM).
•l is the path length of the light through the solution, typically measured in centimeters.
21. Beer lamberts law derivation
The Beer-Lambert Law can be derived from the basic principles of absorption spectroscopy.
Absorption of Light: When light passes through a sample solution containing a solute, some of the light is
absorbed by the solute molecules. The amount of absorption is proportional to the concentration of the solute.
Intensity of Incident Light: Let's consider a beam of monochromatic (single-wavelength) light with an initial
intensity entering the solution.
Intensity after Absorption: As the light passes through the solution, it gets absorbed. The remaining intensity of
the light after passing through the solution is related to the initial intensity by I=I0⋅ϵL
where L is the path length through the solution, and ϵ is the fraction of light that is transmitted (not absorbed).
Transmittance and Absorbance: Transmittance (T) is defined as the ratio of the intensity of the transmitted light (I)
to the intensity of the incident light I0 :
T=I/ I0 = ϵ L
Absorbance (A) is defined as the negative logarithm (base 10) of the transmittance:
A=−log10(T)=−log10(ϵl)=−L⋅log10(ϵ)
23. Molar Absorptivity: The term ϵ is known as the molar absorptivity or molar extinction coefficient. It represents the
ability of the solute to absorb light at a specific wavelength and is dependent on both the solute's properties and the
wavelength of light. Mathematically:
ε=−c⋅LΔA
where ΔA is the change in absorbance, c is the concentration of the solute, and L is the path length.
Final Form of Beer-Lambert Law: Substituting the expression for ε into the absorbance equation gives the Beer-
Lambert Law in its final form:
A=ε⋅c⋅l
This derivation highlights the relationship between the absorbance (A), the molar absorptivity (ε), the
concentration of the solute (c), and the path length through the solution (l). The law provides a means to
quantitatively relate the amount of light absorbed by a solute to its concentration in a solution, which is the
basis for quantitative analysis using absorption spectroscopy.
24. BEER LAMBERTS LAW DEVIATION
When a plot of absorbance as a function of concentration at a particular path and wavelength of
monochromatic is drawn, a straight line passing through the origin is obtained. But when concentration is
very high OR LOW , a plot of absorbance and concentration deviates from linear behavior.
TYPES OF DEVIATION
1. REAL DEVIATION/TRUE DEVIATION
2. CHEMICAL DEVIATION
3. INSTRUMENTAL DEVIATION/SPECTRAL
DEVIATION
25. True deviation
The deviation may occur when the light of a single wavelength is not used.
When the higher concentration of molecules in solution .
When the refractive index of absorbing medium is not ideal
Chemical deviation
It is due to chemical changes like association and dissociation , ph. changes ,etc. in absorbing medium
Example-
Phenol -270 nm phenoxide anion -287nm
Instrumental deviation
It is due to polychromatic radiation, it leads to negative deviation
Monochromaters are used to avoid this problem
26. CAUSES/REASONS FOR DEVATION
1Positive Deviation (Positive Nonlinearity):
1. In this type of deviation, the measured absorbance is higher than what the Beer-Lambert Law predicts for
a given concentration.
2. It often occurs at high concentrations of the absorbing species.
3. Aggregation, complex formation, or self-association of molecules can lead to increased absorbance,
resulting in a deviation from linearity.
1.Negative Deviation (Negative Nonlinearity):
1. In this case, the measured absorbance is lower than expected based on the Beer-Lambert Law.
2. It can occur at intermediate concentrations.
3. Self-absorption or inner-filter effects, where absorbed light reduces the intensity of incident light, can
contribute to negative deviations.
2.Instrumental Deviation:
1. These deviations arise from limitations or inaccuracies in the spectrophotometer or the measurement
process.
2. For instance, at very high absorbance values, some instruments may saturate, leading to an inability to
accurately measure absorbance.
3.Scattering Deviation:
1. Scattering of light by particles in the solution can lead to deviations from the expected linear relationship
between absorbance and concentration.
2. The scattering can contribute to additional absorption or scattering of light, affecting the measured
absorbance.
27. 4.Spectral Deviation:
1. Deviations can occur if the absorption spectrum of the solute changes with concentration.
2. This can be due to changes in the solute's electronic environment, aggregation, or interactions with the
solvent.
5.Chemical Equilibrium Deviation:
1. In cases where the solute exists in multiple chemical forms (e.g., acid-base equilibrium), changes in the
equilibrium due to changes in pH can lead to deviations from linearity.
6.Matrix Effects:
1. The matrix of the sample (other components present) can influence the absorbance.
2. Matrix effects can arise due to interactions with other substances in the solution, affecting the absorption
behavior.
7.Temperature and Pressure Deviation:
1. Changes in temperature and pressure can alter the absorbance properties of the solute, leading to
deviations from the expected linear relationship.
8.Multiple Absorbing Species Deviation:
1. When a mixture contains multiple absorbing species, the absorbance can be influenced by the interactions
and overlapping absorption spectra of the species.
9.Solvent Deviation:
1. As discussed earlier, solvent effects, such as changes in molecular interactions and conformation of the
solute, can lead to deviations from linearity.
28. INSTRUMENTATION OF SPECTROSCOPY
PARTS
1.Light Source/Radiation
2.Monochromator/Wavelength Selector
3.Sample Compartment/cuvette/sample cells
4.Detector.
5.Data Display and Analysis Interface/recording system
29. The term "spectrophotometer" is a combination of two words: "Spectro" and "photometer." Let's
break down the meanings of these components:
1.Spectro:
"Spectro" is derived from the Greek word "Spectron," which means "to look" or "to observe."
In scientific terms, "Spectro" is commonly associated with the spectrum of electromagnetic
radiation, which encompasses a range of wavelengths or frequencies. It's used in words like
"spectroscopy" and "spectrometer.“
2.Photometer:
"Photometer" comes from the Greek word "photos," meaning "light," and "metron," meaning
"measure."
A photometer is an instrument used to measure the intensity of light or other electromagnetic
radiation.
Cuvette’s spectrophotometer
30. How does it works ?
A spectrophotometer works based on the principles of absorption spectroscopy. It measures how much light a
sample absorbs at different wavelengths, providing insights into the composition and concentration of
substances in the sample
1.Light Source:
1. The process begins with a light source, which emits a range of wavelengths of light, often covering both the ultraviolet
(UV) and visible (Vis) regions.
2.Monochromator:
1. The emitted light is directed through a monochromator, which disperses the light into its individual wavelengths using a
prism or a diffraction grating.
2. The monochromator allows you to select a specific wavelength of light to pass through the sample.
3.Sample Compartment:
1. The sample to be analyzed is placed in a transparent container called a cuvette in the sample compartment.
4.Absorption by Sample:
•The selected wavelength of light passes through the sample in the cuvette.
•The sample absorbs some of the light, depending on its chemical composition and the specific wavelengths it
absorbs.
31. 5.Data Analysis:
1. The spectrophotometer's software processes the electrical signal from the detector.
2. The software calculates the ratio of the intensity of the light before and after passing through the sample.
This ratio is called the "transmittance.“
6.Absorbance Calculation:
1. The absorbance (A) of the sample at the chosen wavelength is calculated using the formula:
A=−log10(transmittance)A=−log10(transmittance).
2. The absorbance quantifies how much light was absorbed by the sample at that wavelength.
7.Calibration and Quantification:
1. To determine the concentration of a substance in the sample, a calibration curve is often created using
solutions of known concentrations.
2. The relationship between absorbance and concentration is typically linear according to the Beer-Lambert
Law: A=ε⋅c⋅l, where A is absorbance, ε is the molar absorptivity, c is concentration, and l is the path length.
8.Data Output:
1. The spectrophotometer's display unit shows the absorbance value.
Spectrophotometers are versatile instruments used in various applications, including chemical
analysis, biology, medicine, and environmental science, to quantify the concentration of substances,
monitor reactions, and study the interactions of molecules with light.
32. SOURCE OF RADIATION
source of radiation" refers to the component that emits light or electromagnetic radiation for use in
measurements.
Deuterium Lamp (UV Source):
•Deuterium lamps are used as UV light sources in the ultraviolet (UV) region, typically from about 190 nm to
370 nm.
•Deuterium lamps emit light when deuterium gas is ionized. The emitted light contains a broad range of UV
wavelengths.
Tungsten Lamp (Visible Source):
•Tungsten lamps, also known as incandescent lamps, are used as visible light sources in the visible region.
•These lamps emit a continuous spectrum of visible light, covering wavelengths from around 370 nm to 800
nm.
Xenon Lamp (Broad Spectrum Source):
•Xenon lamps provide a broad spectrum of light across the UV and visible regions.
•They emit light by creating a high-energy plasma discharge in xenon gas, resulting in a more intense and
continuous spectrum than deuterium or tungsten lamps alone
Light-Emitting Diodes (LEDs):
•LEDs can serve as sources for specific narrow bands of light in both UV and visible regions.
•They are commonly used in portable and compact spectrophotometers due to their long lifespan and low
power consumption.
Lasers (Specific Wavelength Source):
•Lasers can provide highly focused and intense light at very specific wavelengths.
•They are used in some advanced spectrophotometers for specialized applications.
33. WAVELENGTH SELECTOR
A wavelength selector in a spectrophotometer is a crucial component that allows you to choose a specific wavelength of light
for analysis. It enables you to focus on a particular region of the electromagnetic spectrum, which is important for accurately
measuring the absorbance or transmittance of a sample
It consist of monochromter and slits
Monochromator:
•The monochromator is a common device used in many spectrophotometers. It disperses light into its individual
wavelengths using a prism or a diffraction grating. By adjusting the angle of the prism or the grating, you can select
a specific wavelength to pass through the sample.
Prism Grating Combination:
•Some advanced spectrophotometers use a combination of a prism and a grating in the monochromator to achieve
higher resolution and better wavelength accuracy.
34. Slits
"slits" refer to narrow apertures or openings through which light passes. Slits are an integral part of
spectrophotometers and other optical devices that involve light analysis. They play a crucial role in controlling the
amount of light that enters or exits the instrument, which directly affects the quality and accuracy of
measurements.
1.Entrance Slit:
1. The entrance slit is positioned between the light source and the monochromator in a spectrophotometer.
2. It determines the width of the light beam entering the instrument. A narrower entrance slit results in a more
focused and precise beam, which can improve the instrument's resolution.
2.Monochromator Slit:
1. The monochromator slit is located within the monochromator.
2. It controls the range of wavelengths that the monochromator disperses and selects. Adjusting the width of
this slit allows you to control the resolution of the selected wavelength.
3.Exit Slit:
1. The exit slit is positioned after the monochromator and before the detector.
2. Similar to the entrance slit, it controls the width of the light beam that reaches the detector. A narrower exit
slit can enhance spectral resolution but might reduce light intensity.
35. Sample cells/cuvettes
Sample cells, also known as cuvettes, are transparent containers used to hold liquid samples in spectrophotometry They
play a critical role in allowing light to pass through the sample for analysis. Sample cells come in various sizes, shapes, and
materials to accommodate different applications and types of measurements.
• Design and Materials:
• Sample cells are typically made of high-quality optical materials such as glass, quartz, or plastic.
• They are designed to be optically clear and free from contaminants that could interfere with the light path.
• Path Length:
• The path length of a sample cell refers to the distance that light travels through the sample. Path lengths are
commonly standardized to certain values, such as 1 cm, 2 cm, or 10 mm.
• The choice of path length depends on the concentration of the sample and the desired sensitivity of the
measurement. A longer path length allows for greater absorption and precision but may require higher
sample concentrations.
• UV and Visible Range
• Different materials are used for sample cells based on the range of wavelengths used in the measurement.
Quartz is often used for UV measurements, while glass or plastic can be suitable for visible measurements.
36. A phototube or photoelectric cell is a type of gas-filled or vacuum tube that is
sensitive to light.
Such a tube is more correctly called a 'photoemissive cell' to distinguish it from
photovoltaic or photoconductive cells.
Phototubes were previously more widely used but are now replaced in many
applications by solid state photodetectors
Phototube
Detectors
These include:
Photo Tube
Photo Multiplier
Photo Voltaic Cell
The photons strikes the photocathode and emits electrons
In phototube only few electrons are collected
Detector is a device or circuit that exert information from a modulated radio frequency current of voltage
37. Principle of Photo Tube Detector
This detector is a vacuum tube with a caesium coated photocathode
Photons of sufficiently high energy hitting the cathode can dislodge electrons which are collected at anode
Photon flux is measured by the current flow in the system
Photomultiplier Tubes
Photomultiplier tubes (photomultipliers or PMTs for short) are extremely sensitive detectors of light in the
ultraviolet, visible, and near-infrared ranges of the electromagnetic spectrum
It consist of photo-emissive cathode{ a cathode which emits electrons when stuck by photon of radiation}
A photon radiation entering the tube strikes the cathode , causing the emission of several electrons
38. Principle of Photomultiplier Detector
The impinging electrons strike with enough energy to eject 2-5 secondary electrons , which are accelerated
to the second dynode to eject still more electrons
A photomultiplier may have 9-16 stages and overall gain of 10~10 electrons per incident photon
Photo Voltaic Cell
A solar cell, or photovoltaic cell, is an electronic device that converts the energy of light directly into electricity by the
photovoltaic effect, which is a physical phenomenon.
It is a form of photoelectric cell, defined as a device whose electrical characteristics, such as current, voltage, or
resistance, vary when exposed to light.
The common single-junction silicon solar cell can produce a maximum open-circuit voltage of approximately 0.5 to
0.6
photovoltaic (PV) cell requires three basic attributes:
The absorption of light, generating excitons (bound electron-hole pairs), unbound electron-hole pairs (via excitons), or
plasmons.
The separation of charge carriers of opposite types.
The separate extraction of those carriers to an external circuit.
39. Principle of Photo Voltaic Cell
It is based on the principle of the photovoltaic effect.
The photovoltaic effect is a process in which a light-sensitive semiconductor converts the visible light (sun light) into
voltage.
This action occurs in all semiconductors that are constructed to absorb energy
Advantages of Photovoltaic Cells
The photovoltaic cell does not require any external battery for its own operation,
i.e. it is self-generating.
Since solar energy is unlimited, once the photovoltaic system is installed,
it can produce energy years together.
The maintenance cost is minimum.
It is non-polluting
40. Silicon photodiodes are semiconductor devices responsive to high- energy particles and photons.
Photodiodes operate by absorption of photons or charged particles and generate a flow of current in an external
circuit, proportional to the incident power.
Photodiodes can be
used to detect the presence or absence of minute quantities of light
and can be calibrated for extremely accurate measurements from
intensities below 1 pW/cm2 to intensities above 100 mW/cm2
Silicon Photodiode
Photodiode
A special type of PN junction device that generates current when exposed to light is known as Photodiode.
It is also known as photodetector or photosensor.
It operates in reverse biased mode and converts light energy into electrical energy
Advantages of Photodiode
It shows a quick response when exposed to light.
Photodiode offers high operational speed.
It provides a linear response.
It is a low-cost device
41. It works on the principle of Photoelectric effect.
The operating principle of the photodiode is such that when the junction of this two-terminal semiconductor device is
illuminated then the electric current starts flowing through it.
Only minority current flows through the device when the certain reverse potential is applied to it
Principle of Photo Diode
Modes of Photodiode
Photodiode basically operates in two modes:
Photovoltaic mode: It is also known as zero-bias mode because no external reverse potential is provided to the
device. However, the flow of minority carrier will take place when the device is exposed to light.
Photoconductive mode: When a certain reverse potential is applied to the device then it behaves as a
photoconductive device.
Here, an increase in depletion width is seen with the corresponding change in reverse voltage
42. Application of uv visible spectroscopy
Spectroscopy is a broad and versatile scientific technique that involves the interaction of electromagnetic
radiation with matter to gain insights into the properties and behavior of substances.
1. Quantitative Analysis: UV-Visible Spectroscopy allows for the quantitative determination of the
concentration of a substance in a sample using the Beer-Lambert Law
2. Identification of Chemical Compounds: UV-Visible Spectroscopy can be used to identify chemical
compounds based on their characteristic absorption spectra. This aids in the qualitative analysis of
unknown samples.
3.determination of impurities UV absorption spectroscopy is one of the best methods for determination of
impurities in organic molecules. Additional peaks can be observed due to impurities in the sample and it
can be compared with that of standard raw material. By also measuring the absorbance at specific
wavelength, the impurities can be detected
43. Quantitative analysis
1.Spectrophotometric titration
2.Single component analysis
3.Multi component analysis
Quantitative analysis using UV – VIS
spectroscopy has large-scale applications
for determination of inorganic analytes
including both metals and non-metals,
organic compounds, metal – ligand
interactions and stability and kinetic
studies on light absorbing species.
44. Spectrophotometric titration
Spectrophotometric titration combines the principles of titration (a method to determine the concentration of a
substance in a solution) and spectrophotometry (the measurement of how much light a sample absorbs or
transmits at different wavelengths). This technique is used to perform precise and accurate titrations by monitoring
changes in absorbance or transmittance as a reaction progresses.
This is based on the beers law
1.Principle:
1. Spectrophotometric titration involves a reaction between an analyte (substance being titrated) and a titrant
(solution of known concentration). The reaction leads to a change in absorbance or transmittance that can
be monitored using a spectrophotometer.
2.Selection of Analyte and Titrant:
1. The analyte and titrant should be chosen based on their chemical properties and the feasibility of the
reaction. The reaction should lead to a change in color or absorbance that can be detected by the
spectrophotometer.
3.Calibration:
1. Before performing the titration, a calibration curve is constructed using standards of known concentrations
of the analyte or a similar compound. The calibration curve relates absorbance to concentration.
45. 4.Titration Procedure:
1. The titration is carried out by gradually adding the titrant to the analyte solution while monitoring the
absorbance or transmittance using the spectrophotometer.
2. As the reaction progresses, the absorbance or transmittance changes due to the formation of a product
or complex.
5.Endpoint Detection:
1. The titration is continued until a significant change in absorbance or transmittance is observed. This
point is known as the "endpoint" and corresponds to the completion of the reaction.
6.Calculations:
1. The concentration of the analyte can be determined using the calibration curve and the absorbance or
transmittance measured at the endpoint.
The titration curve is the plot of absorbance VS the volume of titrant
46. Single component analysis
Single-component analysis, also known as univariate analysis, involves determining the concentration of a single
chemical compound or analyte in a sample using a specific analytical technique. This type of analysis is common in
various scientific fields, including chemistry, biology, environmental science, and pharmaceuticals. The goal of single-
component analysis is to accurately quantify the concentration of a specific substance in a sample.
ONLY single compound absorbs significant
Method used- standard absorbtivity value
It's important to note that single-component analysis assumes that the signal measured is solely due to the
compound of interest and is not influenced by other substances in the sample. For more complex samples containing
multiple components, multivariate analysis techniques may be needed to account for potential interferences and
variations in the matrix.
47. Multi component analysis
Multicomponent analysis, also known as multivariate analysis, involves determining the concentrations of
multiple chemical compounds or analytes in a complex mixture using analytical techniques. This type of
analysis is employed when a sample contains multiple components that may interfere with each other's
measurements or when it's not feasible to separate the components before analysis. Multicomponent analysis
is especially important when dealing with real-world samples that are often mixtures of various substances
Multicomponent analysis can be challenging due to the potential for overlapping spectral features,
interferences, and noise in the data. Careful calibration, validation, and quality control are essential for
obtaining accurate and reliable results. Advanced chemometric techniques, such as principal component
analysis (PCA) and partial least squares regression (PLSR), are often used for the successful implementation
of multicomponent analysis.