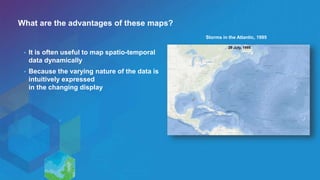
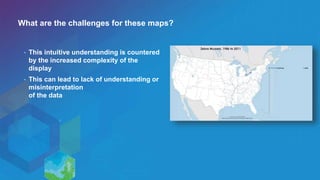
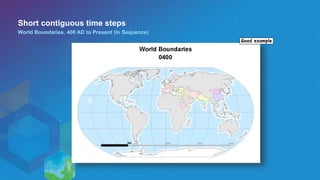
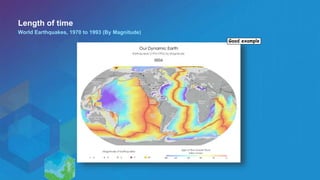
Methods for Mapping Temporal Data
Aileen Buckley
What are the advantages of these maps?
• It is often useful to map spatio-temporal
data dynamically
• Because the varying nature of the data is
intuitively expressed
in the changing display
Storms in the Atlantic, 1995
What are the challenges for these maps?
• This intuitive understanding is countered
by the increased complexity of the
display
• This can lead to lack of understanding or
misinterpretation
of the data
What we know
• Allow readers a level of interactivity
• The display should transition smoothly
- Show short contiguous time steps
- Show data with a “forced” neighborhood
• Limit the complexity
• Limit the length of time
These visualizations are already complex…
Short contiguous time steps
World Boundaries, 400 AD to Present (by Decade)
Poor example
Short contiguous time steps
World Boundaries, 400 AD to Present (In Sequence)
Good example
Forced neighborhood
U.S. County Population Density, 1800 to Present (by Decade)
Poor example
Forced neighborhood
NetCDF Air Temperature, 1948 to 2013
Good example
Complexity
Zebra Mussels, 1986 to 2011
Poor example
Complexity
Most Populated Cities 1790 - 2000
Good example
Length of time
World Earthquakes, 1970 to 1993 (Over Time)
Poor example
Good example
Length of time
World Earthquakes, 1970 to 1993 (By Magnitude)
Methods for mapping temporal data

Methods for mapping temporal data

  • 1.
    Methods for MappingTemporal Data Aileen Buckley
  • 2.
    What are theadvantages of these maps? • It is often useful to map spatio-temporal data dynamically • Because the varying nature of the data is intuitively expressed in the changing display Storms in the Atlantic, 1995
  • 3.
    What are thechallenges for these maps? • This intuitive understanding is countered by the increased complexity of the display • This can lead to lack of understanding or misinterpretation of the data
  • 4.
    What we know •Allow readers a level of interactivity • The display should transition smoothly - Show short contiguous time steps - Show data with a “forced” neighborhood • Limit the complexity • Limit the length of time These visualizations are already complex…
  • 5.
    Short contiguous timesteps World Boundaries, 400 AD to Present (by Decade) Poor example
  • 6.
    Short contiguous timesteps World Boundaries, 400 AD to Present (In Sequence) Good example
  • 7.
    Forced neighborhood U.S. CountyPopulation Density, 1800 to Present (by Decade) Poor example
  • 8.
    Forced neighborhood NetCDF AirTemperature, 1948 to 2013 Good example
  • 9.
    Complexity Zebra Mussels, 1986to 2011 Poor example
  • 10.
    Complexity Most Populated Cities1790 - 2000 Good example
  • 11.
    Length of time WorldEarthquakes, 1970 to 1993 (Over Time) Poor example
  • 12.
    Good example Length oftime World Earthquakes, 1970 to 1993 (By Magnitude)

Editor's Notes

  • #2 Esri Corporate Template-Dark v3.3 16:9 version – January 21, 2016 For more templates, sample files, and icons, see https://compass.esri.com/resources/presentations/Pages/Main.aspx To add footer text in Windows On the Home tab, under Insert, click Text, and then click Header and Footer. Click the Slide tab, select the Footer check box, and then type the footer text that you want. Click either Apply or Apply to All. To add footer text on a Mac On the View menu, select Header and Footer. Select the Footer check box and then type the footer text that you want. Click either Apply or Apply to All. If footers don't appear on the slides If footers don't appear on title slides, in the Header and Footer dialog box make sure the Don't show on title slide check box is not selected. If the footers are missing from other slides, the placeholders for these items might have been removed from specific slide layouts or the slide master.