Downloaded 18 times

The document discusses space-time modeling in GIS, emphasizing the integration of the temporal dimension to analyze changes in spatial patterns over time, driven by advances in data and computing. It outlines various approaches for representing spatiotemporal data, including snapshot and entity-based models, and introduces the space-time cube tool in ArcGIS for organizing point data across spatial and temporal dimensions. The advantages of space-time modeling include improved visualization of changes, capabilities for large data analysis, and insights into human-environment interactions.
Introduction to space-time modelling in GIS and its importance in analyzing spatial patterns.
Discusses the significance of adding a temporal dimension to GIS for understanding dynamic spatial patterns.
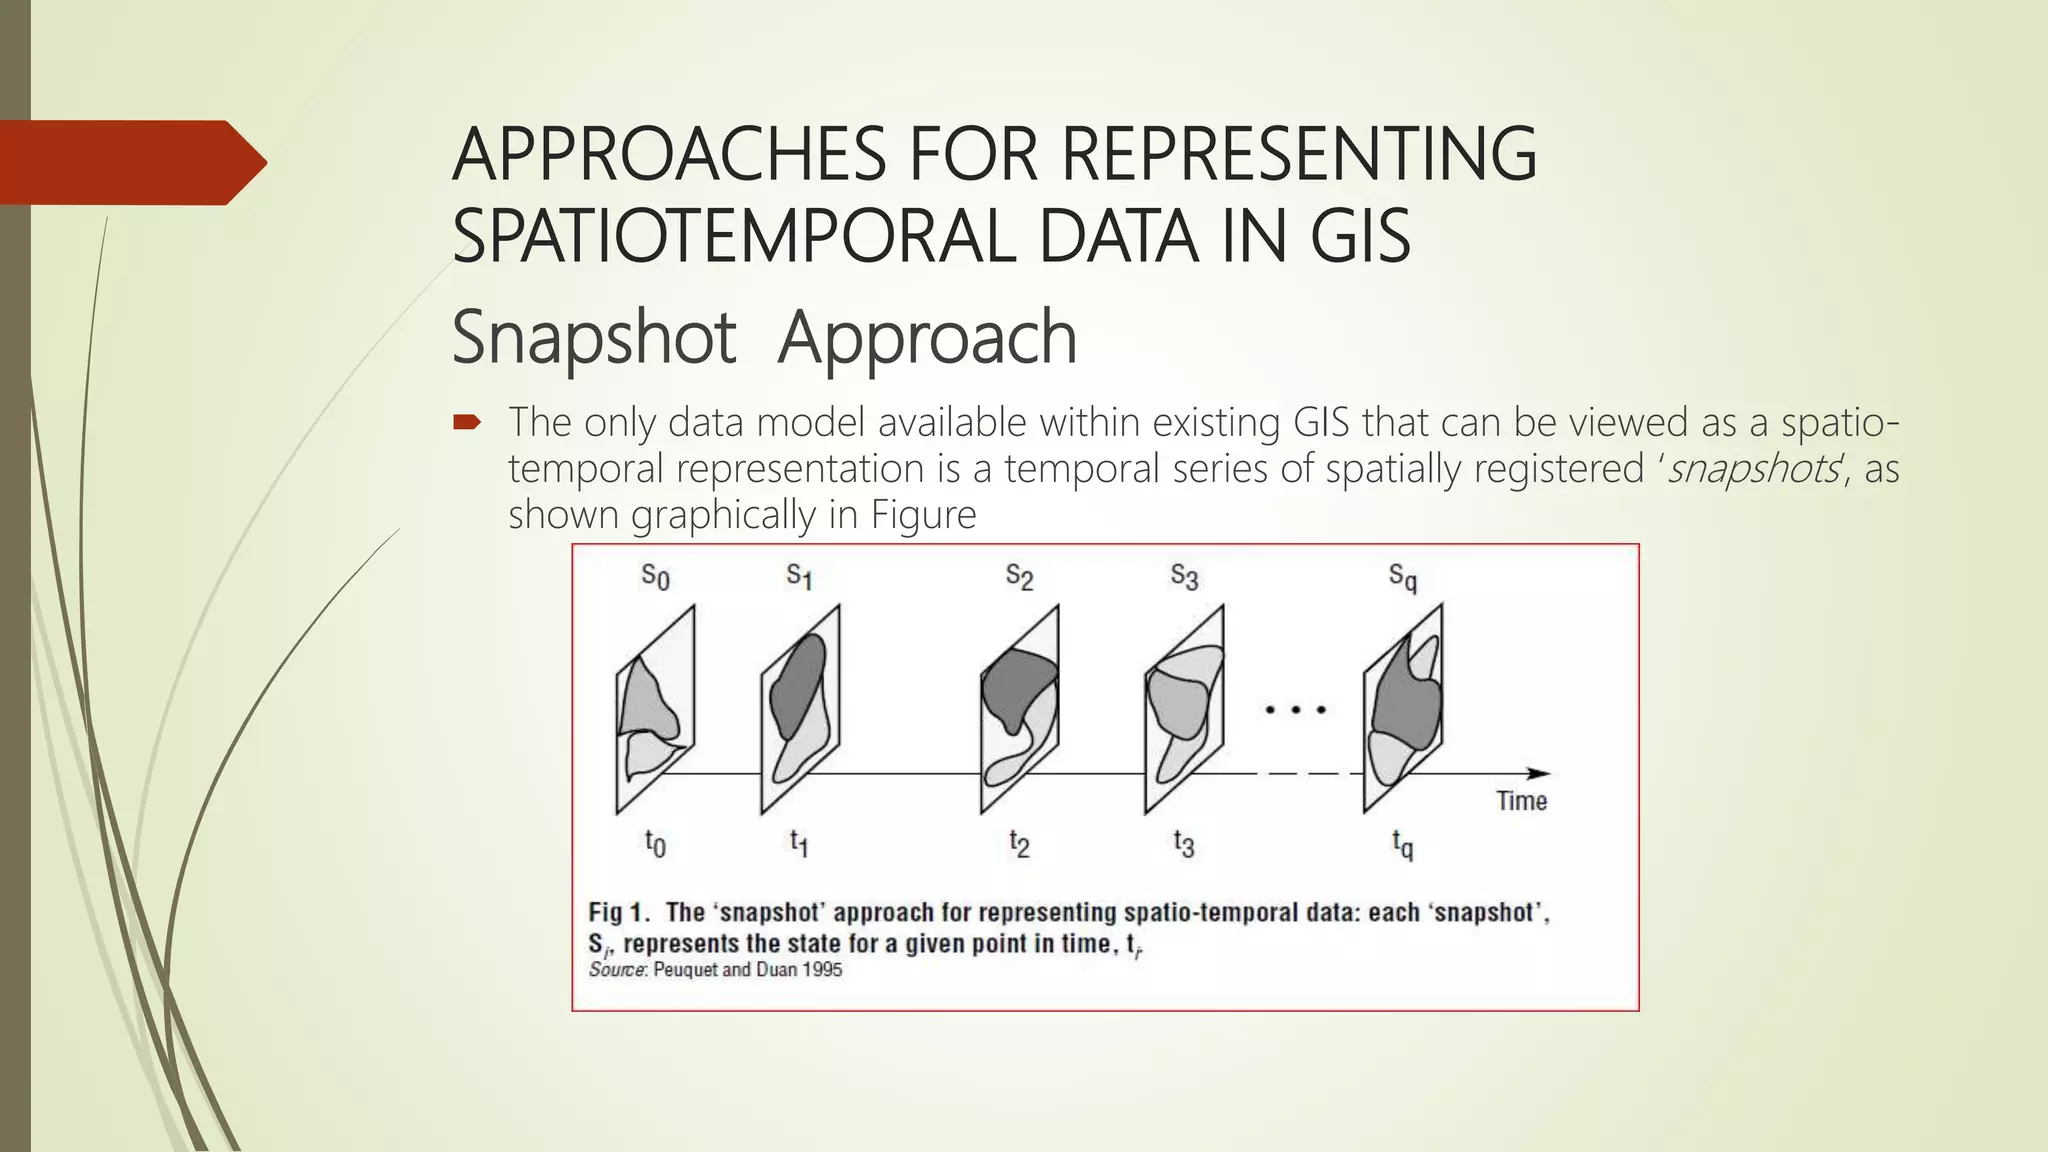
Explains the snapshot approach to represent spatiotemporal data in GIS, using state recordings at specific times.
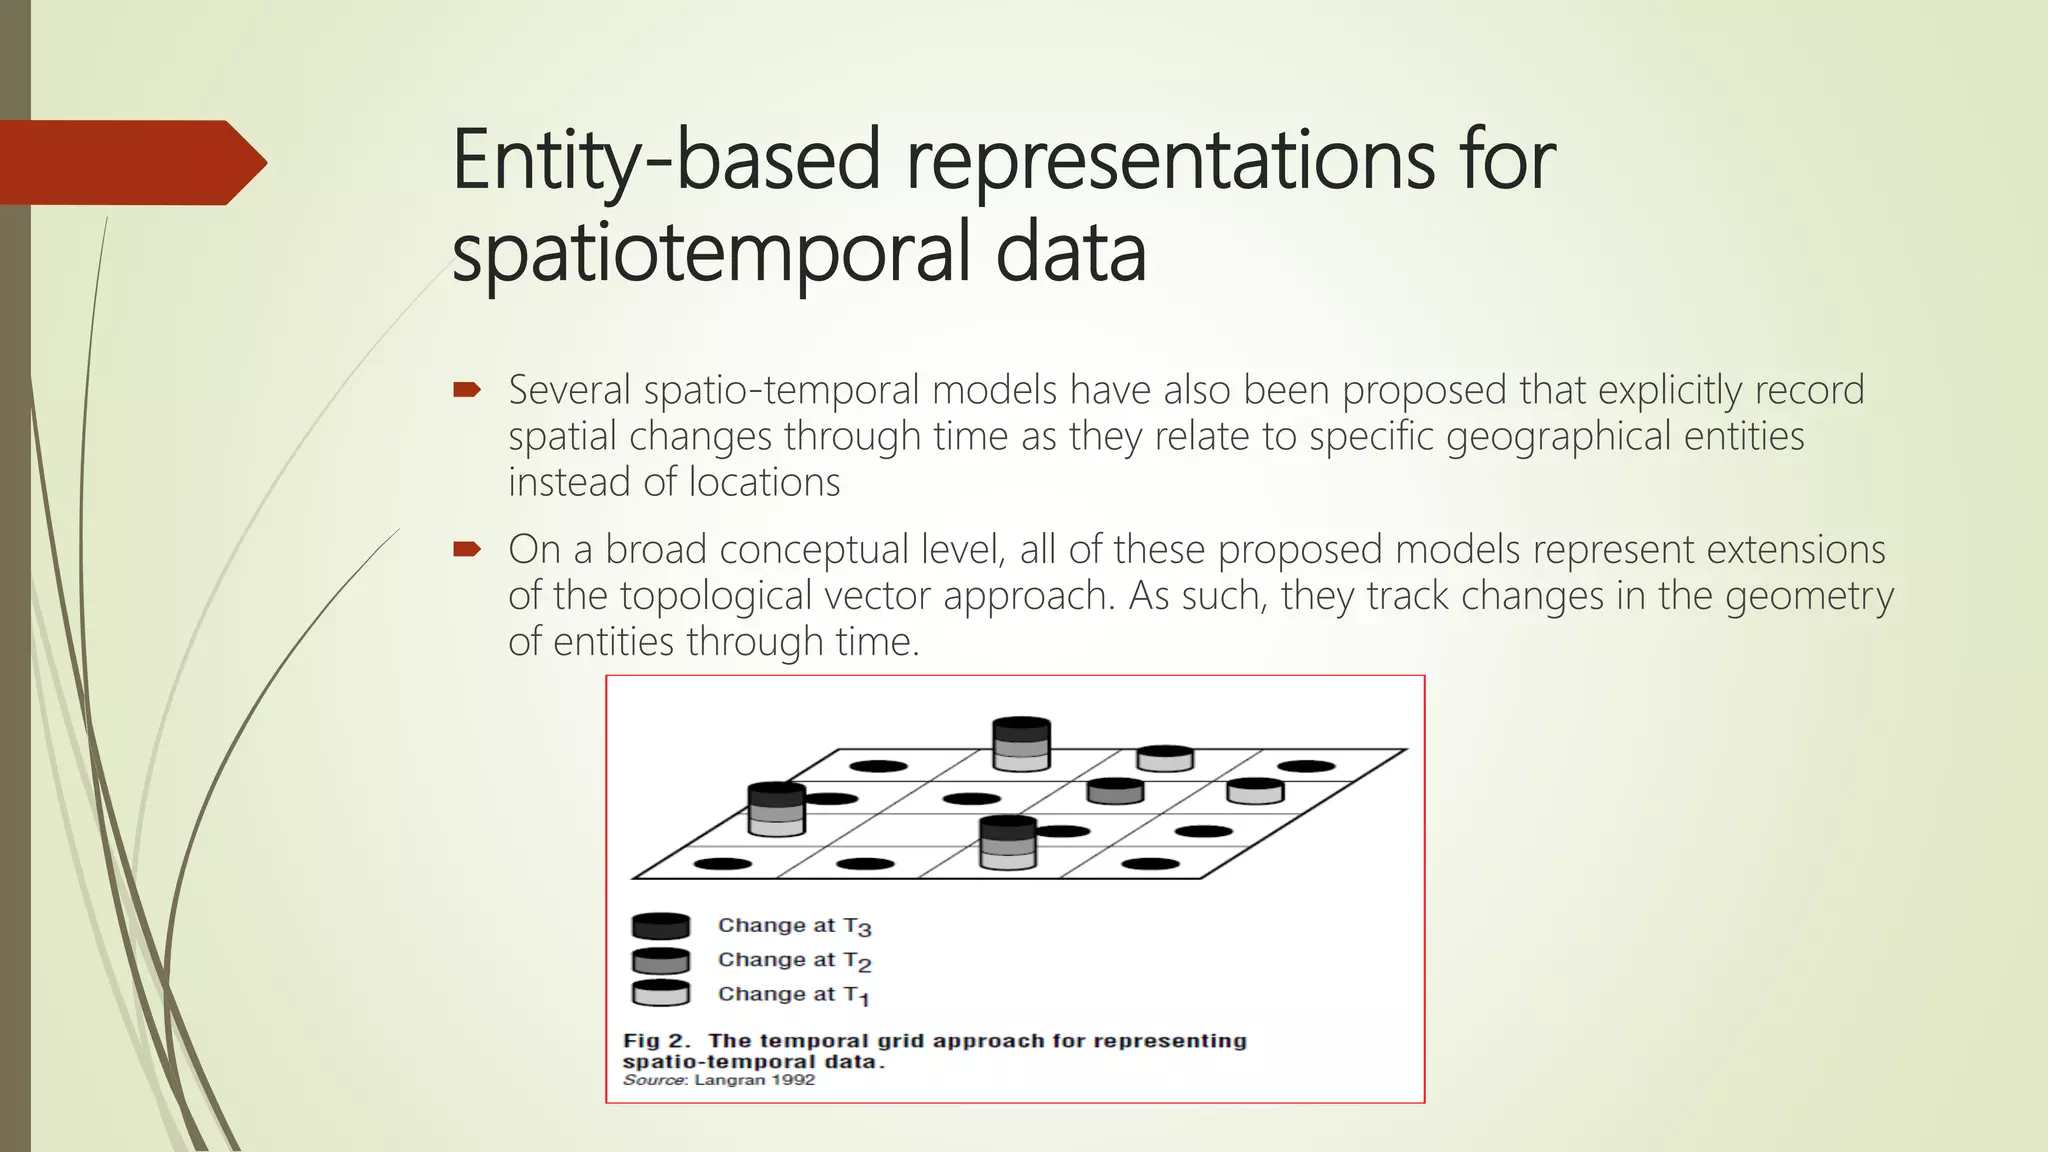
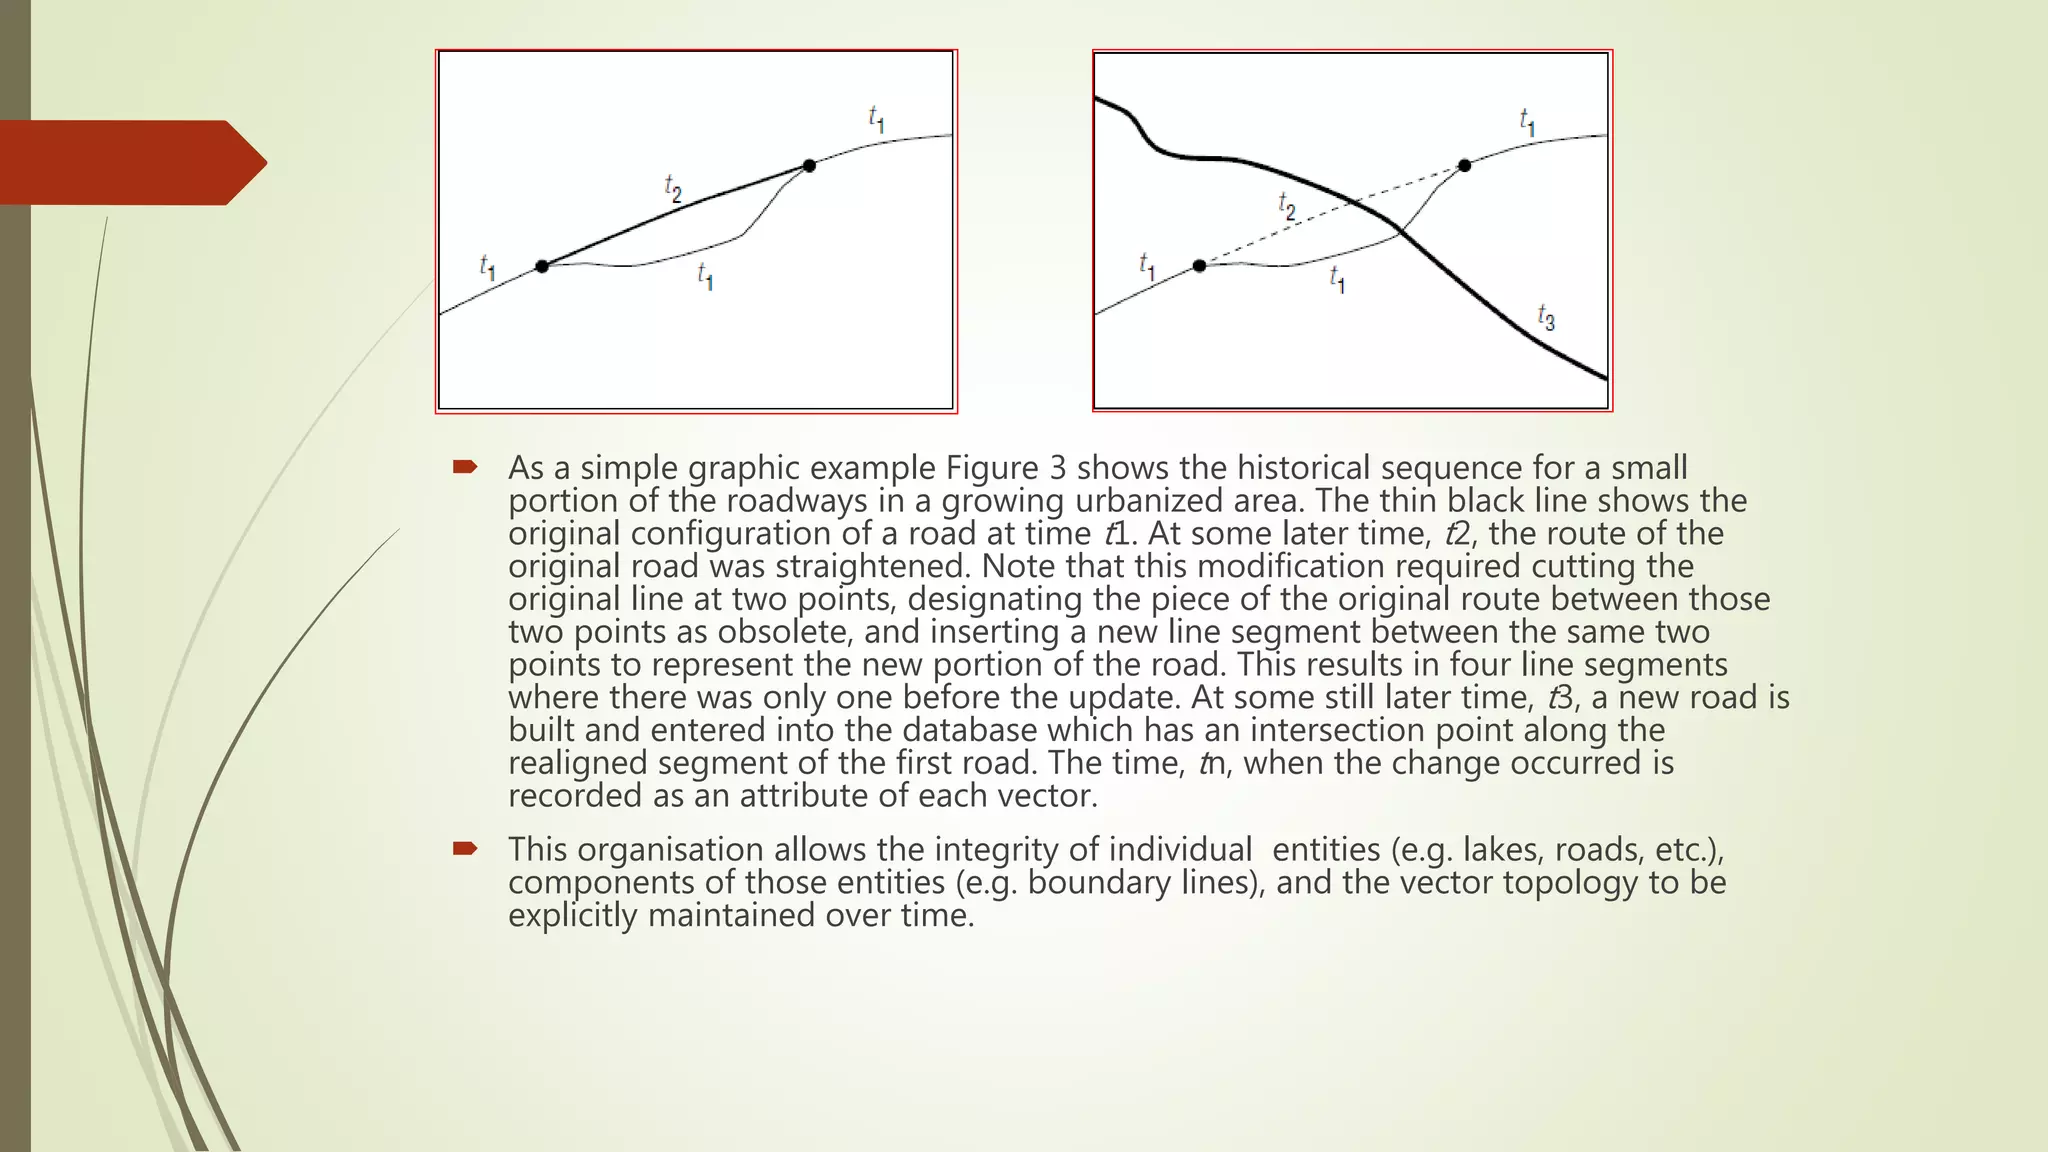
Details on entity-based representations tracking spatial changes over time, highlighting amendment vectors.
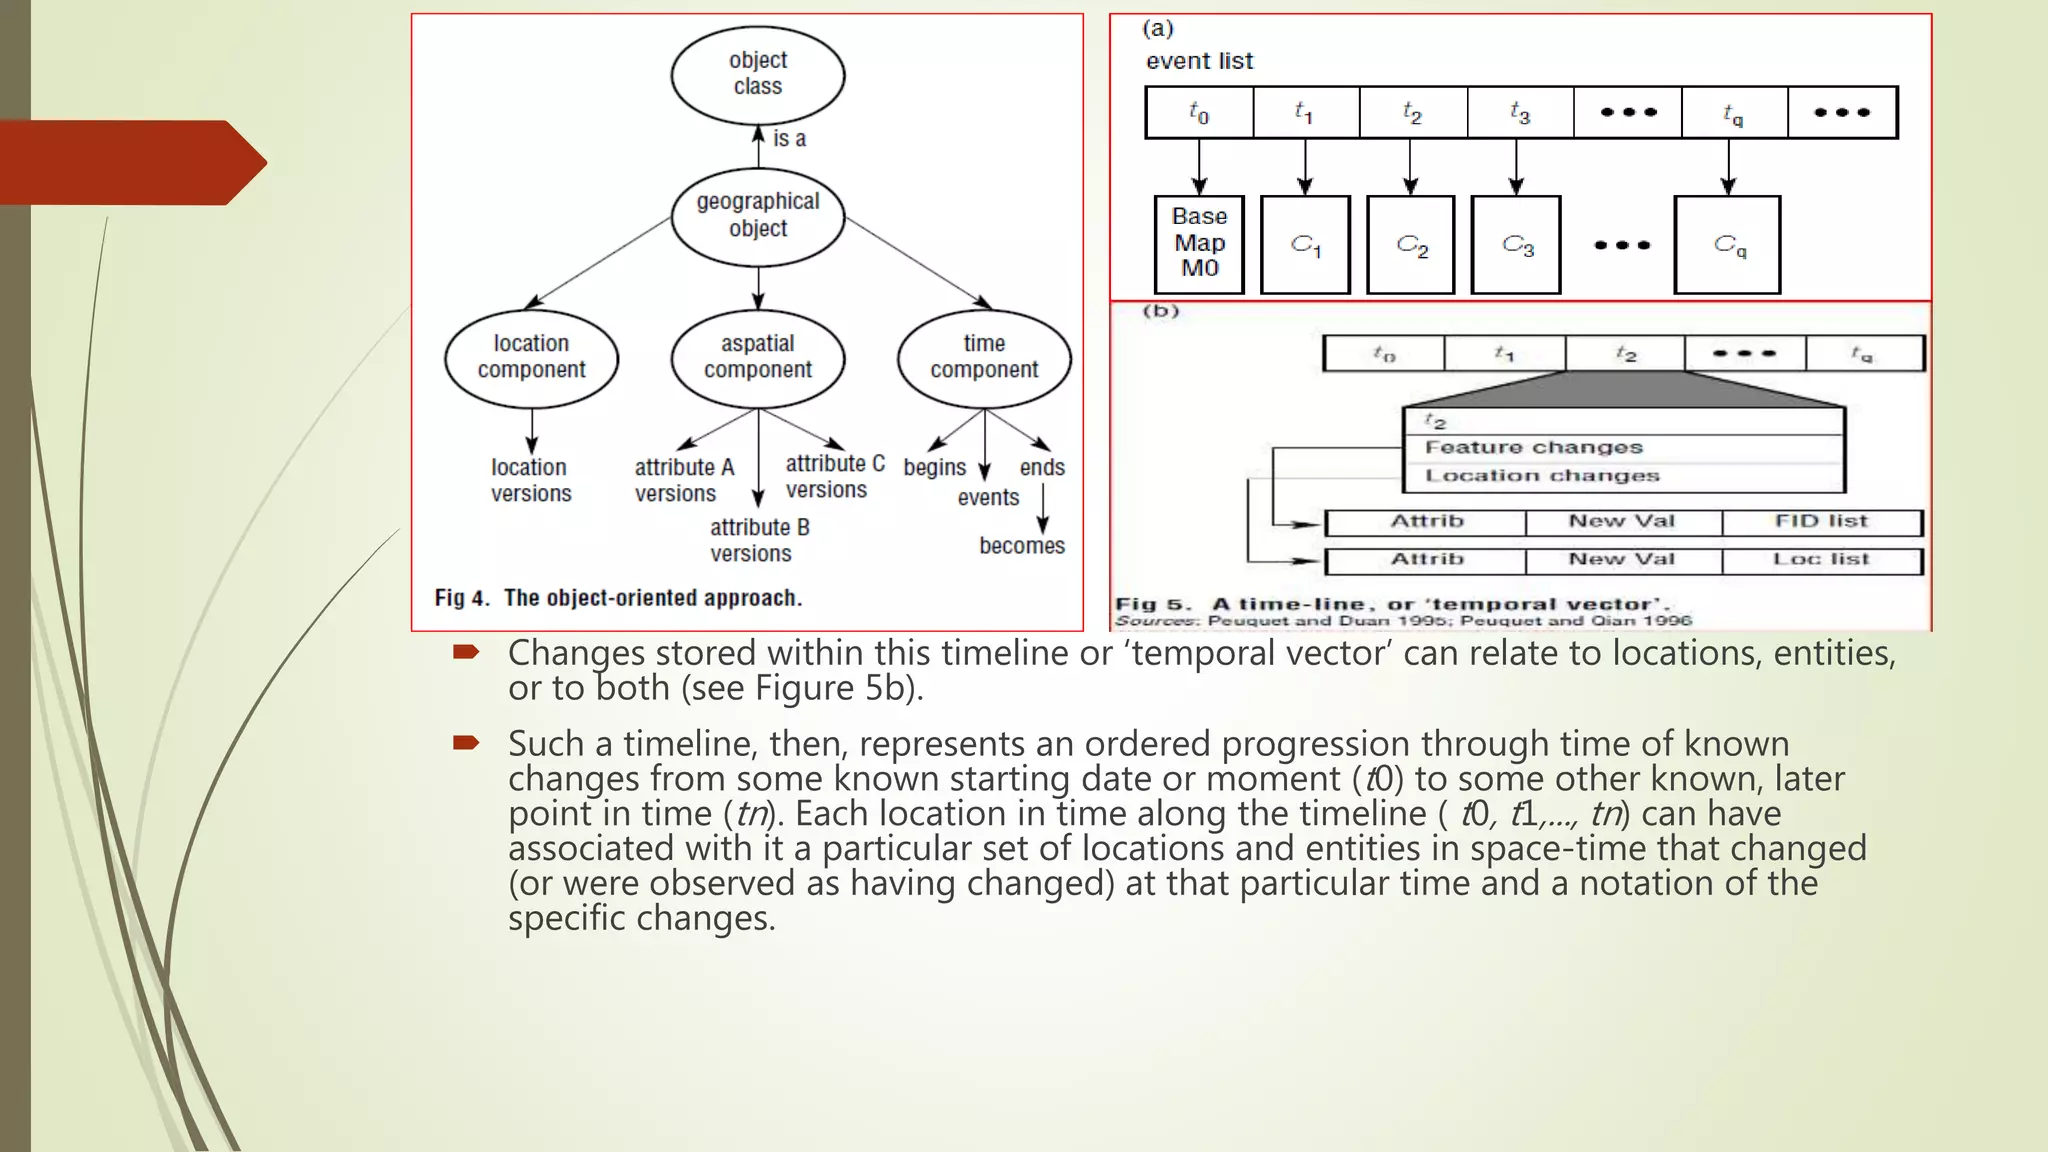
Introduces time-based spatiotemporal representations that record changes as a sequence of events.
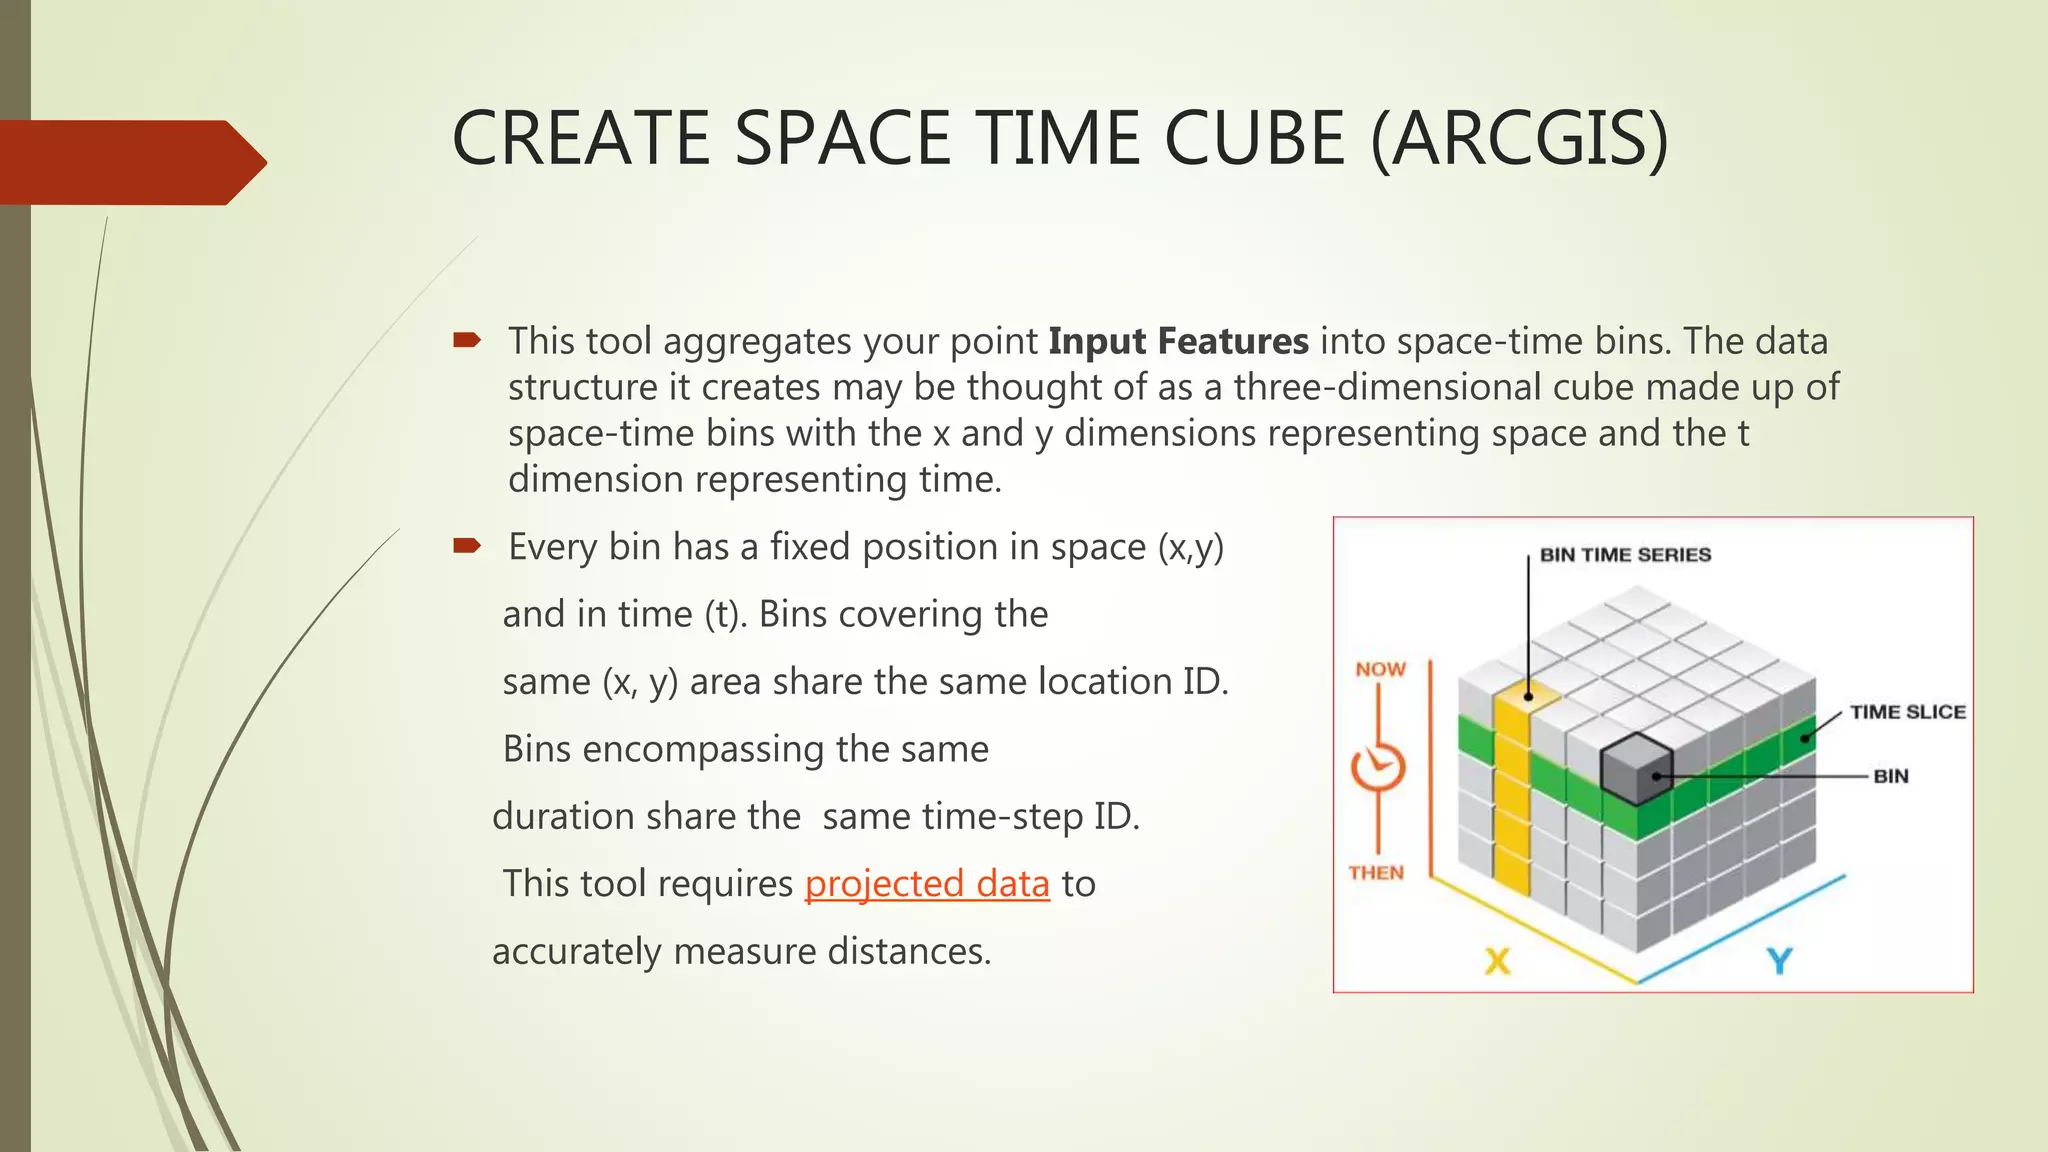
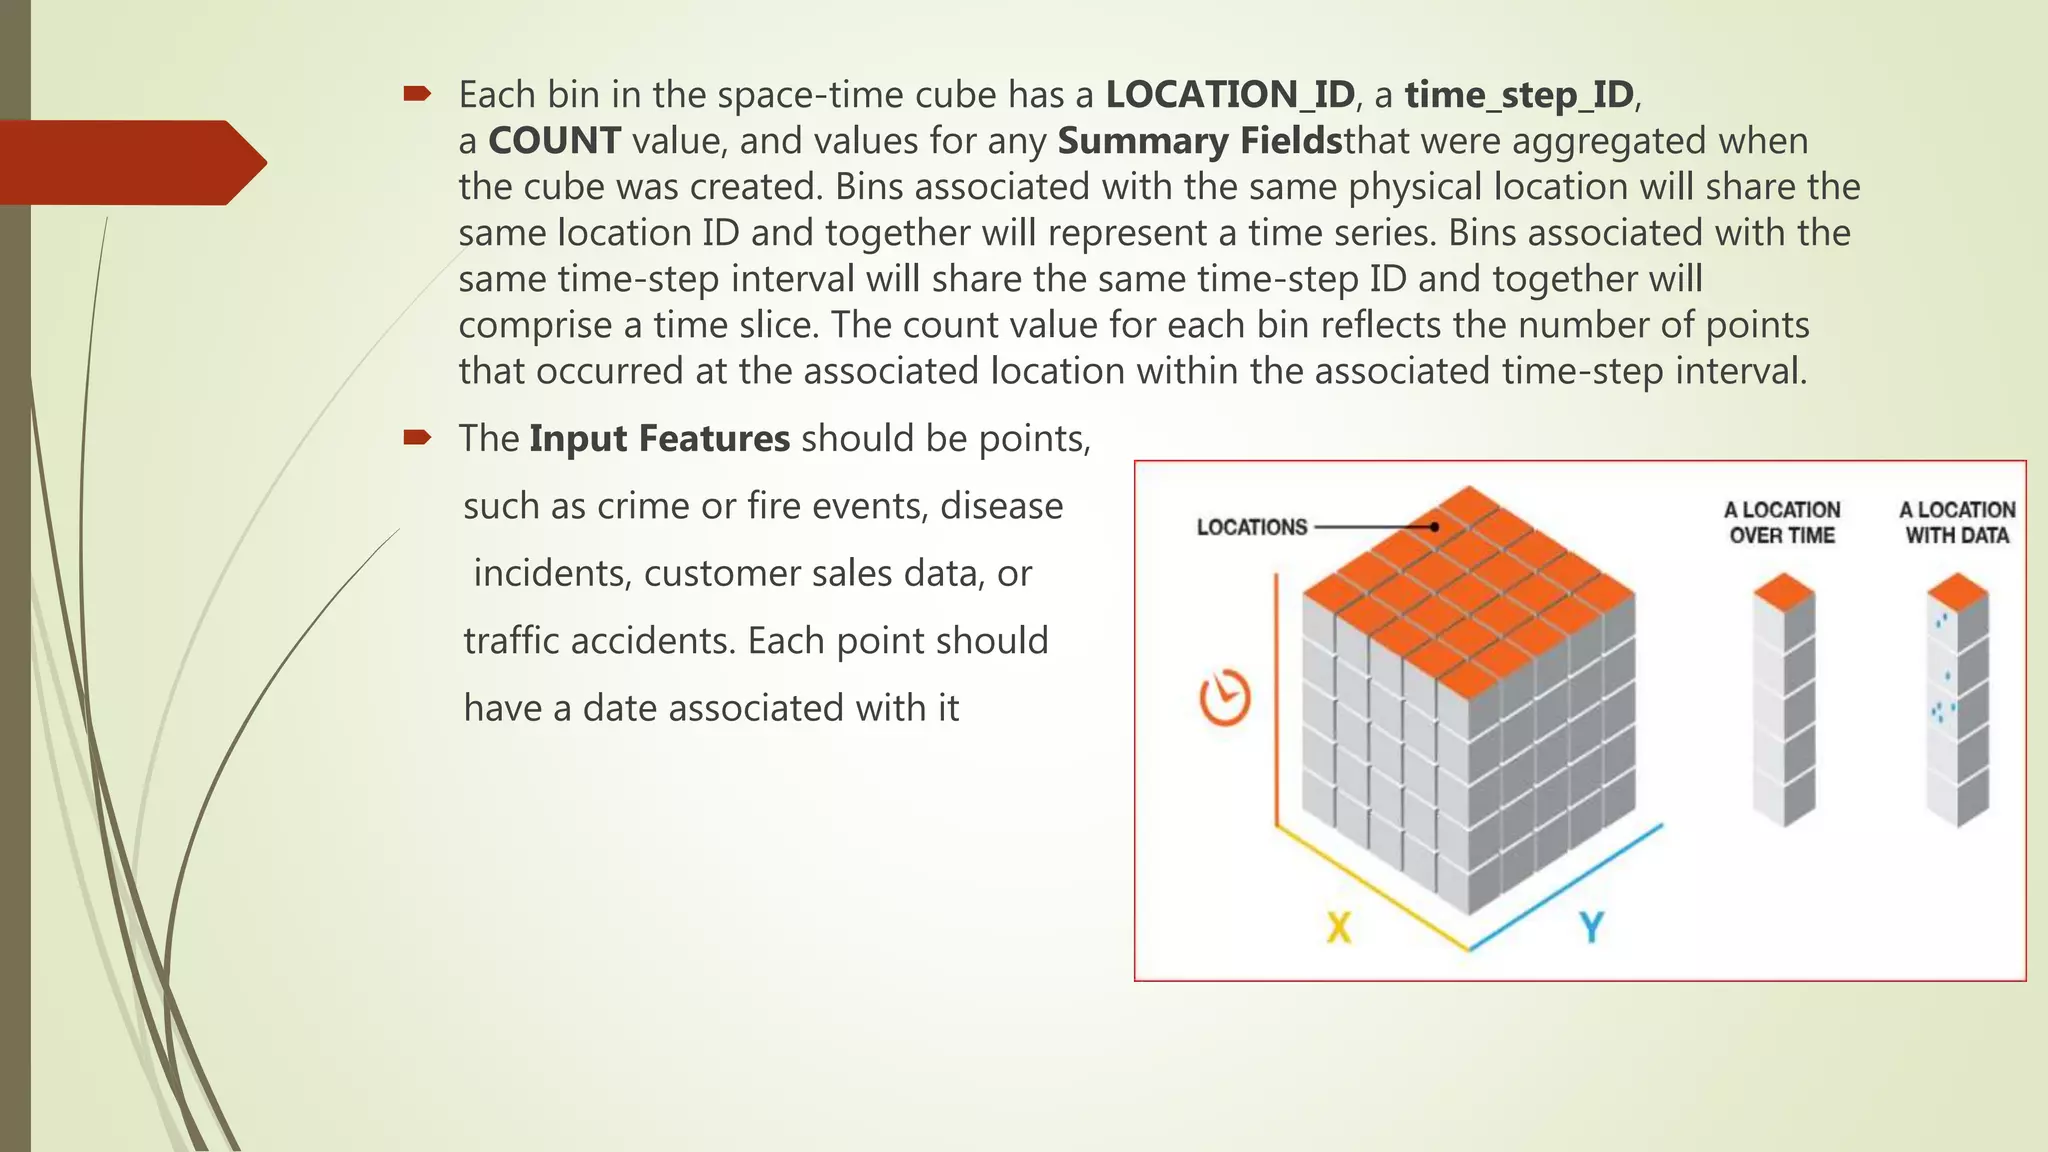
Describes how to create space-time cubes to aggregate spatial and temporal data using bins.
Highlights the benefits of space-time modelling in GIS for analyzing spatial changes and human-environment interactions.
Lists reference materials and literature relevant to time in GIS and geographical databases.


![[DSC Europe 25] Jim Sterne - Adopting Generative AI Capabilities Into the Ent...](https://cdn.slidesharecdn.com/ss_thumbnails/sxhpofuorcagxsaulkmt-3-251204082258-7e66bc48-thumbnail.jpg?width=640&height=640&fit=bounds)
![[DSC Europe 25] Dusan Jovicic - AI Story: From on-prem to cloud and back agai...](https://cdn.slidesharecdn.com/ss_thumbnails/8kp49m6uq22ifnbwhfnk-2-251205085715-964d11a6-thumbnail.jpg?width=640&height=640&fit=bounds)


![[DSC Europe 25] Bogdan Daniel Maruneac - AI - It starts with you.pptx](https://cdn.slidesharecdn.com/ss_thumbnails/odov3snhrcqs9hx5ny2n-4-251205085715-f1daacfe-thumbnail.jpg?width=640&height=640&fit=bounds)


![[DSC Europe 25] Marija Vlajkovic & Andrea Radonjanin - Integration of AI tool...](https://cdn.slidesharecdn.com/ss_thumbnails/qf1jrglttoc3bm8s3aop-final-integration-of-ai-tools-251208151905-394f3a6a-thumbnail.jpg?width=640&height=640&fit=bounds)

![[DSC Europe 25] Boris Perkovic - Lost in performance.pptx](https://cdn.slidesharecdn.com/ss_thumbnails/uq5hrp7vsuahqkxzifux-1-251204082258-fd2ee09d-thumbnail.jpg?width=640&height=640&fit=bounds)
