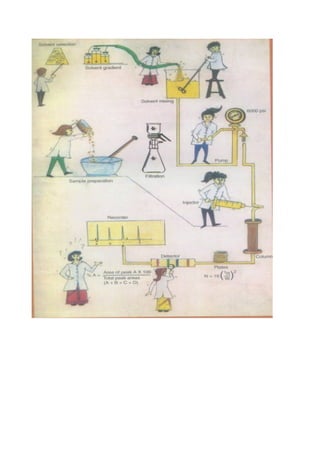
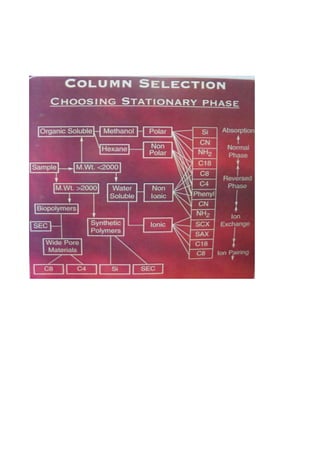
SlideShare a Scribd company logo
1 of 63
Download to read offline
LIQUID CHROMATOGRAPHY 
SEPARATION BY LIQUID-LIQUID CHROMATOGRAPHY 
The liquid-liquid chromatography column consists of a bed support (usually inert) on which the stationary partitioning phase is adsorbed. The mobile phase flowing through the column is in contact with the stationary phase over a large interphase. In this process, equilibrium distributions of the solute between the two phases take place rapidly. Separation of the different components of a mixture results from the differing distributions of the various solutes in these two unlike phases. When compared to the other forms of chromatography, liquid-liquid remains as one of the more versatile procedures. This versatility, based largely on the selection of a partitioning phase, may be used to make the desired separation. Partition can be applied to a wide variety of sample types. In the normal mode the stationary phase is the polar segment while the mobile phase is of less polarity. When this is reversed, it is called reverse phase liquid-liquid chromatography. 
Thus the normal mode is usually used for the separation of more polar components, while separation of non-polar components is normally done using the reverse phase technique. 
There are two general types of support used for liquid-liquid chromatography, the porous support and the pellicular support. The porous support contains pores throughout its structure and has high surface area. The pellicular support has a solid core and a thin shell of porous material. The advantages of the porous materials as supports are that they are less expensive, and possess a greater capacity for solutes because of the size/surface area relationship. 
The life of a liquid-liquid column depends on the system and the conditions under which the column is operated. In this mode of chromatography we are attempting to create a partial solubility between two mutually insoluble phases. Unfortunately, very few liquids are totally insoluble in some other liquid.
Therefore, the moving phase slowly and insidiously tends to to destroy the stationary phase. Thus, for maximum column life it is generally required to presaturate the moving phase with stationary phase and we use a precolumn in the system to overcome the effects of moving phase temperature variations as well as to insure that the stationary phase is in equilibria with the moving phase. It is also important to remember that the saturation of the mobile phase with a poorly soluble stationary phase can require time and high agitation to ensure intimate contact between these two basically insoluble liquids. 
SEPARATION BY LIQUID-SOLID CHROMATOGRAPHY 
Modern affinity chromatography has a number of potential advantages to thin layer chromatography i.e. greater speed, greater separation efficiency, easier automation for convenience and unattended operation. Quantitation is simpler, preparative separation can be done, LSC has application to routine control, and a permanent record of the separation is obtained. The primary factor in determining the relative adsorption of a sample molecule is its functional groups. Relative adsorption on a polar packing increases as the polarity and the number of these functional group increase. The uniqueness of retention and selectivity in affinity chromatography arises from two characteristic features of adsorption from solution. 
(1) A competition between sample and solvent molecules for a place on the adsorbent surface, and 
(2) Multiple interactions between functional groups on the sample molecule and the corresponding rigidly fixed sites on the adsorbent surface. 
The key to packing selection is to choose that type of packing which will enhance the differences in the molecules that you want to separate. For example, in the selection of packing to separate positional isomer the portion of the molecule which is in different position of prime importance-if the difference is in the position of a functional group, then a silica or alumina would be the first choice, if
the difference is in the position of a non-polar group, (e.g. a methyl group) then a C 
18 packing would be the first choice. 
Silica is an excellent general purpose adsorbent which is commercially available in a wide variety of useful forms. In addition, silica is nearly optimum from several aspects: it has little or no reactivity toward many sample types, it has high linear capacity and high efficiency. Only when a change in separational selectivity is required and when changes in the solvent are unable to provide for changes in selectivity- should the possibility of another adsorbent type be considered. This may be the case for unusually difficult separations where there are similar compounds or for mixtures containing a wide number of components. For example, the separation of cyclic aromatic hydrocarbons is done better on alumina than silica. 
The surface area of an adsorbent has an important effect on its chromatographic properties. To the first approximation, sample retention volumes and adsorption linear capacity are proportional to these surface area of the adsorbent. The commercial silicas have surface area from 300 to 400 square meters per gram. 
The size and geometry of the adsorbent play a critical role in separation. We know that a good column generally has a large number of theoretical plate at relative high flow rates without excessive pressure drops across the column. 
The water content of a polar adsorbent plays a critical role in affinity chromatography. It may be necessary to add some water to the adsorbent to increase the linear capacity to a usable value and to maximize the separational efficiency. Added water has been known to decrease the formation of static charge on the particle during packing. The water content of the adsorbent markedly affects the relative capacity values and band migration rates in separation and water content must be held constant for repeatable separations. Care must be taken that
the mobile phase does not remove this added water. It may be necessary to add water to the mobile phase to maintain equilibrium. 
QUANTITATION 
The goal of a quantitative analysis is a number , for example, a percentage or weight per volume of liquid. That number has certain desired characteristics including reproducibility, correctness, and often, speedy and easy acquisition. Toward that end, the analytical method utilized should be optimized for specificity, sensitivity and speed. The ease of this optimization with HPLC as the analutical method helps to make HPLC a strong and versatile quantitative tool. 
APPROACH TO A QUANTITATIVE PROBLEM 
The solution to a quantitative problem will vary according to particular requirements to the assay. However, there is a basic approach to the problem which is recommended. 
First, a chromatographic separation is required. A separation should be developed using standards for all compounds of interest, yielding baseline resolution between any two peaks. An ideal separation would have a resolution of about 1.5 between neighbouring peaks to insure good quantitation. 
The separation should have reproducible retention times usually better than =1% for successive injections. The peaks to be quantitated must be identified typically by the injection of standards to match retention times. Sometimes unknown peaks must be collected and identified by spectroscopy or some other qualitative analysis technique. 
A significant problem in quantitation in contamination of peaks by coeluting peaks. This gives a detector response that is larger than it would be if only the single compound were measured. The more complex the sample matrix the more
likely we are to see peak contamination, but even relative simple mixtures can have contaminated peaks. Guarding against this contamination is necessary to insure accurate answers. 
The detector response rationing has been used for many years as a method to find contaminated peaks. The most common way to measure peak ratios is to use two different wavelengths of UV absorption and ration the areas obtained on the peaks by integration. 
With the separation in hand, certain questions regarding requirements and limitations of the assay must be answered. Those questions include the following. 
1. Sample limitations 
2. Detection limits required 
a. sensitivity 
b. Linearity 
3. Precision requirements 
4. Accuracy requirements 
5. Number of analyses required per day 
6. Cost per analysis limitations 
METHOD VALIDATION 
It is a documented evidence which provides a high degree of assurance that a particular process will constantly produce the product meeting its all predetermined specifications and quality attributes. 
Once a separation has been developed with standards and the pertinent questions have been answered, the analyst’s work really begins. This work is method validation, and it is what sets a quantitative assay apart from any other applications. Method validation insures that the separation which has been developed will adequetly meet all criteria established for the particular assay.
Method validation starts with a calibration. The most common detectors used in HPLC respond in a linear fashion to a sample component’s concentration. That is, a plot of a component’s concentration versus detector response will give a straight line, intercepting the origin. The calibration curve can be generated using a number of techniques, two of which are internal standard calibration and external standard calibration. Linearity and sensitivity limits of the assay can be determined from the calibration curve. Also, once the calibration is established, accuracy and precision data can be compiled and evaluated. 
MEASUREMENT OF RESPONSE- PEAK HEIGHT Vs. PEAK AREA 
Once a separation has been developed and the method validated and optimized to meet the criteria of the quantitative problem, analysis of unknown can begin. Either peak heights or peak area will yield good data if peaks to be measured are well resolved from interference and are nearly guassian in shape. Peak heights would be preferred if working with the ruler, due to ease of measurement and simplicity of calculations. 
There are situations, however, where proper choice between height and area will positively influence the quantitation. Those applications involve chromatography which is less than ideal. For example, separations where k’ is not absolutely constant for peaks of interest should have response measurements by peak area. Variations in k’ will especially affect peak height. The area of the peak, however, will not be affected as much by such changes in k’. On the other hand, variations in flow rate will have a more adverse affect on peak area than on peak height. 
When chromatographic resolution is less than baseline, both precision and accuracy will suffer. Assuming that “less than perfect” resolution represents the best that could be attained for the problem at hand, the decision of whether to use peak area or height may significantly affect the quality of analytical results.
Furthermore, if peak area is chosen, the method selected for baseline correction can profoundly influence quantitation. 
Where the peaks of interest are relatively more minor peaks unresolved from a larger peak, or if peaks co-elute with a broad peak underneath, the choice is not as clear cut. Often in such cases, area measurements will prove superior if appropriate baseline corrections are applied. Selection of the best baseline correction technique will depend on somewhat subjective judgements by analyst, the validity of which will, in turn, depend substantially on knowledge of the sample under analysis. A figure of possible baseline corrections is shown below. 
HPLC METHOD DEVELOPMENT AND VALIDATION
The wide variety of equipment, columns, eluent and operational parameters involved makes high performance liquid chromatography (HPLC) method development seem complex. The process is influenced by the nature of the analytes and generally follows the following steps: 
• step 1 - selection of the HPLC method and initial system 
• step 2 - selection of initial conditions 
• step 3 - selectivity optimization 
• step 4 - system optimization 
• step 5 - method validation. 
Depending on the overall requirements and nature of the sample and analytes, some of these steps will not be necessary during HPLC analysis. For example, a satisfactory separation may be found during step 2, thus steps 3 and 4 may not be required. The extent to which method validation (step 5) is investigated will depend on the use of the end analysis; for example, a method required for quality control will require more validation than one developed for a one-off analysis. The following must be considered when developing an HPLC method: 
• keep it simple 
• try the most common columns and stationary phases first 
• thoroughly investigate binary mobile phases before going on to ternary 
• think of the factors that are likely to be significant in achieving the desired resolution. 
Mobile phase composition, for example, is the most powerful way of optimizing selectivity whereas temperature has a minor effect and would only achieve small selectivity changes. pH will only significantly affect the retention of weak acids and bases. A flow diagram of an HPLC system is illustrated in Figure 1.
HPLC method development Step 1 - selection of the HPLC method and initial system. 
When developing an HPLC method, the first step is always to consult the literature to ascertain whether the separation has been previously performed and if so, under what conditions - this will save time doing unnecessary experimental work. When selecting an HPLC system, it must have a high probability of actually being able to analyse the sample; for example, if the sample includes polar analytes then reverse phase HPLC would offer both adequate retention and resolution, whereas normal phase HPLC would be much less feasible. Consideration must be given to the following: 
Sample preparation.
Does the sample require dissolution, filtration, extraction, preconcentration or clean up? Is chemical derivatization required to assist detection sensitivity or selectivity? 
Types of chromatography. 
Reverse phase is the choice for the majority of samples, but if acidic or basic analytes are present then reverse phase ion suppression (for weak acids or bases) or reverse phase ion pairing (for strong acids or bases) should be used. The stationary phase should be C18 bonded. For low/medium polarity analytes, normal phase HPLC is a potential candidate, particularly if the separation of isomers is required. Cyano-bonded phases are easier to work with than plain silica for normal phase separations. For inorganic anion/cation analysis, ion exchange chromatography is best. Size exclusion chromatography would normally be considered for analysing high molecular weight compounds (.2000). 
Gradient HPLC. 
This is only a requirement for complex samples with a large number of components (.20–30) because the maximum number of peaks that can be resolved with a given resolution is much higher than in isocratic HPLC. This is a result of the constant peak width that is observed in gradient HPLC (in isocratic HPLC peak width increases in proportion to retention time). The method can also be used for samples containing analytes with a wide range of retentivities that would, under isocratic conditions, provide chromatograms with capacity factors outside of the normally acceptable range of 0.5–15. 
Gradient HPLC will also give greater sensitivity, particularly for analytes with longer retention times, because of the more constant peak width (for a given peak area, peak height is inversely proportional to peak width). Reverse phase gradient HPLC is commonly used in peptide and small protein analysis using an
acetonitrile–water mobile phase containing 1% trifluoroethanoic acid. Gradient HPLC is an excellent method for initial sample analysis. 
Column dimensions. 
For most samples (unless they are very complex), short columns (10–15 cm) are recommended to reduce method development time. Such columns afford shorter retention and equilibration times. A flow rate of 1-1.5 mL/min should be used initially. Packing particle size should be 3 or 5 μm. 
Detectors. 
Consideration must be given to the following: 
• Do the analytes have chromophores to enable UV detection? 
• Is more selective/sensitive detection required (Table I)? 
• What detection limits are necessary? 
• Will the sample require chemical derivatization to enhance detectability and/or improve the chromatography?
Fluorescence or electrochemical detectors should be used for trace analysis. For preparative HPLC, refractive index is preferred because it can handle high concentrations without overloading the detector. 
UV wavelength. 
For the greatest sensitivity λmax should be used, which detects all sample components that contain chromophores. UV wavelengths below 200 nm should be avoided because detector noise increases in this region. Higher wavelengths give greater selectivity. 
Fluorescence wavelength. 
The excitation wavelength locates the excitation maximum; that is, the wavelength that gives the maximum emission intensity. The excitation is set to the maximum value then the emission is scanned to locate the emission intensity. Selection of the initial system could, therefore, be based on assessment of the nature of sample and analytes together with literature data, experience, expert system software and empirical approaches. 
Step 2 - selection of initial conditions. 
This step determines the optimum conditions to adequately retain all analytes; that is, ensures no analyte has a capacity factor of less than 0.5 (poor retention could result in peak overlapping) and no analyte has a capacity factor greater than 10–15 (excessive retention leads to long analysis time and broad peaks with poor detectability). Selection of the following is then required. 
Mobile phase solvent strength. 
The solvent strength is a measure of its ability to pull analytes from the column. It is generally controlled by the concentration of the solvent with the
highest strength; for example, in reverse phase HPLC with aqueous mobile phases, the strong solvent would be the organic modifier; in normal phase HPLC, it would be the most polar one. The aim is to find the correct concentration of the strong solvent. With many samples, there will be a range of solvent strengths that can be used within the aforementioned capacity limits. Other factors (such as pH and the presence of ion pairing reagents) may also affect the overall retention of analytes. 
Gradient HPLC. 
With samples containing a large number of analytes (.20–30) or with a wide range of analyte retentivities, gradient elution will be necessary to avoid excessive retention. 
Determination of initial conditions. 
The recommended method involves performing two gradient runs differing only in the run time. A binary system based on either acetonitrile/water (or aqueous buffer) or methanol/water (or aqueous buffer) should be used. 
Step 3 - selectivity optimization. 
The aim of this step is to achieve adequate selectivity (peak spacing). The mobile phase and stationary phase compositions need to be taken into account. To minimize the number of trial chromatograms involved, only the parameters that are likely to have a significant effect on selectivity in the optimization must be examined. To select these, the nature of the analytes must be considered. For this, it is useful to categorize analytes into a few basic types (Table II). 
Once the analyte types are identified, the relevant optimization parameters may be selected (Table III). Note that the optimization of mobile phase parameters is always considered first as this is much easier and convenient than stationary phase optimization.
Selectivity optimization in gradient HPLC. 
Initially, gradient conditions should be optimized using a binary system based on either acetonitrile/water (or aqueous buffer) or methanol/water (or aqueous buffer). If there is a serious lack of selectivity, a different organic modifier should be considered. 
Step 4 - system parameter optimization. 
This is used to find the desired balance between resolution and analysis time after satisfactory selectivity has been achieved. The parameters involved include column dimensions, column-packing particle size and flow rate. These parameters may be changed without affecting capacity factors or selectivity. 
Step 5 - method validation. 
Proper validation of analytical methods is important for pharmaceutical analysis when ensurance of the continuing efficacy and safety of each batch manufactured relies solely on the determination of quality. The ability to control this quality is dependent upon the ability of the analytical methods, as applied
under well-defined conditions and at an established level of sensitivity, to give a reliable demonstration of all deviation from target criteria. 
Analytical method validation is now required by regulatory authorities for marketing authorizations and guidelines have been published. It is important to isolate analytical method validation from the selection and development of the method. Method selection is the first step in establishing an analytical method and consideration must be given to what is to be measured, and with what accuracy and precision. 
Method development and validation can be simultaneous, but they are two different processes, both downstream of method selection. Analytical methods used in quality control should ensure an acceptable degree of confidence that results of the analyses of raw materials, excipients, intermediates, bulk products or finished products are viable. Before a test procedure is validated, the criteria to be used must be determined. 
Analytical methods should be used within good manufacturing practice (GMP) and good laboratory practice (GLP) environments, and must be developed using the protocols set out in the International Conference on Harmonization (ICH) guidelines (Q2A and Q2B). The US Food and Drug Administration (FDA) and US Pharmacopoeia (USP) both refer to ICH guidelines. The most widely applied validation characteristics are accuracy, precision (repeatability and intermediate precision), specificity, detection limit, quantitation limit, linearity, range, robustness and stability of analytical solutions. Method validation must have a written and approved protocol prior to use.
 Approach 
• Literature survey 
• Techniques employed 
 Titrimetric and Spectrophotometric 
 Chromatographic etc. 
Literature Survey 
• In depth study of literature survey is essential prior to proceeding further on the subject. 
• Literature survey provides important inputs with respect to chemical and physical properties of the individual ingredients. 
• Literature survey also provides important information about the previous published data on the same or structurally similar compounds and their behavior under given set of conditions 
Techniques Employed 
 Analytical techniques that are commonly applied and reported in the literature reports are 
• Titrimetric 
• Spectrophotometric 
• Chromatographic 
 Titrimetric and Spectrophotometric 
• Objective is to analyze API in presence of excipients, additives, degradation products, impurities, etc. 
• Non-specific assays (use of conventional techniques) 
• For Spectrophotometric assays, sometimes derivative spectroscopy used 
• These techniques therefore, are supported by HPTLC studies to cover degradation products, impurities and other interfering substances 
 Method development in HPLC : 
 When should be HPLC selected as analytical method?
• Prerequisite for HPLC analysis: 
• Sample must be soluble in solvent / water 
• HPLC is the method of choice for the analysis of: 
 Non-volatile substances ( for volatile substances GC is an alternative) 
 Substances with high polarity or ionic samples 
 Substances with high molecular weight. 
 Thermally instable and decomposable substances. 
 Important chemical and physical properties of sample compounds are: 
• Molecular weight 
• Formula 
• Acid / base properties ( pk-values) 
• Solubility in water / in organic solvents 
• UV-spectrum. 
 Sample preparation methods: 
• Filtration 
• Centrifugation 
• Concentration 
• Evaporation 
• Dilution 
• Liquid-liquid-Extraction 
• Solid phase extraction 
• derivatization 
• decomposition 
 Selection for suitable chromatography method for organic compounds: 
• First reversed phase should be tried 
• If reversed phase is not successful, Reversed phase with pH control should be tried. (+/- 1.5 its pKa value) 
• If Reversed phase with pH control is not successful, then normal phase should be considered.
• If normal phase is not successful, try with ion exchange / with ion pair reagent. 
Eluents 
 Acetonitrile is the preferred organic solvent because of low viscosity and high uv - transparency (If pure) 
 Disadvantages: Poisonous! Expensive! 
AAqquueeoouuss EElluueennttss 
WWaatteerr 
FFoorr NNeeuuttrraall ccoommppoouunndd 
1100mmMM HH33PPOO44 PPHH 22.. 
FFoorr wweeaakk ttoo mmeeddiiuumm aacciiddss ((IIoonn ssuupppprreessssiioonn)) 
1100mmMM PPhhoosspphhaattee PPHH 44..00 
FFoorr wweeaakk ttoo mmeeddiiuumm aacciiddss ((IIoonn ssuupppprreessssiioonn)) ((PPaarrttllyy IIoonn ssuupppprreessssiioonn)) 
1100mmMM PPhhoosspphhaattee PPHH 77..55 
FFoorr wweeaakk ttoo mmeeddiiuumm bbaasseess oorr aacciidd iinn iioonniizzaattiioonn ffoorrmm 
 Developing the analytical method for a single component formulation is relatively easy and is a less painstaking exercise . 
 Multi-components in drug product may differ in their 
• Chemical and physical characteristics such as: 
 Absorptivities 
 Solubilities 
 Stability with respect to pH and temperature 
 pKa and pKb 
 Polarity 
• Compatibility with mobile phase 
• Concentration
Ionic Nature Of The Components 
• Use reversed phase column with buffered mobile phase. 
• Adjust mobile phase strength (mM) to provide an acceptable K’ (capacity factor) range using gradient elution 
• Arrive at isocratic mobile phase (may not be feasible in all the cases) 
Typical Challenges in HPLC Method Development 
 Developing the analytical method for a single component formulation is relatively easy and is a less painstaking exercise . 
 Multi-components in drug product may differ in their 
• Chemical and physical characteristics such as: 
 Absorptivities 
 Solubilities 
 Stability with respect to pH and temperature 
 pKa and pKb 
 Polarity 
• Compatibility with mobile phase 
• Concentration
Ionic Nature Of The Components 
 Study chromatographic behavior: 
• With buffered mobile phases and reversed-phase column 
• Adjust mobile phase strength (mM) to provide an acceptable K’ (capacity factor) range using gradient elution 
• Arrive at isocratic mobile phase (may not be feasible in all the cases) 
Parameters Controlling Selectivity 
1. pH 
2. Solvent strength 
3. Solvent type 
4. Temperature 
5. Buffer concentration 
6. Amine/Ionic modifiers 
7. Column type 
Parameters Controlling Selectivity 
pH 
 Change in pH influences K’/separation between closely eluting components 
 Carry out experiments at different pH values (extremes of low and high pH) and select the best option w.r.t. K’ and separation 
Solvent Strength (percentage) 
 Change in solvent composition influences K’/separation
 Carry out experiments at different solvent strengths and select the best option w.r.t. K’ and separation 
Solvent type 
 Commonly used solvents: methanol, acetonitrile, THF 
 Methanol is preferred since most buffers have greater solubility in methanol/water mixture than in ACN or THF. 
 Common challenges faced with acetonitrile and THF: 
• Acetonitrile: trace amount of amines may/may not influence the separation 
• THF: can form peroxides on storage which can impact the separation process. 
Buffer concentration 
 Increase in buffer concentrations selectively decreases the retention of all cationic sample ions 
 Silanol ionization is not reproducible from one batch of column to another 
Amine modifiers 
 Improve the peak shape of basic components 
 Retention of basic components will decrease with increase in concentration of amines 
Column Type 
 Columns of different types have different selectivities. 
 Can be used in conjunction with the previous parameters 
Different Absorptivities 
 Determine the maxima for each component in the sample 
 Multi- wavelength detection using dual λ or PDA detector 
 For molecules with low absorptivities, use greater path length of detector cell 
 For components not having UV absorbance, the following detectors can be used… 
 Fluorescence 
 RI 
 ECD 
 MS
 The above can be used in series with an UV detector 
Different Solubilities 
 Solid phase extraction 
 Liquid liquid extraction 
Different Concentrations 
 Solid phase extraction 
 Liquid liquid extraction 
 Gradient elution 
 Multi- wavelength detection using dual λ or PDA detector 
 For molecules with different concentrations, use different detectors in combination 
Developing A Separation 
 A reversed phase example 
 Isocratic method development technique 
 Excedrin brand analgesic and salicylamide 
• Caffeine 
• Acetaminophen 
• Aspirin 
• Salicylamide 
 Select a column 
• C18, C8, etc. 
• Non end capped / end capped / highly functionalized / embedded polar group 
• Short columns are good for fast screening of separation conditions. 
 Knowledge of Sample components / Molecular structure information to choose bonded phase characteristics such as bonding chemistry, bonding mode, end capping and carbon load. 
 Sample retention on the column is a product of chemical interactions.
 Understanding of separation goals to choose column and particle physical characteristics , column bed dimensions, particle shape, particle size, surface area and pore size. 
 Select an initial mobile phase. 
• Sample solubility 
• Compatible with the detector 
• typically a blend of a “strong” eluent and a “weak” eluent 
 Always choose a mobile phase that is too strong for the first try. 
 Other important considerations. 
• Will your detector see the components? 
• How much sample should I inject? 
• How good does the separation have to be? 
• How fast does the separation have to be? 
• How much time do you have to experiment? 
 Our first goal is to adjust the mobile phase strength to elute the sample components at a reasonable k’ 
• Use a high flow rate - k’ is independent of flow rate. 
• Use a short column - k’ is independent of column length. 
• This allows a relatively fast experiment. 
 Experimental conditions: 
• Symmetry C18 column, 50 x 4.6 mm 
• Methanol and phosphate/acetate buffer, 1.5 ml / min. (about 3 column volumes / min) 
• Alliance 2690 Separation Module 
• UV detection at 250 nm. 
 2.5 minutes for new mobile phase to wash through. 
 5 minute chromatogram = k’ of almost 15 
 With optimized k’s, we can look at the selectivity of the separation.
 If necessary we can change the mobile phase or the column to change the selectivity. 
Initial Run with 80% methanol : 20% Buffer 
During first run, mobile phase used is 80 %methanol and 20% buffer.
AU 0.000.200.400.600.801.001.201.401.601.80Minutes0.501.001.502.002.503.003.504.004.505.00 
All the components and the solvent peak elute out at same retention time. Now we will change mobile phase composition and will try to get better separation 
Now Methanol Concentration changed form 60 % to 50% so we found better resolution of three compounds.
AU 0.000.501.001.50 AU 0.000.501.001.50Minutes0.501.001.502.002.503.003.504.00
Achieving Separation 
Now Methanol Concentration changed form 60 % to 50% so we found better resolution of three compounds 
AU 0.000.501.001.50 AU 0.000.501.001.50Minutes0.501.001.502.002.503.003.504.00 
HPLC TROUBLESHOOTINGS
GAS CHROMATOGRAPHY 
COLUMN SELECTION GUIDE FOR GC 
Here the main question arises is how to choose the column for a particular compound? Different types of columns are available having different composition, polarity and temperature limits. Depending upon the polarity and chemical nature of the compound, a suitable column is selected meeting its maximum criteria. Each type of column has some applications for which it is used are given below. 
1. ZB-1 (Manufactured by Phenomenex-USA) 
MATERIAL 
POLARITY 
TEMP. LIMITS 
100% dimethylpolysiloxane 
Low 
-60o to 370o C 
APPLICATIONS 
Amines Drugs of abuse Ethanol 
Essential oils Gases (refinery, noble) Hydrocarbons 
MTBE Natural gas odorants Oxygenates 
Pesticides PCB’s Semi-volatiles 
Simulated distillation Solvent impurities Sulfur compounds 
2. ZB-5 (Manufactured by Phenomenex-USA) 
MATERIAL 
POLARITY 
TEMP. LIMITS 
5%-phenyl-95%- dimethylpolysiloxane 
Low 
-60o to 370o C 
APPLICATIONS
Alkaloids Drugs FAMEs 
Halo-hydrocarbons Phenols Pesticides/Herbicides 
Essential oils PCBs/Aroclors Residual solvents 
3. ZB-35 (Manufactured by Phenomenex-USA) 
MATERIAL 
POLARITY 
TEMP. LIMITS 
35%-phenyl-65%- dimethylpolysiloxane 
Medium 
50o to 360o C 
APPLICATIONS 
Aroclors Amines Pesticides 
Pharmaceuticals Semi-volatiles 
4. ZB-50 (Manufactured by Phenomenex-USA) 
MATERIAL 
POLARITY 
TEMP. LIMITS 
50%-phenyl-50%- dimethylpolysiloxane 
Medium 
40o to 340o C 
APPLICATIONS 
Basic drugs Glycols Pesticides/Herbicides 
Steroids Antidepressants 
5. ZB-624 (Manufactured by Phenomenex-USA)
MATERIAL 
POLARITY 
TEMP. LIMITS 
6%-cyanopropylphenyl- 94%- dimethylpolysiloxane 
Medium 
-20o to 260o C 
APPLICATIONS 
Volatile Organic Compounds 
6. ZB-1701 (Manufactured by Phenomenex-USA) 
MATERIAL 
POLARITY 
TEMP. LIMITS 
14%-cyanopropylphenyl- 86%- dimethylpolysiloxane 
Medium 
-20o to 300o C 
APPLICATIONS 
Pesticides/Herbicides PCBs Alcohols 
Aromatic hydrocarbons Organic acid PAHs 
Phenols Steroids Tranquilizers 
7. ZB-WAX (Manufactured by Phenomenex-USA) 
MATERIAL 
POLARITY 
TEMP. LIMITS 
Polyethylene glycol (PEG) 
High 
20o to 260o C 
APPLICATIONS
Free acids Alcohols Aldehydes 
Aromatics Essential oils Flavors/Fragrances 
Glycols Pharmaceuticals Solvents 
Styrene Xylenes OVIs 
8. ZB-FFAP (Manufactured by Phenomenex-USA) 
MATERIAL 
POLARITY 
TEMP. LIMITS 
Nitroterephthalic acid modified Polyethylene glycol (PEG) 
High 
40o to 260o C 
APPLICATIONS 
Acrylates FAMEs Volatile free acid 
Alcohols Organic acids Phenols 
Aldehydes Ketones Flavors/Fragrances 
GC METHOD DEVELOPMENT
INITIAL STEPS 
 First of all check the nature of the compound i.e. whether it is volatile or non-volatile. 
 If it is volatile then check the melting point/ boiling point of the compound. 
 If the melting point/ boiling point is not observed, then find it out by melting point/ boiling point apparatus. 
 Note down the melting point/ boiling point of each compound. 
SET GC PARAMETERS 
 Temperature sequence is always in the increasing order of Oven, Injector and Detector (OID). 
 Oven temperature is set 15oC to 20oC higher than the melting point/ boiling point of the compound. 
 The reason of keeping the oven temperature higher than the melting point/ boiling point of the compound is to volatilize compound easily. 
 Injector temperature has to be kept higher than that of the oven temperature and furthermore, detector temperature has to be kept higher or equal to the injector temperature. 
 The reason to keep detector temperature higher or equal to the injector temperature is that the analyte should be converted back to its original form i.e. liquid form and should remain in vapour form so that it can be eluted easily from the column up to the detector. 
METHOD OF ANALYSIS 
ISOTHERMAL ANALYSIS
Set the oven at one fixed temperature and run the sample mixture. Observe the pattern of the peaks in the chromatogram 
TEMPERATURE PROGRAMMING 
Set the range in oven temperature according to the melting point/ boiling point of the compounds in the mixture. Set the increase in temperature (oC/min). Run the sample mixture and observed the pattern of the peaks in the chromatogram. Observe the difference in temperature programming as compared to isothermal analysis. 
GC TROUBLESHOOTINGS 
OBSERVATION 
POSSIBLE CAUSE 
SOLUTION
A. Baseline Drifting 
1. Accumulation of stationary phase. 
1. Remove the end section of the column. 
2. Carrier gas cylinder pressure too low to allow control. 
2. Replace the carrier gas cylinder. Increase the pressure. 
3. Drifting carrier gas or combustion gas flows. 
3. Check the gas controllers. 
4. Accumulation of impurities in the column. 
4. Check impurity levels in the gas source. Use correct gas purity. 
B. Baseline Falling 
1. Carrier gas leak in the system. 
1. Perform a leak test. 
2. Column is baking out. 
2(a). Check the tightness of the connections on the carrier gas line. 
2(b). Allow enough time for the column to stabilize. 
C. Baseline Falling Away After a High Initial Value 
1. Purge valve left closed during acquisition. 
1. Alter the GC program. See your GC user manual for details. 
2. Inadequate purge flow rate. 
2. Increase the purge flow rate.
3. Purge valve left closed for too long. 
3. Shorten the purge time. 
4. Solvent tail peak. 
4. Increase the solvent delay. Shorten the purge time. 
5. Pre-filters are dirty. (When using a quadrupole MS detector). 
5. Contact your service representative. 
D. Baseline Rising 
1. Accumulation of impurities in the column. 
1. Check impurity levels in the gas source. Use correct gas purity. 
2. Contaminated detector. 
2. Check the detector and clean it. 
3. There is bleeding from the GC column. 
3. Condition column. Change the column 
4. Air is leaking into the system. 
4. Trace and repair the leak. 
E. Baseline Rising Under Temperature Program Control 
1. Column contaminated. 
1. Recondition the column. 
F. Baseline High Standing Current 
1. Carrier gas flow rate too high. 
1. Reduce the carrier gas flow. 
2. Column 
2. Recondition the
contaminated. 
column. 
3. Contaminated gases. 
3. Replace gas cylinders. Replace the gas filters. 
4. Excessive column stationary phase bleeding. 
4. Check the oven temperature, ensuring that it doesn’t exceed the column upper limit. Recondition the column. Replace the column. 
5. Loose connections. 
5. Ensure that all interconnections and screw connections are tight. 
G. Baseline Irregular Shape: S-Shaped 
1. Excessive column bleed during column temperature programming. 
1. Check the tightness of the connections on the carrier gas line. 
2. Oxygen contamination is decomposing the stationary phase. 
2. Install oxygen filters in the carrier gas line. Check the pneumatic and inlet systems for leaks. Use correct gas purity with low oxygen content.
H. Baseline High Frequency Noise 
1. Contaminated detector. 
1. Check the detector and clean it. 
2. Combustion gas flow too low or too high. 
2. Check the detector gas flows. 
3. Column contaminated. 
3. Condition the column. 
4. Contaminated detector gas supply. 
4. Check the gas purity and install appropriate filters. 
5. Detector temperature higher than column maximum temperature. 
5. Reduce the detector temperature to the column temperature upper limit. 
6. Loose column fittings. 
6. Tighten fittings accordingly. 
I. Baseline Spiking 
1. Column too close to flame. (When using an FID) 
1. Lower the column to the correct position (2- 3 mm below the tip of the jet). 
2. Dirty jet or detector. 
2. Isolate the detector from the electronics. If the spiking disappears, clean the jet and the collector. 
3. FID temperature too 
3. Increase the FID
low. (When using an FID) 
temperature to at least 150 °C. 
J. Peaks Broadening 
1. Column flow too high. 
1. Reduce the flow to slightly above optimum. 
2. Column flow too low. 
2. Increase the flow to slightly above optimum. 
3. Split flow too low in split injection. 
3. Increase the flow to 40 - 50 mL/min. 
4. Column performances degraded. 
4. Test the column at the optimum flow rate. 
5. Dirty injector. 
5. Clean or replace the liner. 
6. Stationary phase accumulated in the outlet. 
6. Remove the last two coils from the column. 
7. Detector base body temperature too low. 
7. Increase the temperature to 5 °C below the column maximum. 
8. The sample is overloading the column. 
8. Reduce the amount and/or concentration of the sample. 
K. Double Peaks 
1. Injection speed too low. 
1. Inject more rapidly in a smooth motion.
2. Wrong autosampler injection speed or mode. 
2. Use a higher speed. 
L. Peak Fronting 
1. Column or detector overloaded. 
1. Decrease the injected amount. Decrease the analyte concentrations. Increase the split ratio. 
2. Column temperature too low. 
2. Increase the temperature. 
3. Stationary phase too thin. 
3. Use a thicker-film column. 
4. Poor injection technique. 
4. Repeat, with better injection technique. 
M. Ghost Peaks 
1. Contaminated carrier gas. 
1. Replace the cylinder. Replace the filter. 
2. Contamination from laboratory glassware. 
2. Ensure the glassware is clean and contamination-free. 
3. Decomposition of injected sample. 
3. Decrease the injection port temperature. Use the on-column injection technique. 
4. Dirty injection 
4. Carry out adequate clean-up of sample
solution. 
prior to injection. 
N. Sample Peak Tailing 
1. Column degradation causing activity. 
1. Inject a test mixture and evaluate the column. 
2. Column/oven temperature too low. 
2. Increase the column/oven temperature. Do not exceed the recommended maximum temperature for the stationary phase. 
3. Dirty liner. 
3. Clean or replace the liner. 
4. Glass wool or inlet liner causing activity. 
4. Replace with fresh silanized wool and a clean inlet liner. 
5. FID flame is out. 
5. Light the flame. 
6. Inlet temperature too low. 
6. Increase the inlet temperature. 
7. Poor or obstructed column connections. 
7. Remake the column inlet connection. 
8. Wrong stationary phase. 
8. Replace the column according to the column manufacturer’s
literature. 
O. Broad Ghost Peaks 
1. Contaminated inlet or pneumatics. 
1. Remove the column and bake out the inlet. Use a high-quality septum. Replace the split vent filter. Install an in-line filter between the pneumatics and the inlet. 
2. Incomplete elution of previous sample. 
2. Increase the final oven program temperature or total run time. Increase the column flow rate. 
P. Solvent Peak Tailing 
1. Incorrect column position in inlet. 
1. Reinstall the column. 
2. Initial oven temperature too high (On Column). 
2. Reduce the initial oven temperature. 
3. Septum purge flow too low and/or split/splitless vent flow too low. 
3. Check and adjust the septum purge and vent flows. 
4. Too large injection size. 
4. Reduce the injection size.
EXERCISE FOR GC METHOD DEVELOPMENT
Method of Analysis 
Product name 
Mixture 
Test to be performed 
To separate the components from the mixture 
Analysis as per 
In house specification 
GC Parameter: 
Column 
2m-10% SE-30, SIGMA (BARODA) 
Mobile phase 
(Carrier gas) 
Nitrogen gas (UHP) 
Flow rate 
15 kg/cm2 
Oven temperature 
temperature programming given (550-1900C) 
Injector temperature 
150°C 
Detector temperature 
200°C 
Injection volume 
0.1 μl. 
Run time 
Approx. 12min. 
Procedure 
Inject 0.1 μl of the sample mixture and observe the chromatogram. 
To perform the given exercise the following steps should be taken for effective method development. 
STEP#1 
Solvents taken under consideration : Methanol
Benzene 
Toluene 
O-xylene 
N, N-dimethyl aniline 
STEP#2 
Check the melting point/ boiling point of each solvent. 
STEP#3 
If not observed, then check it by melting point/ boiling point apparatus. 
STEP#4 
Note down the melting point/ boiling point of each compound. 
1. Methanol- 640-660C 
2. Benzene- 790-810C 
3. Toluene- 1090-1120C 
4. O-xylene- 1420-1450C 
5. N, N-dimethyl aniline- 1910-1950C 
STEP#5 
SAMPLE MIXTURE PREPARATION
Take two drops of each solvent in a clean dry test tube. Mix properly until a clear solution is observed. 
STEP#6 
SET GC PARAMETERS 
Column : 2m-10% SE-30, SIGMA (BARODA) 
Oven temperature : temperature programming given (550-1900C) 
Injector temperature : 1500C 
Detector temperature : 2000C 
Air flow : 10 kg/cm2 
H2 flow : 1 kg/cm2 
N2 flow : 15 kg/cm2 
Sample injection volume : 0.1 μl 
STEP#7 
Inject 0.1 μl of sample mixture under temperature programming (550-1900C) and observe the elution pattern (peaks) in the chromatogram.
Method development

More Related Content

What's hot

Reverse phase chromatography
Reverse phase chromatographyReverse phase chromatography
Reverse phase chromatographyfaixan_live
 
Counter current extraction
Counter current extractionCounter current extraction
Counter current extractionLucky chouhan
 
Column chromatography
Column chromatography Column chromatography
Column chromatography Sabahat Ali
 
Column Chromatography ppt
Column Chromatography pptColumn Chromatography ppt
Column Chromatography pptshaisejacob
 
HPLC- high performance liquid chromatography
HPLC- high performance liquid chromatographyHPLC- high performance liquid chromatography
HPLC- high performance liquid chromatographyhirenthakkar4
 
CHROMATOGRAPHY-PRINCIPLE, TYPES
CHROMATOGRAPHY-PRINCIPLE, TYPESCHROMATOGRAPHY-PRINCIPLE, TYPES
CHROMATOGRAPHY-PRINCIPLE, TYPESAYESHA KABEER
 
Optimum Performance Laminar Chromatography (OPLC)
Optimum Performance Laminar Chromatography (OPLC) Optimum Performance Laminar Chromatography (OPLC)
Optimum Performance Laminar Chromatography (OPLC) D.R. Chandravanshi
 
Chromatographic Column chemistry
Chromatographic Column chemistryChromatographic Column chemistry
Chromatographic Column chemistrykiranreddy munnangi
 
instrumentation of HPLC
instrumentation of HPLCinstrumentation of HPLC
instrumentation of HPLCsamiya shaik
 
Instrumentation Of HPLC
Instrumentation Of HPLCInstrumentation Of HPLC
Instrumentation Of HPLCmddwivedi
 
Nano liquid chromatography (ncl)
Nano liquid chromatography (ncl)Nano liquid chromatography (ncl)
Nano liquid chromatography (ncl)Tushar Borate
 
High Performance Liquid Chromatography HPLC
High Performance Liquid Chromatography HPLCHigh Performance Liquid Chromatography HPLC
High Performance Liquid Chromatography HPLCijtsrd
 
Herbal drugs and fingerprints
Herbal drugs and fingerprintsHerbal drugs and fingerprints
Herbal drugs and fingerprintsSpringer
 
Columnchromatography
ColumnchromatographyColumnchromatography
ColumnchromatographyMahendra G S
 
amino acid paper chromotography lab
amino acid paper chromotography labamino acid paper chromotography lab
amino acid paper chromotography labDr Robert Craig PhD
 

What's hot (20)

Reverse phase chromatography
Reverse phase chromatographyReverse phase chromatography
Reverse phase chromatography
 
Counter current extraction
Counter current extractionCounter current extraction
Counter current extraction
 
Column chromatography
Column chromatography Column chromatography
Column chromatography
 
Column Chromatography ppt
Column Chromatography pptColumn Chromatography ppt
Column Chromatography ppt
 
HPLC- high performance liquid chromatography
HPLC- high performance liquid chromatographyHPLC- high performance liquid chromatography
HPLC- high performance liquid chromatography
 
CHROMATOGRAPHY-PRINCIPLE, TYPES
CHROMATOGRAPHY-PRINCIPLE, TYPESCHROMATOGRAPHY-PRINCIPLE, TYPES
CHROMATOGRAPHY-PRINCIPLE, TYPES
 
HPLC
HPLCHPLC
HPLC
 
Basic of Chromatography
Basic of ChromatographyBasic of Chromatography
Basic of Chromatography
 
Optimum Performance Laminar Chromatography (OPLC)
Optimum Performance Laminar Chromatography (OPLC) Optimum Performance Laminar Chromatography (OPLC)
Optimum Performance Laminar Chromatography (OPLC)
 
Column chromatography
Column chromatographyColumn chromatography
Column chromatography
 
Chromatographic Column chemistry
Chromatographic Column chemistryChromatographic Column chemistry
Chromatographic Column chemistry
 
instrumentation of HPLC
instrumentation of HPLCinstrumentation of HPLC
instrumentation of HPLC
 
Instrumentation Of HPLC
Instrumentation Of HPLCInstrumentation Of HPLC
Instrumentation Of HPLC
 
Partition Chromatography
Partition ChromatographyPartition Chromatography
Partition Chromatography
 
Nano liquid chromatography (ncl)
Nano liquid chromatography (ncl)Nano liquid chromatography (ncl)
Nano liquid chromatography (ncl)
 
High Performance Liquid Chromatography HPLC
High Performance Liquid Chromatography HPLCHigh Performance Liquid Chromatography HPLC
High Performance Liquid Chromatography HPLC
 
Herbal drugs and fingerprints
Herbal drugs and fingerprintsHerbal drugs and fingerprints
Herbal drugs and fingerprints
 
Columnchromatography
ColumnchromatographyColumnchromatography
Columnchromatography
 
amino acid paper chromotography lab
amino acid paper chromotography labamino acid paper chromotography lab
amino acid paper chromotography lab
 
Chromatography,
Chromatography,Chromatography,
Chromatography,
 

Viewers also liked

Cheminformatics in drug design
Cheminformatics in drug designCheminformatics in drug design
Cheminformatics in drug designSurmil Shah
 
Cheminformatics in R
Cheminformatics in RCheminformatics in R
Cheminformatics in RRajarshi Guha
 
เธ‡เธฒเธ™เธ„เธญเธก (1)
เธ‡เธฒเธ™เธ„เธญเธก (1)เธ‡เธฒเธ™เธ„เธญเธก (1)
เธ‡เธฒเธ™เธ„เธญเธก (1)Noot Ting Tong
 
Irregularverbs1stgrade2
Irregularverbs1stgrade2Irregularverbs1stgrade2
Irregularverbs1stgrade2Leonimoyano
 
Amish and health issues a
Amish and health issues aAmish and health issues a
Amish and health issues asharonbella
 
เธ‡เธฒเธ™เธ„เธญเธก (2)
เธ‡เธฒเธ™เธ„เธญเธก (2)เธ‡เธฒเธ™เธ„เธญเธก (2)
เธ‡เธฒเธ™เธ„เธญเธก (2)Noot Ting Tong
 
Airu nebhe webinar 8 16-2012 final
Airu nebhe webinar 8 16-2012 finalAiru nebhe webinar 8 16-2012 final
Airu nebhe webinar 8 16-2012 finalMChan_NEBHE
 
CSR Public Value and the Business of Politics
CSR Public Value and the Business of PoliticsCSR Public Value and the Business of Politics
CSR Public Value and the Business of PoliticsDr. Miya Burt-Stewart
 
โครงการก่อสร้างงานภูมิทัศน์ สวนเทิดพระเกียรติ ราชพฤกษ์ จังหวัดเชียงใหม่
โครงการก่อสร้างงานภูมิทัศน์ สวนเทิดพระเกียรติ ราชพฤกษ์ จังหวัดเชียงใหม่โครงการก่อสร้างงานภูมิทัศน์ สวนเทิดพระเกียรติ ราชพฤกษ์ จังหวัดเชียงใหม่
โครงการก่อสร้างงานภูมิทัศน์ สวนเทิดพระเกียรติ ราชพฤกษ์ จังหวัดเชียงใหม่kenijikendo
 
Mικρασιατικη καταστροφη
Mικρασιατικη καταστροφηMικρασιατικη καταστροφη
Mικρασιατικη καταστροφηjpapoglou
 
Sanchez t presentation
Sanchez t presentationSanchez t presentation
Sanchez t presentationtsanchez012
 
Removal of Corruption-Empowering the citizens
Removal of Corruption-Empowering the citizensRemoval of Corruption-Empowering the citizens
Removal of Corruption-Empowering the citizensBhaumik Sheth
 
เธ‡เธฒเธ™เธ„เธญเธก (1)
เธ‡เธฒเธ™เธ„เธญเธก (1)เธ‡เธฒเธ™เธ„เธญเธก (1)
เธ‡เธฒเธ™เธ„เธญเธก (1)Noot Ting Tong
 
τι υπάρχει πίσω από την κουρτίνα;
τι υπάρχει πίσω από την κουρτίνα;τι υπάρχει πίσω από την κουρτίνα;
τι υπάρχει πίσω από την κουρτίνα;jpapoglou
 

Viewers also liked (20)

Cheminformatics in drug design
Cheminformatics in drug designCheminformatics in drug design
Cheminformatics in drug design
 
Cheminformatics in R
Cheminformatics in RCheminformatics in R
Cheminformatics in R
 
เธ‡เธฒเธ™เธ„เธญเธก (1)
เธ‡เธฒเธ™เธ„เธญเธก (1)เธ‡เธฒเธ™เธ„เธญเธก (1)
เธ‡เธฒเธ™เธ„เธญเธก (1)
 
Irregularverbs1stgrade2
Irregularverbs1stgrade2Irregularverbs1stgrade2
Irregularverbs1stgrade2
 
US capitalism a tarnished model
US capitalism a tarnished modelUS capitalism a tarnished model
US capitalism a tarnished model
 
Mc2012 sue smith
Mc2012 sue smithMc2012 sue smith
Mc2012 sue smith
 
ปราสาทหินพิมาย
ปราสาทหินพิมายปราสาทหินพิมาย
ปราสาทหินพิมาย
 
Amish and health issues a
Amish and health issues aAmish and health issues a
Amish and health issues a
 
เธ‡เธฒเธ™เธ„เธญเธก (2)
เธ‡เธฒเธ™เธ„เธญเธก (2)เธ‡เธฒเธ™เธ„เธญเธก (2)
เธ‡เธฒเธ™เธ„เธญเธก (2)
 
Airu nebhe webinar 8 16-2012 final
Airu nebhe webinar 8 16-2012 finalAiru nebhe webinar 8 16-2012 final
Airu nebhe webinar 8 16-2012 final
 
CSR Public Value and the Business of Politics
CSR Public Value and the Business of PoliticsCSR Public Value and the Business of Politics
CSR Public Value and the Business of Politics
 
Blog
BlogBlog
Blog
 
สังคมศึกษาศาสนาและวัฒนธรรม ม.1 เสียดินแดน
สังคมศึกษาศาสนาและวัฒนธรรม ม.1 เสียดินแดนสังคมศึกษาศาสนาและวัฒนธรรม ม.1 เสียดินแดน
สังคมศึกษาศาสนาและวัฒนธรรม ม.1 เสียดินแดน
 
โครงการก่อสร้างงานภูมิทัศน์ สวนเทิดพระเกียรติ ราชพฤกษ์ จังหวัดเชียงใหม่
โครงการก่อสร้างงานภูมิทัศน์ สวนเทิดพระเกียรติ ราชพฤกษ์ จังหวัดเชียงใหม่โครงการก่อสร้างงานภูมิทัศน์ สวนเทิดพระเกียรติ ราชพฤกษ์ จังหวัดเชียงใหม่
โครงการก่อสร้างงานภูมิทัศน์ สวนเทิดพระเกียรติ ราชพฤกษ์ จังหวัดเชียงใหม่
 
Mικρασιατικη καταστροφη
Mικρασιατικη καταστροφηMικρασιατικη καταστροφη
Mικρασιατικη καταστροφη
 
Sanchez t presentation
Sanchez t presentationSanchez t presentation
Sanchez t presentation
 
Removal of Corruption-Empowering the citizens
Removal of Corruption-Empowering the citizensRemoval of Corruption-Empowering the citizens
Removal of Corruption-Empowering the citizens
 
UnPitching
UnPitchingUnPitching
UnPitching
 
เธ‡เธฒเธ™เธ„เธญเธก (1)
เธ‡เธฒเธ™เธ„เธญเธก (1)เธ‡เธฒเธ™เธ„เธญเธก (1)
เธ‡เธฒเธ™เธ„เธญเธก (1)
 
τι υπάρχει πίσω από την κουρτίνα;
τι υπάρχει πίσω από την κουρτίνα;τι υπάρχει πίσω από την κουρτίνα;
τι υπάρχει πίσω από την κουρτίνα;
 

Similar to Method development

Chromatography BY Hamunyare Ndwabe
Chromatography BY Hamunyare NdwabeChromatography BY Hamunyare Ndwabe
Chromatography BY Hamunyare NdwabeHamunyare Ndwabe
 
DSE-2, ANALYTICAL METHODS -Ch-II.pptx
DSE-2, ANALYTICAL METHODS -Ch-II.pptxDSE-2, ANALYTICAL METHODS -Ch-II.pptx
DSE-2, ANALYTICAL METHODS -Ch-II.pptxMathabhanga College
 
Chromatography الشيت الثاني.ppt
Chromatography الشيت الثاني.pptChromatography الشيت الثاني.ppt
Chromatography الشيت الثاني.pptMajdolenAhrki
 
UNIT 3_Chromatography and Microscopy_3RD SEMESTER BIOTECH.pptx
UNIT 3_Chromatography and Microscopy_3RD SEMESTER BIOTECH.pptxUNIT 3_Chromatography and Microscopy_3RD SEMESTER BIOTECH.pptx
UNIT 3_Chromatography and Microscopy_3RD SEMESTER BIOTECH.pptxDrKunzesDolma
 
Chromatography p.c
Chromatography p.cChromatography p.c
Chromatography p.cAMRUTHA JOSE
 
Chromatography and types Likhith K
Chromatography and types Likhith KChromatography and types Likhith K
Chromatography and types Likhith KLIKHITHK1
 
instrumental cha 4
instrumental cha 4instrumental cha 4
instrumental cha 4Ibseusso
 
instrumental cha 4.pdf
instrumental cha 4.pdfinstrumental cha 4.pdf
instrumental cha 4.pdfIbsa15
 
High performance liquid chromatography
High performance liquid chromatographyHigh performance liquid chromatography
High performance liquid chromatographyAbu Sufiyan Chhipa
 
column chromatography and ultra performance liquid chromatography
column chromatography and ultra performance liquid chromatographycolumn chromatography and ultra performance liquid chromatography
column chromatography and ultra performance liquid chromatographyHenisha Patel
 
A brief review on development and validation of hplc method.
A brief review on development and validation of hplc method.A brief review on development and validation of hplc method.
A brief review on development and validation of hplc method.adhirajain
 
Classification of chromatography
Classification of chromatographyClassification of chromatography
Classification of chromatographyJagdish Jat
 
High Performance Liquid Chromatography
High Performance Liquid ChromatographyHigh Performance Liquid Chromatography
High Performance Liquid ChromatographyPayal Vaswani
 

Similar to Method development (20)

Chromatography BY Hamunyare Ndwabe
Chromatography BY Hamunyare NdwabeChromatography BY Hamunyare Ndwabe
Chromatography BY Hamunyare Ndwabe
 
Hplc and gc ppt
Hplc and gc pptHplc and gc ppt
Hplc and gc ppt
 
Separation methods
Separation methodsSeparation methods
Separation methods
 
DSE-2, ANALYTICAL METHODS -Ch-II.pptx
DSE-2, ANALYTICAL METHODS -Ch-II.pptxDSE-2, ANALYTICAL METHODS -Ch-II.pptx
DSE-2, ANALYTICAL METHODS -Ch-II.pptx
 
Chromatography الشيت الثاني.ppt
Chromatography الشيت الثاني.pptChromatography الشيت الثاني.ppt
Chromatography الشيت الثاني.ppt
 
HPLC PPT.pptx
HPLC PPT.pptxHPLC PPT.pptx
HPLC PPT.pptx
 
UNIT 3_Chromatography and Microscopy_3RD SEMESTER BIOTECH.pptx
UNIT 3_Chromatography and Microscopy_3RD SEMESTER BIOTECH.pptxUNIT 3_Chromatography and Microscopy_3RD SEMESTER BIOTECH.pptx
UNIT 3_Chromatography and Microscopy_3RD SEMESTER BIOTECH.pptx
 
Chromatography p.c
Chromatography p.cChromatography p.c
Chromatography p.c
 
Chromatography and types Likhith K
Chromatography and types Likhith KChromatography and types Likhith K
Chromatography and types Likhith K
 
instrumental cha 4
instrumental cha 4instrumental cha 4
instrumental cha 4
 
instrumental cha 4.pdf
instrumental cha 4.pdfinstrumental cha 4.pdf
instrumental cha 4.pdf
 
HPLC.pptx
HPLC.pptxHPLC.pptx
HPLC.pptx
 
Chromatography
ChromatographyChromatography
Chromatography
 
Liquid chromatography
Liquid chromatographyLiquid chromatography
Liquid chromatography
 
High performance liquid chromatography
High performance liquid chromatographyHigh performance liquid chromatography
High performance liquid chromatography
 
column chromatography and ultra performance liquid chromatography
column chromatography and ultra performance liquid chromatographycolumn chromatography and ultra performance liquid chromatography
column chromatography and ultra performance liquid chromatography
 
A brief review on development and validation of hplc method.
A brief review on development and validation of hplc method.A brief review on development and validation of hplc method.
A brief review on development and validation of hplc method.
 
Classification of chromatography
Classification of chromatographyClassification of chromatography
Classification of chromatography
 
Chromatography.pptx
Chromatography.pptxChromatography.pptx
Chromatography.pptx
 
High Performance Liquid Chromatography
High Performance Liquid ChromatographyHigh Performance Liquid Chromatography
High Performance Liquid Chromatography
 

More from Nirav Soni

Chapter-18 Body fluids and circulation
Chapter-18 Body fluids and circulationChapter-18 Body fluids and circulation
Chapter-18 Body fluids and circulationNirav Soni
 
Chapter-8 Cell membrane and transport system
Chapter-8 Cell membrane and transport systemChapter-8 Cell membrane and transport system
Chapter-8 Cell membrane and transport systemNirav Soni
 
ગુજરાત બોર્ડ-2022 IMP પ્રશ્નો
ગુજરાત બોર્ડ-2022 IMP પ્રશ્નોગુજરાત બોર્ડ-2022 IMP પ્રશ્નો
ગુજરાત બોર્ડ-2022 IMP પ્રશ્નોNirav Soni
 
Impurities profiling of ATZ
Impurities profiling of ATZImpurities profiling of ATZ
Impurities profiling of ATZNirav Soni
 
Ch-2 Sexual Reproduction in Flowering Plants
Ch-2 Sexual Reproduction in Flowering PlantsCh-2 Sexual Reproduction in Flowering Plants
Ch-2 Sexual Reproduction in Flowering PlantsNirav Soni
 
“Impact of Social Distancing, Lockdown and Innovations on the spread of COVID...
“Impact of Social Distancing, Lockdown and Innovations on the spread of COVID...“Impact of Social Distancing, Lockdown and Innovations on the spread of COVID...
“Impact of Social Distancing, Lockdown and Innovations on the spread of COVID...Nirav Soni
 
Diseases Std 12th and 9th and 10th Biology NEET Gujarati Medium
Diseases Std 12th and 9th and 10th Biology NEET Gujarati Medium Diseases Std 12th and 9th and 10th Biology NEET Gujarati Medium
Diseases Std 12th and 9th and 10th Biology NEET Gujarati Medium Nirav Soni
 
Ch-1 The Living World MCQ std 11th biology NEET by Dr.Nirav Soni
Ch-1 The Living World MCQ std 11th biology NEET by Dr.Nirav Soni Ch-1 The Living World MCQ std 11th biology NEET by Dr.Nirav Soni
Ch-1 The Living World MCQ std 11th biology NEET by Dr.Nirav Soni Nirav Soni
 
Sexual reproduction in flowering plant in Gyjarati Medium Biology NEET
Sexual reproduction in flowering plant in Gyjarati Medium Biology NEETSexual reproduction in flowering plant in Gyjarati Medium Biology NEET
Sexual reproduction in flowering plant in Gyjarati Medium Biology NEETNirav Soni
 
Chapter-16 Environmental Issues Biology NEET
Chapter-16 Environmental Issues Biology NEETChapter-16 Environmental Issues Biology NEET
Chapter-16 Environmental Issues Biology NEETNirav Soni
 
Ch-1 Reproduction in organisms -Biology NEET English Medium
Ch-1 Reproduction in organisms -Biology NEET English MediumCh-1 Reproduction in organisms -Biology NEET English Medium
Ch-1 Reproduction in organisms -Biology NEET English MediumNirav Soni
 
Ch-1 Reproduction in organisms -Biology NEET Gujarati Medium
Ch-1 Reproduction in organisms -Biology NEET Gujarati MediumCh-1 Reproduction in organisms -Biology NEET Gujarati Medium
Ch-1 Reproduction in organisms -Biology NEET Gujarati MediumNirav Soni
 
Reproduction in Organism - NEET biology
Reproduction in Organism - NEET biologyReproduction in Organism - NEET biology
Reproduction in Organism - NEET biologyNirav Soni
 
Evolution std 12th neet
Evolution std 12th neet Evolution std 12th neet
Evolution std 12th neet Nirav Soni
 
Genetics std 12th biology NEET
Genetics std 12th biology NEETGenetics std 12th biology NEET
Genetics std 12th biology NEETNirav Soni
 
Female reproductive sysrem
Female reproductive sysremFemale reproductive sysrem
Female reproductive sysremNirav Soni
 
Human reproduction
Human reproductionHuman reproduction
Human reproductionNirav Soni
 
HPLC-HIgh Pressure/Performance Liquid Chromatography
HPLC-HIgh Pressure/Performance Liquid ChromatographyHPLC-HIgh Pressure/Performance Liquid Chromatography
HPLC-HIgh Pressure/Performance Liquid ChromatographyNirav Soni
 
MODERN TECHNOLOGY OF PHARMACEUTICAL ANALYSIS
MODERN TECHNOLOGY OF PHARMACEUTICAL ANALYSISMODERN TECHNOLOGY OF PHARMACEUTICAL ANALYSIS
MODERN TECHNOLOGY OF PHARMACEUTICAL ANALYSISNirav Soni
 

More from Nirav Soni (20)

Chapter-18 Body fluids and circulation
Chapter-18 Body fluids and circulationChapter-18 Body fluids and circulation
Chapter-18 Body fluids and circulation
 
Chapter-8 Cell membrane and transport system
Chapter-8 Cell membrane and transport systemChapter-8 Cell membrane and transport system
Chapter-8 Cell membrane and transport system
 
ગુજરાત બોર્ડ-2022 IMP પ્રશ્નો
ગુજરાત બોર્ડ-2022 IMP પ્રશ્નોગુજરાત બોર્ડ-2022 IMP પ્રશ્નો
ગુજરાત બોર્ડ-2022 IMP પ્રશ્નો
 
Impurities profiling of ATZ
Impurities profiling of ATZImpurities profiling of ATZ
Impurities profiling of ATZ
 
Ch-2 Sexual Reproduction in Flowering Plants
Ch-2 Sexual Reproduction in Flowering PlantsCh-2 Sexual Reproduction in Flowering Plants
Ch-2 Sexual Reproduction in Flowering Plants
 
“Impact of Social Distancing, Lockdown and Innovations on the spread of COVID...
“Impact of Social Distancing, Lockdown and Innovations on the spread of COVID...“Impact of Social Distancing, Lockdown and Innovations on the spread of COVID...
“Impact of Social Distancing, Lockdown and Innovations on the spread of COVID...
 
Diseases Std 12th and 9th and 10th Biology NEET Gujarati Medium
Diseases Std 12th and 9th and 10th Biology NEET Gujarati Medium Diseases Std 12th and 9th and 10th Biology NEET Gujarati Medium
Diseases Std 12th and 9th and 10th Biology NEET Gujarati Medium
 
Ch-1 The Living World MCQ std 11th biology NEET by Dr.Nirav Soni
Ch-1 The Living World MCQ std 11th biology NEET by Dr.Nirav Soni Ch-1 The Living World MCQ std 11th biology NEET by Dr.Nirav Soni
Ch-1 The Living World MCQ std 11th biology NEET by Dr.Nirav Soni
 
Sexual reproduction in flowering plant in Gyjarati Medium Biology NEET
Sexual reproduction in flowering plant in Gyjarati Medium Biology NEETSexual reproduction in flowering plant in Gyjarati Medium Biology NEET
Sexual reproduction in flowering plant in Gyjarati Medium Biology NEET
 
Chapter-16 Environmental Issues Biology NEET
Chapter-16 Environmental Issues Biology NEETChapter-16 Environmental Issues Biology NEET
Chapter-16 Environmental Issues Biology NEET
 
Ch-1 Reproduction in organisms -Biology NEET English Medium
Ch-1 Reproduction in organisms -Biology NEET English MediumCh-1 Reproduction in organisms -Biology NEET English Medium
Ch-1 Reproduction in organisms -Biology NEET English Medium
 
Ch-1 Reproduction in organisms -Biology NEET Gujarati Medium
Ch-1 Reproduction in organisms -Biology NEET Gujarati MediumCh-1 Reproduction in organisms -Biology NEET Gujarati Medium
Ch-1 Reproduction in organisms -Biology NEET Gujarati Medium
 
Reproduction in Organism - NEET biology
Reproduction in Organism - NEET biologyReproduction in Organism - NEET biology
Reproduction in Organism - NEET biology
 
Evolution std 12th neet
Evolution std 12th neet Evolution std 12th neet
Evolution std 12th neet
 
Genetics std 12th biology NEET
Genetics std 12th biology NEETGenetics std 12th biology NEET
Genetics std 12th biology NEET
 
Female reproductive sysrem
Female reproductive sysremFemale reproductive sysrem
Female reproductive sysrem
 
Human reproduction
Human reproductionHuman reproduction
Human reproduction
 
Nirav cv copy
Nirav cv    copyNirav cv    copy
Nirav cv copy
 
HPLC-HIgh Pressure/Performance Liquid Chromatography
HPLC-HIgh Pressure/Performance Liquid ChromatographyHPLC-HIgh Pressure/Performance Liquid Chromatography
HPLC-HIgh Pressure/Performance Liquid Chromatography
 
MODERN TECHNOLOGY OF PHARMACEUTICAL ANALYSIS
MODERN TECHNOLOGY OF PHARMACEUTICAL ANALYSISMODERN TECHNOLOGY OF PHARMACEUTICAL ANALYSIS
MODERN TECHNOLOGY OF PHARMACEUTICAL ANALYSIS
 

Recently uploaded

“Oh GOSH! Reflecting on Hackteria's Collaborative Practices in a Global Do-It...
“Oh GOSH! Reflecting on Hackteria's Collaborative Practices in a Global Do-It...“Oh GOSH! Reflecting on Hackteria's Collaborative Practices in a Global Do-It...
“Oh GOSH! Reflecting on Hackteria's Collaborative Practices in a Global Do-It...Marc Dusseiller Dusjagr
 
POINT- BIOCHEMISTRY SEM 2 ENZYMES UNIT 5.pptx
POINT- BIOCHEMISTRY SEM 2 ENZYMES UNIT 5.pptxPOINT- BIOCHEMISTRY SEM 2 ENZYMES UNIT 5.pptx
POINT- BIOCHEMISTRY SEM 2 ENZYMES UNIT 5.pptxSayali Powar
 
History Class XII Ch. 3 Kinship, Caste and Class (1).pptx
History Class XII Ch. 3 Kinship, Caste and Class (1).pptxHistory Class XII Ch. 3 Kinship, Caste and Class (1).pptx
History Class XII Ch. 3 Kinship, Caste and Class (1).pptxsocialsciencegdgrohi
 
Pharmacognosy Flower 3. Compositae 2023.pdf
Pharmacognosy Flower 3. Compositae 2023.pdfPharmacognosy Flower 3. Compositae 2023.pdf
Pharmacognosy Flower 3. Compositae 2023.pdfMahmoud M. Sallam
 
call girls in Kamla Market (DELHI) 🔝 >༒9953330565🔝 genuine Escort Service 🔝✔️✔️
call girls in Kamla Market (DELHI) 🔝 >༒9953330565🔝 genuine Escort Service 🔝✔️✔️call girls in Kamla Market (DELHI) 🔝 >༒9953330565🔝 genuine Escort Service 🔝✔️✔️
call girls in Kamla Market (DELHI) 🔝 >༒9953330565🔝 genuine Escort Service 🔝✔️✔️9953056974 Low Rate Call Girls In Saket, Delhi NCR
 
Solving Puzzles Benefits Everyone (English).pptx
Solving Puzzles Benefits Everyone (English).pptxSolving Puzzles Benefits Everyone (English).pptx
Solving Puzzles Benefits Everyone (English).pptxOH TEIK BIN
 
Organic Name Reactions for the students and aspirants of Chemistry12th.pptx
Organic Name Reactions  for the students and aspirants of Chemistry12th.pptxOrganic Name Reactions  for the students and aspirants of Chemistry12th.pptx
Organic Name Reactions for the students and aspirants of Chemistry12th.pptxVS Mahajan Coaching Centre
 
Earth Day Presentation wow hello nice great
Earth Day Presentation wow hello nice greatEarth Day Presentation wow hello nice great
Earth Day Presentation wow hello nice greatYousafMalik24
 
MARGINALIZATION (Different learners in Marginalized Group
MARGINALIZATION (Different learners in Marginalized GroupMARGINALIZATION (Different learners in Marginalized Group
MARGINALIZATION (Different learners in Marginalized GroupJonathanParaisoCruz
 
Crayon Activity Handout For the Crayon A
Crayon Activity Handout For the Crayon ACrayon Activity Handout For the Crayon A
Crayon Activity Handout For the Crayon AUnboundStockton
 
Software Engineering Methodologies (overview)
Software Engineering Methodologies (overview)Software Engineering Methodologies (overview)
Software Engineering Methodologies (overview)eniolaolutunde
 
DATA STRUCTURE AND ALGORITHM for beginners
DATA STRUCTURE AND ALGORITHM for beginnersDATA STRUCTURE AND ALGORITHM for beginners
DATA STRUCTURE AND ALGORITHM for beginnersSabitha Banu
 
भारत-रोम व्यापार.pptx, Indo-Roman Trade,
भारत-रोम व्यापार.pptx, Indo-Roman Trade,भारत-रोम व्यापार.pptx, Indo-Roman Trade,
भारत-रोम व्यापार.pptx, Indo-Roman Trade,Virag Sontakke
 
Proudly South Africa powerpoint Thorisha.pptx
Proudly South Africa powerpoint Thorisha.pptxProudly South Africa powerpoint Thorisha.pptx
Proudly South Africa powerpoint Thorisha.pptxthorishapillay1
 
Framing an Appropriate Research Question 6b9b26d93da94caf993c038d9efcdedb.pdf
Framing an Appropriate Research Question 6b9b26d93da94caf993c038d9efcdedb.pdfFraming an Appropriate Research Question 6b9b26d93da94caf993c038d9efcdedb.pdf
Framing an Appropriate Research Question 6b9b26d93da94caf993c038d9efcdedb.pdfUjwalaBharambe
 
Alper Gobel In Media Res Media Component
Alper Gobel In Media Res Media ComponentAlper Gobel In Media Res Media Component
Alper Gobel In Media Res Media ComponentInMediaRes1
 
CELL CYCLE Division Science 8 quarter IV.pptx
CELL CYCLE Division Science 8 quarter IV.pptxCELL CYCLE Division Science 8 quarter IV.pptx
CELL CYCLE Division Science 8 quarter IV.pptxJiesonDelaCerna
 
Introduction to ArtificiaI Intelligence in Higher Education
Introduction to ArtificiaI Intelligence in Higher EducationIntroduction to ArtificiaI Intelligence in Higher Education
Introduction to ArtificiaI Intelligence in Higher Educationpboyjonauth
 

Recently uploaded (20)

“Oh GOSH! Reflecting on Hackteria's Collaborative Practices in a Global Do-It...
“Oh GOSH! Reflecting on Hackteria's Collaborative Practices in a Global Do-It...“Oh GOSH! Reflecting on Hackteria's Collaborative Practices in a Global Do-It...
“Oh GOSH! Reflecting on Hackteria's Collaborative Practices in a Global Do-It...
 
POINT- BIOCHEMISTRY SEM 2 ENZYMES UNIT 5.pptx
POINT- BIOCHEMISTRY SEM 2 ENZYMES UNIT 5.pptxPOINT- BIOCHEMISTRY SEM 2 ENZYMES UNIT 5.pptx
POINT- BIOCHEMISTRY SEM 2 ENZYMES UNIT 5.pptx
 
History Class XII Ch. 3 Kinship, Caste and Class (1).pptx
History Class XII Ch. 3 Kinship, Caste and Class (1).pptxHistory Class XII Ch. 3 Kinship, Caste and Class (1).pptx
History Class XII Ch. 3 Kinship, Caste and Class (1).pptx
 
OS-operating systems- ch04 (Threads) ...
OS-operating systems- ch04 (Threads) ...OS-operating systems- ch04 (Threads) ...
OS-operating systems- ch04 (Threads) ...
 
Pharmacognosy Flower 3. Compositae 2023.pdf
Pharmacognosy Flower 3. Compositae 2023.pdfPharmacognosy Flower 3. Compositae 2023.pdf
Pharmacognosy Flower 3. Compositae 2023.pdf
 
9953330565 Low Rate Call Girls In Rohini Delhi NCR
9953330565 Low Rate Call Girls In Rohini  Delhi NCR9953330565 Low Rate Call Girls In Rohini  Delhi NCR
9953330565 Low Rate Call Girls In Rohini Delhi NCR
 
call girls in Kamla Market (DELHI) 🔝 >༒9953330565🔝 genuine Escort Service 🔝✔️✔️
call girls in Kamla Market (DELHI) 🔝 >༒9953330565🔝 genuine Escort Service 🔝✔️✔️call girls in Kamla Market (DELHI) 🔝 >༒9953330565🔝 genuine Escort Service 🔝✔️✔️
call girls in Kamla Market (DELHI) 🔝 >༒9953330565🔝 genuine Escort Service 🔝✔️✔️
 
Solving Puzzles Benefits Everyone (English).pptx
Solving Puzzles Benefits Everyone (English).pptxSolving Puzzles Benefits Everyone (English).pptx
Solving Puzzles Benefits Everyone (English).pptx
 
Organic Name Reactions for the students and aspirants of Chemistry12th.pptx
Organic Name Reactions  for the students and aspirants of Chemistry12th.pptxOrganic Name Reactions  for the students and aspirants of Chemistry12th.pptx
Organic Name Reactions for the students and aspirants of Chemistry12th.pptx
 
Earth Day Presentation wow hello nice great
Earth Day Presentation wow hello nice greatEarth Day Presentation wow hello nice great
Earth Day Presentation wow hello nice great
 
MARGINALIZATION (Different learners in Marginalized Group
MARGINALIZATION (Different learners in Marginalized GroupMARGINALIZATION (Different learners in Marginalized Group
MARGINALIZATION (Different learners in Marginalized Group
 
Crayon Activity Handout For the Crayon A
Crayon Activity Handout For the Crayon ACrayon Activity Handout For the Crayon A
Crayon Activity Handout For the Crayon A
 
Software Engineering Methodologies (overview)
Software Engineering Methodologies (overview)Software Engineering Methodologies (overview)
Software Engineering Methodologies (overview)
 
DATA STRUCTURE AND ALGORITHM for beginners
DATA STRUCTURE AND ALGORITHM for beginnersDATA STRUCTURE AND ALGORITHM for beginners
DATA STRUCTURE AND ALGORITHM for beginners
 
भारत-रोम व्यापार.pptx, Indo-Roman Trade,
भारत-रोम व्यापार.pptx, Indo-Roman Trade,भारत-रोम व्यापार.pptx, Indo-Roman Trade,
भारत-रोम व्यापार.pptx, Indo-Roman Trade,
 
Proudly South Africa powerpoint Thorisha.pptx
Proudly South Africa powerpoint Thorisha.pptxProudly South Africa powerpoint Thorisha.pptx
Proudly South Africa powerpoint Thorisha.pptx
 
Framing an Appropriate Research Question 6b9b26d93da94caf993c038d9efcdedb.pdf
Framing an Appropriate Research Question 6b9b26d93da94caf993c038d9efcdedb.pdfFraming an Appropriate Research Question 6b9b26d93da94caf993c038d9efcdedb.pdf
Framing an Appropriate Research Question 6b9b26d93da94caf993c038d9efcdedb.pdf
 
Alper Gobel In Media Res Media Component
Alper Gobel In Media Res Media ComponentAlper Gobel In Media Res Media Component
Alper Gobel In Media Res Media Component
 
CELL CYCLE Division Science 8 quarter IV.pptx
CELL CYCLE Division Science 8 quarter IV.pptxCELL CYCLE Division Science 8 quarter IV.pptx
CELL CYCLE Division Science 8 quarter IV.pptx
 
Introduction to ArtificiaI Intelligence in Higher Education
Introduction to ArtificiaI Intelligence in Higher EducationIntroduction to ArtificiaI Intelligence in Higher Education
Introduction to ArtificiaI Intelligence in Higher Education
 

Method development

  • 1. LIQUID CHROMATOGRAPHY SEPARATION BY LIQUID-LIQUID CHROMATOGRAPHY The liquid-liquid chromatography column consists of a bed support (usually inert) on which the stationary partitioning phase is adsorbed. The mobile phase flowing through the column is in contact with the stationary phase over a large interphase. In this process, equilibrium distributions of the solute between the two phases take place rapidly. Separation of the different components of a mixture results from the differing distributions of the various solutes in these two unlike phases. When compared to the other forms of chromatography, liquid-liquid remains as one of the more versatile procedures. This versatility, based largely on the selection of a partitioning phase, may be used to make the desired separation. Partition can be applied to a wide variety of sample types. In the normal mode the stationary phase is the polar segment while the mobile phase is of less polarity. When this is reversed, it is called reverse phase liquid-liquid chromatography. Thus the normal mode is usually used for the separation of more polar components, while separation of non-polar components is normally done using the reverse phase technique. There are two general types of support used for liquid-liquid chromatography, the porous support and the pellicular support. The porous support contains pores throughout its structure and has high surface area. The pellicular support has a solid core and a thin shell of porous material. The advantages of the porous materials as supports are that they are less expensive, and possess a greater capacity for solutes because of the size/surface area relationship. The life of a liquid-liquid column depends on the system and the conditions under which the column is operated. In this mode of chromatography we are attempting to create a partial solubility between two mutually insoluble phases. Unfortunately, very few liquids are totally insoluble in some other liquid.
  • 2. Therefore, the moving phase slowly and insidiously tends to to destroy the stationary phase. Thus, for maximum column life it is generally required to presaturate the moving phase with stationary phase and we use a precolumn in the system to overcome the effects of moving phase temperature variations as well as to insure that the stationary phase is in equilibria with the moving phase. It is also important to remember that the saturation of the mobile phase with a poorly soluble stationary phase can require time and high agitation to ensure intimate contact between these two basically insoluble liquids. SEPARATION BY LIQUID-SOLID CHROMATOGRAPHY Modern affinity chromatography has a number of potential advantages to thin layer chromatography i.e. greater speed, greater separation efficiency, easier automation for convenience and unattended operation. Quantitation is simpler, preparative separation can be done, LSC has application to routine control, and a permanent record of the separation is obtained. The primary factor in determining the relative adsorption of a sample molecule is its functional groups. Relative adsorption on a polar packing increases as the polarity and the number of these functional group increase. The uniqueness of retention and selectivity in affinity chromatography arises from two characteristic features of adsorption from solution. (1) A competition between sample and solvent molecules for a place on the adsorbent surface, and (2) Multiple interactions between functional groups on the sample molecule and the corresponding rigidly fixed sites on the adsorbent surface. The key to packing selection is to choose that type of packing which will enhance the differences in the molecules that you want to separate. For example, in the selection of packing to separate positional isomer the portion of the molecule which is in different position of prime importance-if the difference is in the position of a functional group, then a silica or alumina would be the first choice, if
  • 3. the difference is in the position of a non-polar group, (e.g. a methyl group) then a C 18 packing would be the first choice. Silica is an excellent general purpose adsorbent which is commercially available in a wide variety of useful forms. In addition, silica is nearly optimum from several aspects: it has little or no reactivity toward many sample types, it has high linear capacity and high efficiency. Only when a change in separational selectivity is required and when changes in the solvent are unable to provide for changes in selectivity- should the possibility of another adsorbent type be considered. This may be the case for unusually difficult separations where there are similar compounds or for mixtures containing a wide number of components. For example, the separation of cyclic aromatic hydrocarbons is done better on alumina than silica. The surface area of an adsorbent has an important effect on its chromatographic properties. To the first approximation, sample retention volumes and adsorption linear capacity are proportional to these surface area of the adsorbent. The commercial silicas have surface area from 300 to 400 square meters per gram. The size and geometry of the adsorbent play a critical role in separation. We know that a good column generally has a large number of theoretical plate at relative high flow rates without excessive pressure drops across the column. The water content of a polar adsorbent plays a critical role in affinity chromatography. It may be necessary to add some water to the adsorbent to increase the linear capacity to a usable value and to maximize the separational efficiency. Added water has been known to decrease the formation of static charge on the particle during packing. The water content of the adsorbent markedly affects the relative capacity values and band migration rates in separation and water content must be held constant for repeatable separations. Care must be taken that
  • 4. the mobile phase does not remove this added water. It may be necessary to add water to the mobile phase to maintain equilibrium. QUANTITATION The goal of a quantitative analysis is a number , for example, a percentage or weight per volume of liquid. That number has certain desired characteristics including reproducibility, correctness, and often, speedy and easy acquisition. Toward that end, the analytical method utilized should be optimized for specificity, sensitivity and speed. The ease of this optimization with HPLC as the analutical method helps to make HPLC a strong and versatile quantitative tool. APPROACH TO A QUANTITATIVE PROBLEM The solution to a quantitative problem will vary according to particular requirements to the assay. However, there is a basic approach to the problem which is recommended. First, a chromatographic separation is required. A separation should be developed using standards for all compounds of interest, yielding baseline resolution between any two peaks. An ideal separation would have a resolution of about 1.5 between neighbouring peaks to insure good quantitation. The separation should have reproducible retention times usually better than =1% for successive injections. The peaks to be quantitated must be identified typically by the injection of standards to match retention times. Sometimes unknown peaks must be collected and identified by spectroscopy or some other qualitative analysis technique. A significant problem in quantitation in contamination of peaks by coeluting peaks. This gives a detector response that is larger than it would be if only the single compound were measured. The more complex the sample matrix the more
  • 5. likely we are to see peak contamination, but even relative simple mixtures can have contaminated peaks. Guarding against this contamination is necessary to insure accurate answers. The detector response rationing has been used for many years as a method to find contaminated peaks. The most common way to measure peak ratios is to use two different wavelengths of UV absorption and ration the areas obtained on the peaks by integration. With the separation in hand, certain questions regarding requirements and limitations of the assay must be answered. Those questions include the following. 1. Sample limitations 2. Detection limits required a. sensitivity b. Linearity 3. Precision requirements 4. Accuracy requirements 5. Number of analyses required per day 6. Cost per analysis limitations METHOD VALIDATION It is a documented evidence which provides a high degree of assurance that a particular process will constantly produce the product meeting its all predetermined specifications and quality attributes. Once a separation has been developed with standards and the pertinent questions have been answered, the analyst’s work really begins. This work is method validation, and it is what sets a quantitative assay apart from any other applications. Method validation insures that the separation which has been developed will adequetly meet all criteria established for the particular assay.
  • 6. Method validation starts with a calibration. The most common detectors used in HPLC respond in a linear fashion to a sample component’s concentration. That is, a plot of a component’s concentration versus detector response will give a straight line, intercepting the origin. The calibration curve can be generated using a number of techniques, two of which are internal standard calibration and external standard calibration. Linearity and sensitivity limits of the assay can be determined from the calibration curve. Also, once the calibration is established, accuracy and precision data can be compiled and evaluated. MEASUREMENT OF RESPONSE- PEAK HEIGHT Vs. PEAK AREA Once a separation has been developed and the method validated and optimized to meet the criteria of the quantitative problem, analysis of unknown can begin. Either peak heights or peak area will yield good data if peaks to be measured are well resolved from interference and are nearly guassian in shape. Peak heights would be preferred if working with the ruler, due to ease of measurement and simplicity of calculations. There are situations, however, where proper choice between height and area will positively influence the quantitation. Those applications involve chromatography which is less than ideal. For example, separations where k’ is not absolutely constant for peaks of interest should have response measurements by peak area. Variations in k’ will especially affect peak height. The area of the peak, however, will not be affected as much by such changes in k’. On the other hand, variations in flow rate will have a more adverse affect on peak area than on peak height. When chromatographic resolution is less than baseline, both precision and accuracy will suffer. Assuming that “less than perfect” resolution represents the best that could be attained for the problem at hand, the decision of whether to use peak area or height may significantly affect the quality of analytical results.
  • 7. Furthermore, if peak area is chosen, the method selected for baseline correction can profoundly influence quantitation. Where the peaks of interest are relatively more minor peaks unresolved from a larger peak, or if peaks co-elute with a broad peak underneath, the choice is not as clear cut. Often in such cases, area measurements will prove superior if appropriate baseline corrections are applied. Selection of the best baseline correction technique will depend on somewhat subjective judgements by analyst, the validity of which will, in turn, depend substantially on knowledge of the sample under analysis. A figure of possible baseline corrections is shown below. HPLC METHOD DEVELOPMENT AND VALIDATION
  • 8. The wide variety of equipment, columns, eluent and operational parameters involved makes high performance liquid chromatography (HPLC) method development seem complex. The process is influenced by the nature of the analytes and generally follows the following steps: • step 1 - selection of the HPLC method and initial system • step 2 - selection of initial conditions • step 3 - selectivity optimization • step 4 - system optimization • step 5 - method validation. Depending on the overall requirements and nature of the sample and analytes, some of these steps will not be necessary during HPLC analysis. For example, a satisfactory separation may be found during step 2, thus steps 3 and 4 may not be required. The extent to which method validation (step 5) is investigated will depend on the use of the end analysis; for example, a method required for quality control will require more validation than one developed for a one-off analysis. The following must be considered when developing an HPLC method: • keep it simple • try the most common columns and stationary phases first • thoroughly investigate binary mobile phases before going on to ternary • think of the factors that are likely to be significant in achieving the desired resolution. Mobile phase composition, for example, is the most powerful way of optimizing selectivity whereas temperature has a minor effect and would only achieve small selectivity changes. pH will only significantly affect the retention of weak acids and bases. A flow diagram of an HPLC system is illustrated in Figure 1.
  • 9. HPLC method development Step 1 - selection of the HPLC method and initial system. When developing an HPLC method, the first step is always to consult the literature to ascertain whether the separation has been previously performed and if so, under what conditions - this will save time doing unnecessary experimental work. When selecting an HPLC system, it must have a high probability of actually being able to analyse the sample; for example, if the sample includes polar analytes then reverse phase HPLC would offer both adequate retention and resolution, whereas normal phase HPLC would be much less feasible. Consideration must be given to the following: Sample preparation.
  • 10. Does the sample require dissolution, filtration, extraction, preconcentration or clean up? Is chemical derivatization required to assist detection sensitivity or selectivity? Types of chromatography. Reverse phase is the choice for the majority of samples, but if acidic or basic analytes are present then reverse phase ion suppression (for weak acids or bases) or reverse phase ion pairing (for strong acids or bases) should be used. The stationary phase should be C18 bonded. For low/medium polarity analytes, normal phase HPLC is a potential candidate, particularly if the separation of isomers is required. Cyano-bonded phases are easier to work with than plain silica for normal phase separations. For inorganic anion/cation analysis, ion exchange chromatography is best. Size exclusion chromatography would normally be considered for analysing high molecular weight compounds (.2000). Gradient HPLC. This is only a requirement for complex samples with a large number of components (.20–30) because the maximum number of peaks that can be resolved with a given resolution is much higher than in isocratic HPLC. This is a result of the constant peak width that is observed in gradient HPLC (in isocratic HPLC peak width increases in proportion to retention time). The method can also be used for samples containing analytes with a wide range of retentivities that would, under isocratic conditions, provide chromatograms with capacity factors outside of the normally acceptable range of 0.5–15. Gradient HPLC will also give greater sensitivity, particularly for analytes with longer retention times, because of the more constant peak width (for a given peak area, peak height is inversely proportional to peak width). Reverse phase gradient HPLC is commonly used in peptide and small protein analysis using an
  • 11. acetonitrile–water mobile phase containing 1% trifluoroethanoic acid. Gradient HPLC is an excellent method for initial sample analysis. Column dimensions. For most samples (unless they are very complex), short columns (10–15 cm) are recommended to reduce method development time. Such columns afford shorter retention and equilibration times. A flow rate of 1-1.5 mL/min should be used initially. Packing particle size should be 3 or 5 μm. Detectors. Consideration must be given to the following: • Do the analytes have chromophores to enable UV detection? • Is more selective/sensitive detection required (Table I)? • What detection limits are necessary? • Will the sample require chemical derivatization to enhance detectability and/or improve the chromatography?
  • 12. Fluorescence or electrochemical detectors should be used for trace analysis. For preparative HPLC, refractive index is preferred because it can handle high concentrations without overloading the detector. UV wavelength. For the greatest sensitivity λmax should be used, which detects all sample components that contain chromophores. UV wavelengths below 200 nm should be avoided because detector noise increases in this region. Higher wavelengths give greater selectivity. Fluorescence wavelength. The excitation wavelength locates the excitation maximum; that is, the wavelength that gives the maximum emission intensity. The excitation is set to the maximum value then the emission is scanned to locate the emission intensity. Selection of the initial system could, therefore, be based on assessment of the nature of sample and analytes together with literature data, experience, expert system software and empirical approaches. Step 2 - selection of initial conditions. This step determines the optimum conditions to adequately retain all analytes; that is, ensures no analyte has a capacity factor of less than 0.5 (poor retention could result in peak overlapping) and no analyte has a capacity factor greater than 10–15 (excessive retention leads to long analysis time and broad peaks with poor detectability). Selection of the following is then required. Mobile phase solvent strength. The solvent strength is a measure of its ability to pull analytes from the column. It is generally controlled by the concentration of the solvent with the
  • 13. highest strength; for example, in reverse phase HPLC with aqueous mobile phases, the strong solvent would be the organic modifier; in normal phase HPLC, it would be the most polar one. The aim is to find the correct concentration of the strong solvent. With many samples, there will be a range of solvent strengths that can be used within the aforementioned capacity limits. Other factors (such as pH and the presence of ion pairing reagents) may also affect the overall retention of analytes. Gradient HPLC. With samples containing a large number of analytes (.20–30) or with a wide range of analyte retentivities, gradient elution will be necessary to avoid excessive retention. Determination of initial conditions. The recommended method involves performing two gradient runs differing only in the run time. A binary system based on either acetonitrile/water (or aqueous buffer) or methanol/water (or aqueous buffer) should be used. Step 3 - selectivity optimization. The aim of this step is to achieve adequate selectivity (peak spacing). The mobile phase and stationary phase compositions need to be taken into account. To minimize the number of trial chromatograms involved, only the parameters that are likely to have a significant effect on selectivity in the optimization must be examined. To select these, the nature of the analytes must be considered. For this, it is useful to categorize analytes into a few basic types (Table II). Once the analyte types are identified, the relevant optimization parameters may be selected (Table III). Note that the optimization of mobile phase parameters is always considered first as this is much easier and convenient than stationary phase optimization.
  • 14. Selectivity optimization in gradient HPLC. Initially, gradient conditions should be optimized using a binary system based on either acetonitrile/water (or aqueous buffer) or methanol/water (or aqueous buffer). If there is a serious lack of selectivity, a different organic modifier should be considered. Step 4 - system parameter optimization. This is used to find the desired balance between resolution and analysis time after satisfactory selectivity has been achieved. The parameters involved include column dimensions, column-packing particle size and flow rate. These parameters may be changed without affecting capacity factors or selectivity. Step 5 - method validation. Proper validation of analytical methods is important for pharmaceutical analysis when ensurance of the continuing efficacy and safety of each batch manufactured relies solely on the determination of quality. The ability to control this quality is dependent upon the ability of the analytical methods, as applied
  • 15. under well-defined conditions and at an established level of sensitivity, to give a reliable demonstration of all deviation from target criteria. Analytical method validation is now required by regulatory authorities for marketing authorizations and guidelines have been published. It is important to isolate analytical method validation from the selection and development of the method. Method selection is the first step in establishing an analytical method and consideration must be given to what is to be measured, and with what accuracy and precision. Method development and validation can be simultaneous, but they are two different processes, both downstream of method selection. Analytical methods used in quality control should ensure an acceptable degree of confidence that results of the analyses of raw materials, excipients, intermediates, bulk products or finished products are viable. Before a test procedure is validated, the criteria to be used must be determined. Analytical methods should be used within good manufacturing practice (GMP) and good laboratory practice (GLP) environments, and must be developed using the protocols set out in the International Conference on Harmonization (ICH) guidelines (Q2A and Q2B). The US Food and Drug Administration (FDA) and US Pharmacopoeia (USP) both refer to ICH guidelines. The most widely applied validation characteristics are accuracy, precision (repeatability and intermediate precision), specificity, detection limit, quantitation limit, linearity, range, robustness and stability of analytical solutions. Method validation must have a written and approved protocol prior to use.
  • 16.
  • 17.  Approach • Literature survey • Techniques employed  Titrimetric and Spectrophotometric  Chromatographic etc. Literature Survey • In depth study of literature survey is essential prior to proceeding further on the subject. • Literature survey provides important inputs with respect to chemical and physical properties of the individual ingredients. • Literature survey also provides important information about the previous published data on the same or structurally similar compounds and their behavior under given set of conditions Techniques Employed  Analytical techniques that are commonly applied and reported in the literature reports are • Titrimetric • Spectrophotometric • Chromatographic  Titrimetric and Spectrophotometric • Objective is to analyze API in presence of excipients, additives, degradation products, impurities, etc. • Non-specific assays (use of conventional techniques) • For Spectrophotometric assays, sometimes derivative spectroscopy used • These techniques therefore, are supported by HPTLC studies to cover degradation products, impurities and other interfering substances  Method development in HPLC :  When should be HPLC selected as analytical method?
  • 18. • Prerequisite for HPLC analysis: • Sample must be soluble in solvent / water • HPLC is the method of choice for the analysis of:  Non-volatile substances ( for volatile substances GC is an alternative)  Substances with high polarity or ionic samples  Substances with high molecular weight.  Thermally instable and decomposable substances.  Important chemical and physical properties of sample compounds are: • Molecular weight • Formula • Acid / base properties ( pk-values) • Solubility in water / in organic solvents • UV-spectrum.  Sample preparation methods: • Filtration • Centrifugation • Concentration • Evaporation • Dilution • Liquid-liquid-Extraction • Solid phase extraction • derivatization • decomposition  Selection for suitable chromatography method for organic compounds: • First reversed phase should be tried • If reversed phase is not successful, Reversed phase with pH control should be tried. (+/- 1.5 its pKa value) • If Reversed phase with pH control is not successful, then normal phase should be considered.
  • 19. • If normal phase is not successful, try with ion exchange / with ion pair reagent. Eluents  Acetonitrile is the preferred organic solvent because of low viscosity and high uv - transparency (If pure)  Disadvantages: Poisonous! Expensive! AAqquueeoouuss EElluueennttss WWaatteerr FFoorr NNeeuuttrraall ccoommppoouunndd 1100mmMM HH33PPOO44 PPHH 22.. FFoorr wweeaakk ttoo mmeeddiiuumm aacciiddss ((IIoonn ssuupppprreessssiioonn)) 1100mmMM PPhhoosspphhaattee PPHH 44..00 FFoorr wweeaakk ttoo mmeeddiiuumm aacciiddss ((IIoonn ssuupppprreessssiioonn)) ((PPaarrttllyy IIoonn ssuupppprreessssiioonn)) 1100mmMM PPhhoosspphhaattee PPHH 77..55 FFoorr wweeaakk ttoo mmeeddiiuumm bbaasseess oorr aacciidd iinn iioonniizzaattiioonn ffoorrmm  Developing the analytical method for a single component formulation is relatively easy and is a less painstaking exercise .  Multi-components in drug product may differ in their • Chemical and physical characteristics such as:  Absorptivities  Solubilities  Stability with respect to pH and temperature  pKa and pKb  Polarity • Compatibility with mobile phase • Concentration
  • 20. Ionic Nature Of The Components • Use reversed phase column with buffered mobile phase. • Adjust mobile phase strength (mM) to provide an acceptable K’ (capacity factor) range using gradient elution • Arrive at isocratic mobile phase (may not be feasible in all the cases) Typical Challenges in HPLC Method Development  Developing the analytical method for a single component formulation is relatively easy and is a less painstaking exercise .  Multi-components in drug product may differ in their • Chemical and physical characteristics such as:  Absorptivities  Solubilities  Stability with respect to pH and temperature  pKa and pKb  Polarity • Compatibility with mobile phase • Concentration
  • 21. Ionic Nature Of The Components  Study chromatographic behavior: • With buffered mobile phases and reversed-phase column • Adjust mobile phase strength (mM) to provide an acceptable K’ (capacity factor) range using gradient elution • Arrive at isocratic mobile phase (may not be feasible in all the cases) Parameters Controlling Selectivity 1. pH 2. Solvent strength 3. Solvent type 4. Temperature 5. Buffer concentration 6. Amine/Ionic modifiers 7. Column type Parameters Controlling Selectivity pH  Change in pH influences K’/separation between closely eluting components  Carry out experiments at different pH values (extremes of low and high pH) and select the best option w.r.t. K’ and separation Solvent Strength (percentage)  Change in solvent composition influences K’/separation
  • 22.  Carry out experiments at different solvent strengths and select the best option w.r.t. K’ and separation Solvent type  Commonly used solvents: methanol, acetonitrile, THF  Methanol is preferred since most buffers have greater solubility in methanol/water mixture than in ACN or THF.  Common challenges faced with acetonitrile and THF: • Acetonitrile: trace amount of amines may/may not influence the separation • THF: can form peroxides on storage which can impact the separation process. Buffer concentration  Increase in buffer concentrations selectively decreases the retention of all cationic sample ions  Silanol ionization is not reproducible from one batch of column to another Amine modifiers  Improve the peak shape of basic components  Retention of basic components will decrease with increase in concentration of amines Column Type  Columns of different types have different selectivities.  Can be used in conjunction with the previous parameters Different Absorptivities  Determine the maxima for each component in the sample  Multi- wavelength detection using dual λ or PDA detector  For molecules with low absorptivities, use greater path length of detector cell  For components not having UV absorbance, the following detectors can be used…  Fluorescence  RI  ECD  MS
  • 23.  The above can be used in series with an UV detector Different Solubilities  Solid phase extraction  Liquid liquid extraction Different Concentrations  Solid phase extraction  Liquid liquid extraction  Gradient elution  Multi- wavelength detection using dual λ or PDA detector  For molecules with different concentrations, use different detectors in combination Developing A Separation  A reversed phase example  Isocratic method development technique  Excedrin brand analgesic and salicylamide • Caffeine • Acetaminophen • Aspirin • Salicylamide  Select a column • C18, C8, etc. • Non end capped / end capped / highly functionalized / embedded polar group • Short columns are good for fast screening of separation conditions.  Knowledge of Sample components / Molecular structure information to choose bonded phase characteristics such as bonding chemistry, bonding mode, end capping and carbon load.  Sample retention on the column is a product of chemical interactions.
  • 24.  Understanding of separation goals to choose column and particle physical characteristics , column bed dimensions, particle shape, particle size, surface area and pore size.  Select an initial mobile phase. • Sample solubility • Compatible with the detector • typically a blend of a “strong” eluent and a “weak” eluent  Always choose a mobile phase that is too strong for the first try.  Other important considerations. • Will your detector see the components? • How much sample should I inject? • How good does the separation have to be? • How fast does the separation have to be? • How much time do you have to experiment?  Our first goal is to adjust the mobile phase strength to elute the sample components at a reasonable k’ • Use a high flow rate - k’ is independent of flow rate. • Use a short column - k’ is independent of column length. • This allows a relatively fast experiment.  Experimental conditions: • Symmetry C18 column, 50 x 4.6 mm • Methanol and phosphate/acetate buffer, 1.5 ml / min. (about 3 column volumes / min) • Alliance 2690 Separation Module • UV detection at 250 nm.  2.5 minutes for new mobile phase to wash through.  5 minute chromatogram = k’ of almost 15  With optimized k’s, we can look at the selectivity of the separation.
  • 25.  If necessary we can change the mobile phase or the column to change the selectivity. Initial Run with 80% methanol : 20% Buffer During first run, mobile phase used is 80 %methanol and 20% buffer.
  • 26. AU 0.000.200.400.600.801.001.201.401.601.80Minutes0.501.001.502.002.503.003.504.004.505.00 All the components and the solvent peak elute out at same retention time. Now we will change mobile phase composition and will try to get better separation Now Methanol Concentration changed form 60 % to 50% so we found better resolution of three compounds.
  • 27. AU 0.000.501.001.50 AU 0.000.501.001.50Minutes0.501.001.502.002.503.003.504.00
  • 28. AU 0.000.501.001.50 AU 0.000.501.001.50Minutes0.501.001.502.002.503.003.504.00
  • 29. Achieving Separation Now Methanol Concentration changed form 60 % to 50% so we found better resolution of three compounds AU 0.000.501.001.50 AU 0.000.501.001.50Minutes0.501.001.502.002.503.003.504.00 HPLC TROUBLESHOOTINGS
  • 30.
  • 31.
  • 32.
  • 33.
  • 34.
  • 35.
  • 36.
  • 37.
  • 38.
  • 39.
  • 40.
  • 41.
  • 42.
  • 43.
  • 44.
  • 45. GAS CHROMATOGRAPHY COLUMN SELECTION GUIDE FOR GC Here the main question arises is how to choose the column for a particular compound? Different types of columns are available having different composition, polarity and temperature limits. Depending upon the polarity and chemical nature of the compound, a suitable column is selected meeting its maximum criteria. Each type of column has some applications for which it is used are given below. 1. ZB-1 (Manufactured by Phenomenex-USA) MATERIAL POLARITY TEMP. LIMITS 100% dimethylpolysiloxane Low -60o to 370o C APPLICATIONS Amines Drugs of abuse Ethanol Essential oils Gases (refinery, noble) Hydrocarbons MTBE Natural gas odorants Oxygenates Pesticides PCB’s Semi-volatiles Simulated distillation Solvent impurities Sulfur compounds 2. ZB-5 (Manufactured by Phenomenex-USA) MATERIAL POLARITY TEMP. LIMITS 5%-phenyl-95%- dimethylpolysiloxane Low -60o to 370o C APPLICATIONS
  • 46. Alkaloids Drugs FAMEs Halo-hydrocarbons Phenols Pesticides/Herbicides Essential oils PCBs/Aroclors Residual solvents 3. ZB-35 (Manufactured by Phenomenex-USA) MATERIAL POLARITY TEMP. LIMITS 35%-phenyl-65%- dimethylpolysiloxane Medium 50o to 360o C APPLICATIONS Aroclors Amines Pesticides Pharmaceuticals Semi-volatiles 4. ZB-50 (Manufactured by Phenomenex-USA) MATERIAL POLARITY TEMP. LIMITS 50%-phenyl-50%- dimethylpolysiloxane Medium 40o to 340o C APPLICATIONS Basic drugs Glycols Pesticides/Herbicides Steroids Antidepressants 5. ZB-624 (Manufactured by Phenomenex-USA)
  • 47. MATERIAL POLARITY TEMP. LIMITS 6%-cyanopropylphenyl- 94%- dimethylpolysiloxane Medium -20o to 260o C APPLICATIONS Volatile Organic Compounds 6. ZB-1701 (Manufactured by Phenomenex-USA) MATERIAL POLARITY TEMP. LIMITS 14%-cyanopropylphenyl- 86%- dimethylpolysiloxane Medium -20o to 300o C APPLICATIONS Pesticides/Herbicides PCBs Alcohols Aromatic hydrocarbons Organic acid PAHs Phenols Steroids Tranquilizers 7. ZB-WAX (Manufactured by Phenomenex-USA) MATERIAL POLARITY TEMP. LIMITS Polyethylene glycol (PEG) High 20o to 260o C APPLICATIONS
  • 48. Free acids Alcohols Aldehydes Aromatics Essential oils Flavors/Fragrances Glycols Pharmaceuticals Solvents Styrene Xylenes OVIs 8. ZB-FFAP (Manufactured by Phenomenex-USA) MATERIAL POLARITY TEMP. LIMITS Nitroterephthalic acid modified Polyethylene glycol (PEG) High 40o to 260o C APPLICATIONS Acrylates FAMEs Volatile free acid Alcohols Organic acids Phenols Aldehydes Ketones Flavors/Fragrances GC METHOD DEVELOPMENT
  • 49. INITIAL STEPS  First of all check the nature of the compound i.e. whether it is volatile or non-volatile.  If it is volatile then check the melting point/ boiling point of the compound.  If the melting point/ boiling point is not observed, then find it out by melting point/ boiling point apparatus.  Note down the melting point/ boiling point of each compound. SET GC PARAMETERS  Temperature sequence is always in the increasing order of Oven, Injector and Detector (OID).  Oven temperature is set 15oC to 20oC higher than the melting point/ boiling point of the compound.  The reason of keeping the oven temperature higher than the melting point/ boiling point of the compound is to volatilize compound easily.  Injector temperature has to be kept higher than that of the oven temperature and furthermore, detector temperature has to be kept higher or equal to the injector temperature.  The reason to keep detector temperature higher or equal to the injector temperature is that the analyte should be converted back to its original form i.e. liquid form and should remain in vapour form so that it can be eluted easily from the column up to the detector. METHOD OF ANALYSIS ISOTHERMAL ANALYSIS
  • 50. Set the oven at one fixed temperature and run the sample mixture. Observe the pattern of the peaks in the chromatogram TEMPERATURE PROGRAMMING Set the range in oven temperature according to the melting point/ boiling point of the compounds in the mixture. Set the increase in temperature (oC/min). Run the sample mixture and observed the pattern of the peaks in the chromatogram. Observe the difference in temperature programming as compared to isothermal analysis. GC TROUBLESHOOTINGS OBSERVATION POSSIBLE CAUSE SOLUTION
  • 51. A. Baseline Drifting 1. Accumulation of stationary phase. 1. Remove the end section of the column. 2. Carrier gas cylinder pressure too low to allow control. 2. Replace the carrier gas cylinder. Increase the pressure. 3. Drifting carrier gas or combustion gas flows. 3. Check the gas controllers. 4. Accumulation of impurities in the column. 4. Check impurity levels in the gas source. Use correct gas purity. B. Baseline Falling 1. Carrier gas leak in the system. 1. Perform a leak test. 2. Column is baking out. 2(a). Check the tightness of the connections on the carrier gas line. 2(b). Allow enough time for the column to stabilize. C. Baseline Falling Away After a High Initial Value 1. Purge valve left closed during acquisition. 1. Alter the GC program. See your GC user manual for details. 2. Inadequate purge flow rate. 2. Increase the purge flow rate.
  • 52. 3. Purge valve left closed for too long. 3. Shorten the purge time. 4. Solvent tail peak. 4. Increase the solvent delay. Shorten the purge time. 5. Pre-filters are dirty. (When using a quadrupole MS detector). 5. Contact your service representative. D. Baseline Rising 1. Accumulation of impurities in the column. 1. Check impurity levels in the gas source. Use correct gas purity. 2. Contaminated detector. 2. Check the detector and clean it. 3. There is bleeding from the GC column. 3. Condition column. Change the column 4. Air is leaking into the system. 4. Trace and repair the leak. E. Baseline Rising Under Temperature Program Control 1. Column contaminated. 1. Recondition the column. F. Baseline High Standing Current 1. Carrier gas flow rate too high. 1. Reduce the carrier gas flow. 2. Column 2. Recondition the
  • 53. contaminated. column. 3. Contaminated gases. 3. Replace gas cylinders. Replace the gas filters. 4. Excessive column stationary phase bleeding. 4. Check the oven temperature, ensuring that it doesn’t exceed the column upper limit. Recondition the column. Replace the column. 5. Loose connections. 5. Ensure that all interconnections and screw connections are tight. G. Baseline Irregular Shape: S-Shaped 1. Excessive column bleed during column temperature programming. 1. Check the tightness of the connections on the carrier gas line. 2. Oxygen contamination is decomposing the stationary phase. 2. Install oxygen filters in the carrier gas line. Check the pneumatic and inlet systems for leaks. Use correct gas purity with low oxygen content.
  • 54. H. Baseline High Frequency Noise 1. Contaminated detector. 1. Check the detector and clean it. 2. Combustion gas flow too low or too high. 2. Check the detector gas flows. 3. Column contaminated. 3. Condition the column. 4. Contaminated detector gas supply. 4. Check the gas purity and install appropriate filters. 5. Detector temperature higher than column maximum temperature. 5. Reduce the detector temperature to the column temperature upper limit. 6. Loose column fittings. 6. Tighten fittings accordingly. I. Baseline Spiking 1. Column too close to flame. (When using an FID) 1. Lower the column to the correct position (2- 3 mm below the tip of the jet). 2. Dirty jet or detector. 2. Isolate the detector from the electronics. If the spiking disappears, clean the jet and the collector. 3. FID temperature too 3. Increase the FID
  • 55. low. (When using an FID) temperature to at least 150 °C. J. Peaks Broadening 1. Column flow too high. 1. Reduce the flow to slightly above optimum. 2. Column flow too low. 2. Increase the flow to slightly above optimum. 3. Split flow too low in split injection. 3. Increase the flow to 40 - 50 mL/min. 4. Column performances degraded. 4. Test the column at the optimum flow rate. 5. Dirty injector. 5. Clean or replace the liner. 6. Stationary phase accumulated in the outlet. 6. Remove the last two coils from the column. 7. Detector base body temperature too low. 7. Increase the temperature to 5 °C below the column maximum. 8. The sample is overloading the column. 8. Reduce the amount and/or concentration of the sample. K. Double Peaks 1. Injection speed too low. 1. Inject more rapidly in a smooth motion.
  • 56. 2. Wrong autosampler injection speed or mode. 2. Use a higher speed. L. Peak Fronting 1. Column or detector overloaded. 1. Decrease the injected amount. Decrease the analyte concentrations. Increase the split ratio. 2. Column temperature too low. 2. Increase the temperature. 3. Stationary phase too thin. 3. Use a thicker-film column. 4. Poor injection technique. 4. Repeat, with better injection technique. M. Ghost Peaks 1. Contaminated carrier gas. 1. Replace the cylinder. Replace the filter. 2. Contamination from laboratory glassware. 2. Ensure the glassware is clean and contamination-free. 3. Decomposition of injected sample. 3. Decrease the injection port temperature. Use the on-column injection technique. 4. Dirty injection 4. Carry out adequate clean-up of sample
  • 57. solution. prior to injection. N. Sample Peak Tailing 1. Column degradation causing activity. 1. Inject a test mixture and evaluate the column. 2. Column/oven temperature too low. 2. Increase the column/oven temperature. Do not exceed the recommended maximum temperature for the stationary phase. 3. Dirty liner. 3. Clean or replace the liner. 4. Glass wool or inlet liner causing activity. 4. Replace with fresh silanized wool and a clean inlet liner. 5. FID flame is out. 5. Light the flame. 6. Inlet temperature too low. 6. Increase the inlet temperature. 7. Poor or obstructed column connections. 7. Remake the column inlet connection. 8. Wrong stationary phase. 8. Replace the column according to the column manufacturer’s
  • 58. literature. O. Broad Ghost Peaks 1. Contaminated inlet or pneumatics. 1. Remove the column and bake out the inlet. Use a high-quality septum. Replace the split vent filter. Install an in-line filter between the pneumatics and the inlet. 2. Incomplete elution of previous sample. 2. Increase the final oven program temperature or total run time. Increase the column flow rate. P. Solvent Peak Tailing 1. Incorrect column position in inlet. 1. Reinstall the column. 2. Initial oven temperature too high (On Column). 2. Reduce the initial oven temperature. 3. Septum purge flow too low and/or split/splitless vent flow too low. 3. Check and adjust the septum purge and vent flows. 4. Too large injection size. 4. Reduce the injection size.
  • 59. EXERCISE FOR GC METHOD DEVELOPMENT
  • 60. Method of Analysis Product name Mixture Test to be performed To separate the components from the mixture Analysis as per In house specification GC Parameter: Column 2m-10% SE-30, SIGMA (BARODA) Mobile phase (Carrier gas) Nitrogen gas (UHP) Flow rate 15 kg/cm2 Oven temperature temperature programming given (550-1900C) Injector temperature 150°C Detector temperature 200°C Injection volume 0.1 μl. Run time Approx. 12min. Procedure Inject 0.1 μl of the sample mixture and observe the chromatogram. To perform the given exercise the following steps should be taken for effective method development. STEP#1 Solvents taken under consideration : Methanol
  • 61. Benzene Toluene O-xylene N, N-dimethyl aniline STEP#2 Check the melting point/ boiling point of each solvent. STEP#3 If not observed, then check it by melting point/ boiling point apparatus. STEP#4 Note down the melting point/ boiling point of each compound. 1. Methanol- 640-660C 2. Benzene- 790-810C 3. Toluene- 1090-1120C 4. O-xylene- 1420-1450C 5. N, N-dimethyl aniline- 1910-1950C STEP#5 SAMPLE MIXTURE PREPARATION
  • 62. Take two drops of each solvent in a clean dry test tube. Mix properly until a clear solution is observed. STEP#6 SET GC PARAMETERS Column : 2m-10% SE-30, SIGMA (BARODA) Oven temperature : temperature programming given (550-1900C) Injector temperature : 1500C Detector temperature : 2000C Air flow : 10 kg/cm2 H2 flow : 1 kg/cm2 N2 flow : 15 kg/cm2 Sample injection volume : 0.1 μl STEP#7 Inject 0.1 μl of sample mixture under temperature programming (550-1900C) and observe the elution pattern (peaks) in the chromatogram.