Download to read offline
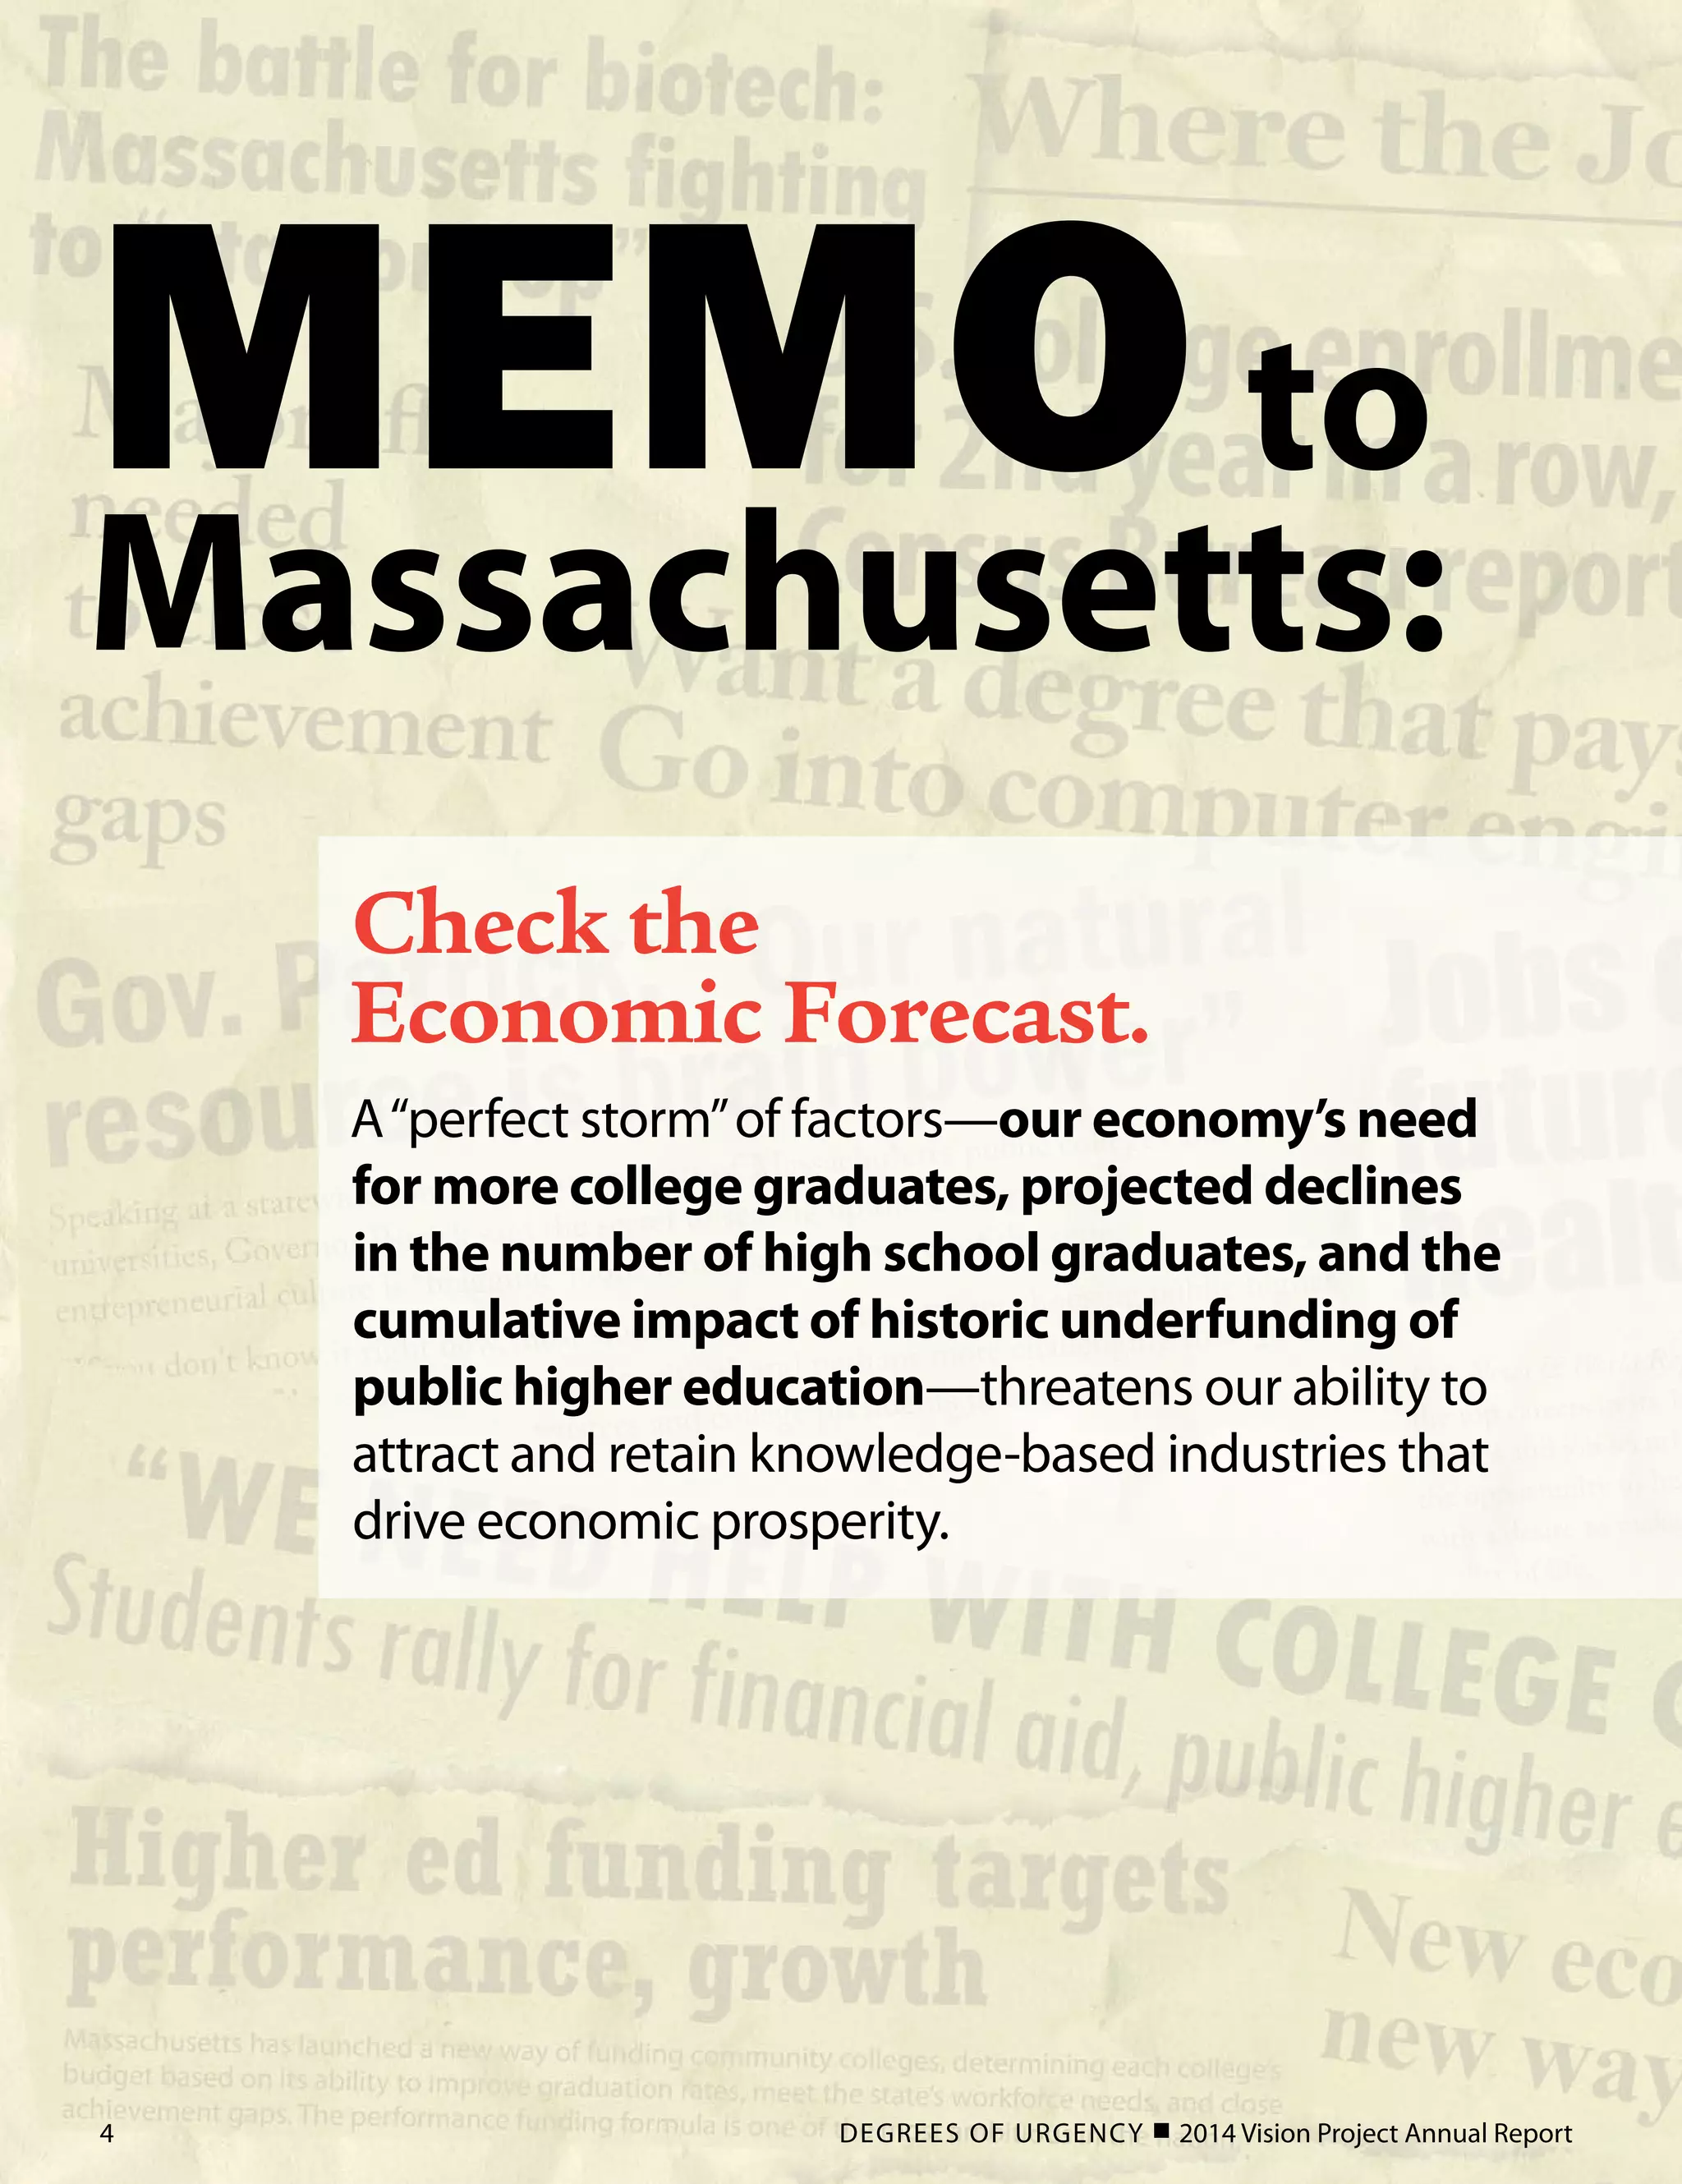
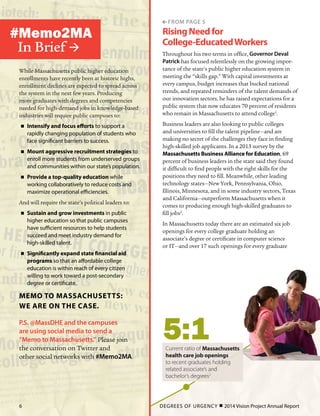
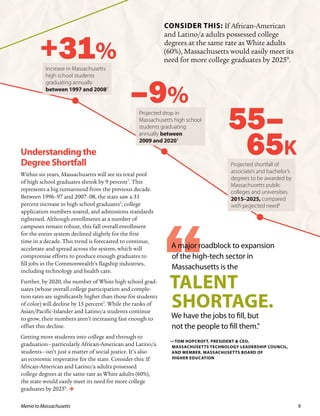

Massachusetts faces a looming shortage of college graduates due to declining high school graduation rates and historic underfunding of public higher education, threatening the economy's ability to attract knowledge-based industries. The report outlines the need for increased enrollment and graduation rates, specifically targeting underserved groups, alongside sustained financial investment from the state. Without significant changes, an estimated shortfall of 55,000 to 65,000 degrees is projected by 2025, which could hinder the state's economic competitiveness.

![Higher Education in Punjab [www.writekraft.com]](https://cdn.slidesharecdn.com/ss_thumbnails/highereducationinpunjab-180820091400-thumbnail.jpg?width=640&height=640&fit=bounds)


![Higher education in Punjab [www.writekraft.com]](https://cdn.slidesharecdn.com/ss_thumbnails/highereducationinpunjab-180716094707-thumbnail.jpg?width=640&height=640&fit=bounds)


