Downloaded 16 times


![34 ThE UnDErEDUCATED AmErICAn
and reached 30 percent in 2005. Going forward degree. As the red line on Figure 9 shows, this
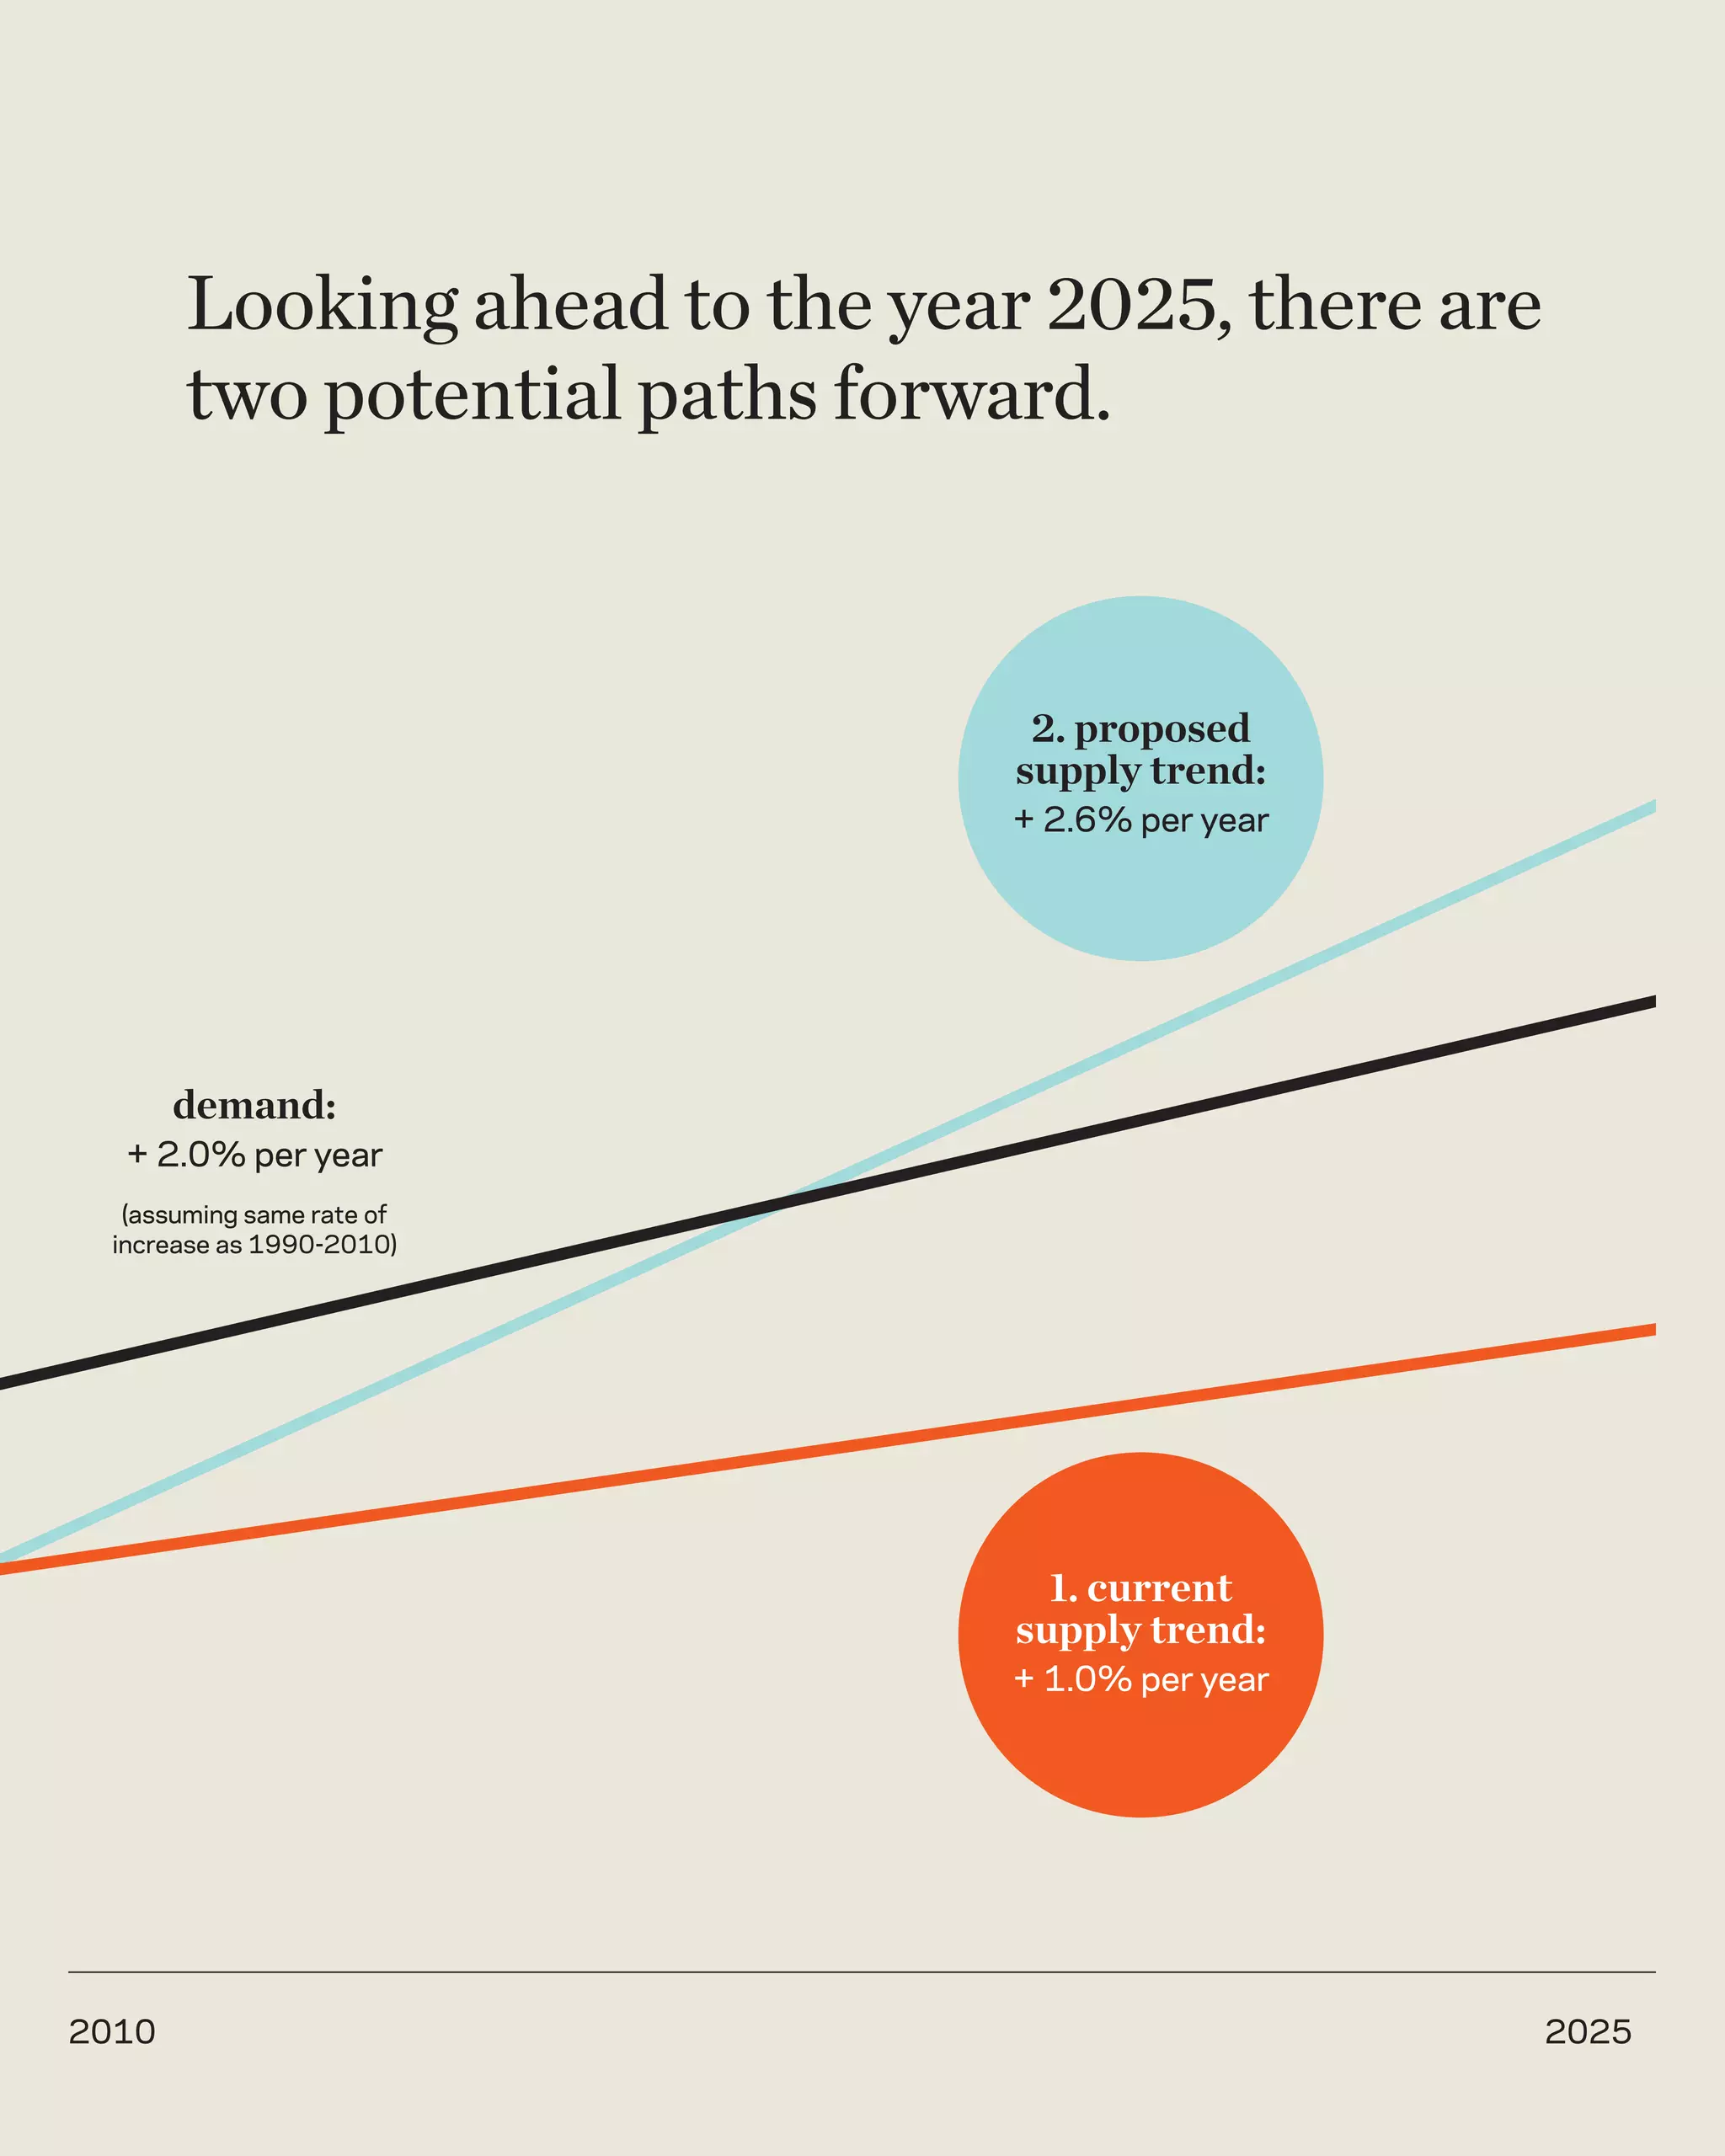
from 30 percent is likely to be different, and projected growth represents a 2.6 percent yearly
more difficult, than moving up to 30 percent. rise in the supply of college-educated workers,
an increase over the current yearly growth of
Consequently, we estimate that relative demand 1 percent. While 2.6 percent is higher than the
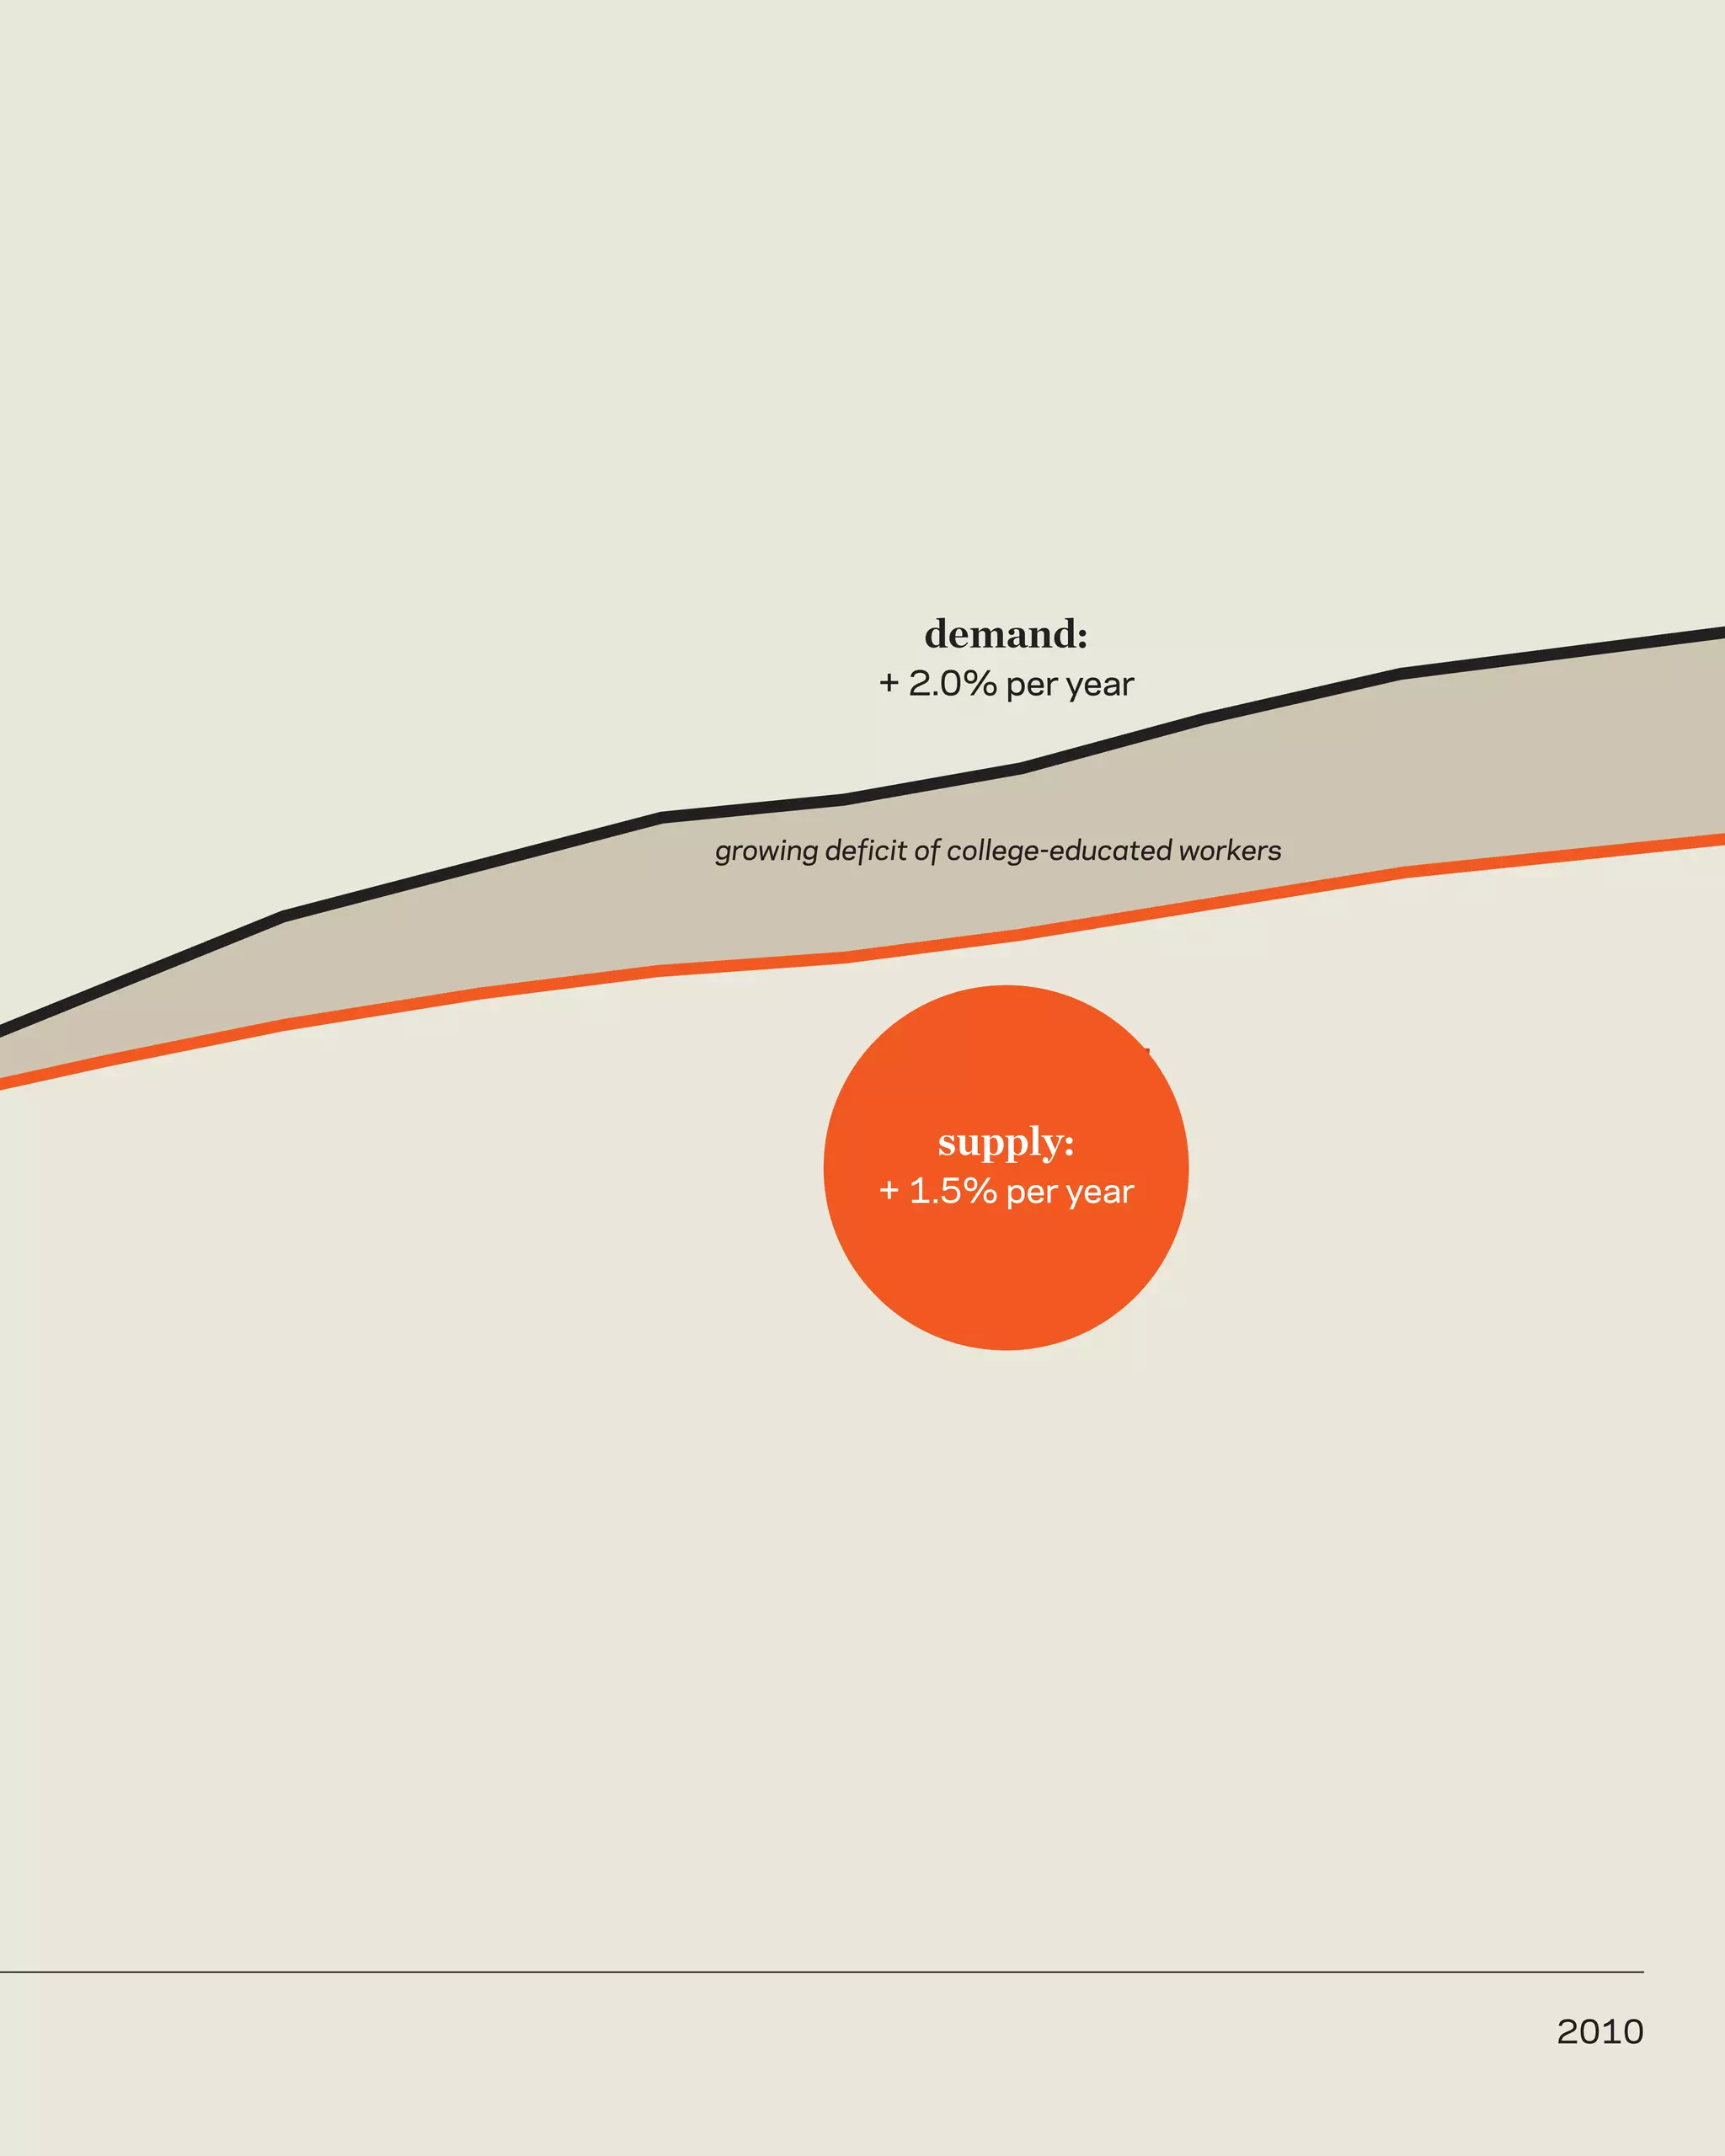
will only increase at 2.0 percent per year between recent growth rate of college workers, it is lower
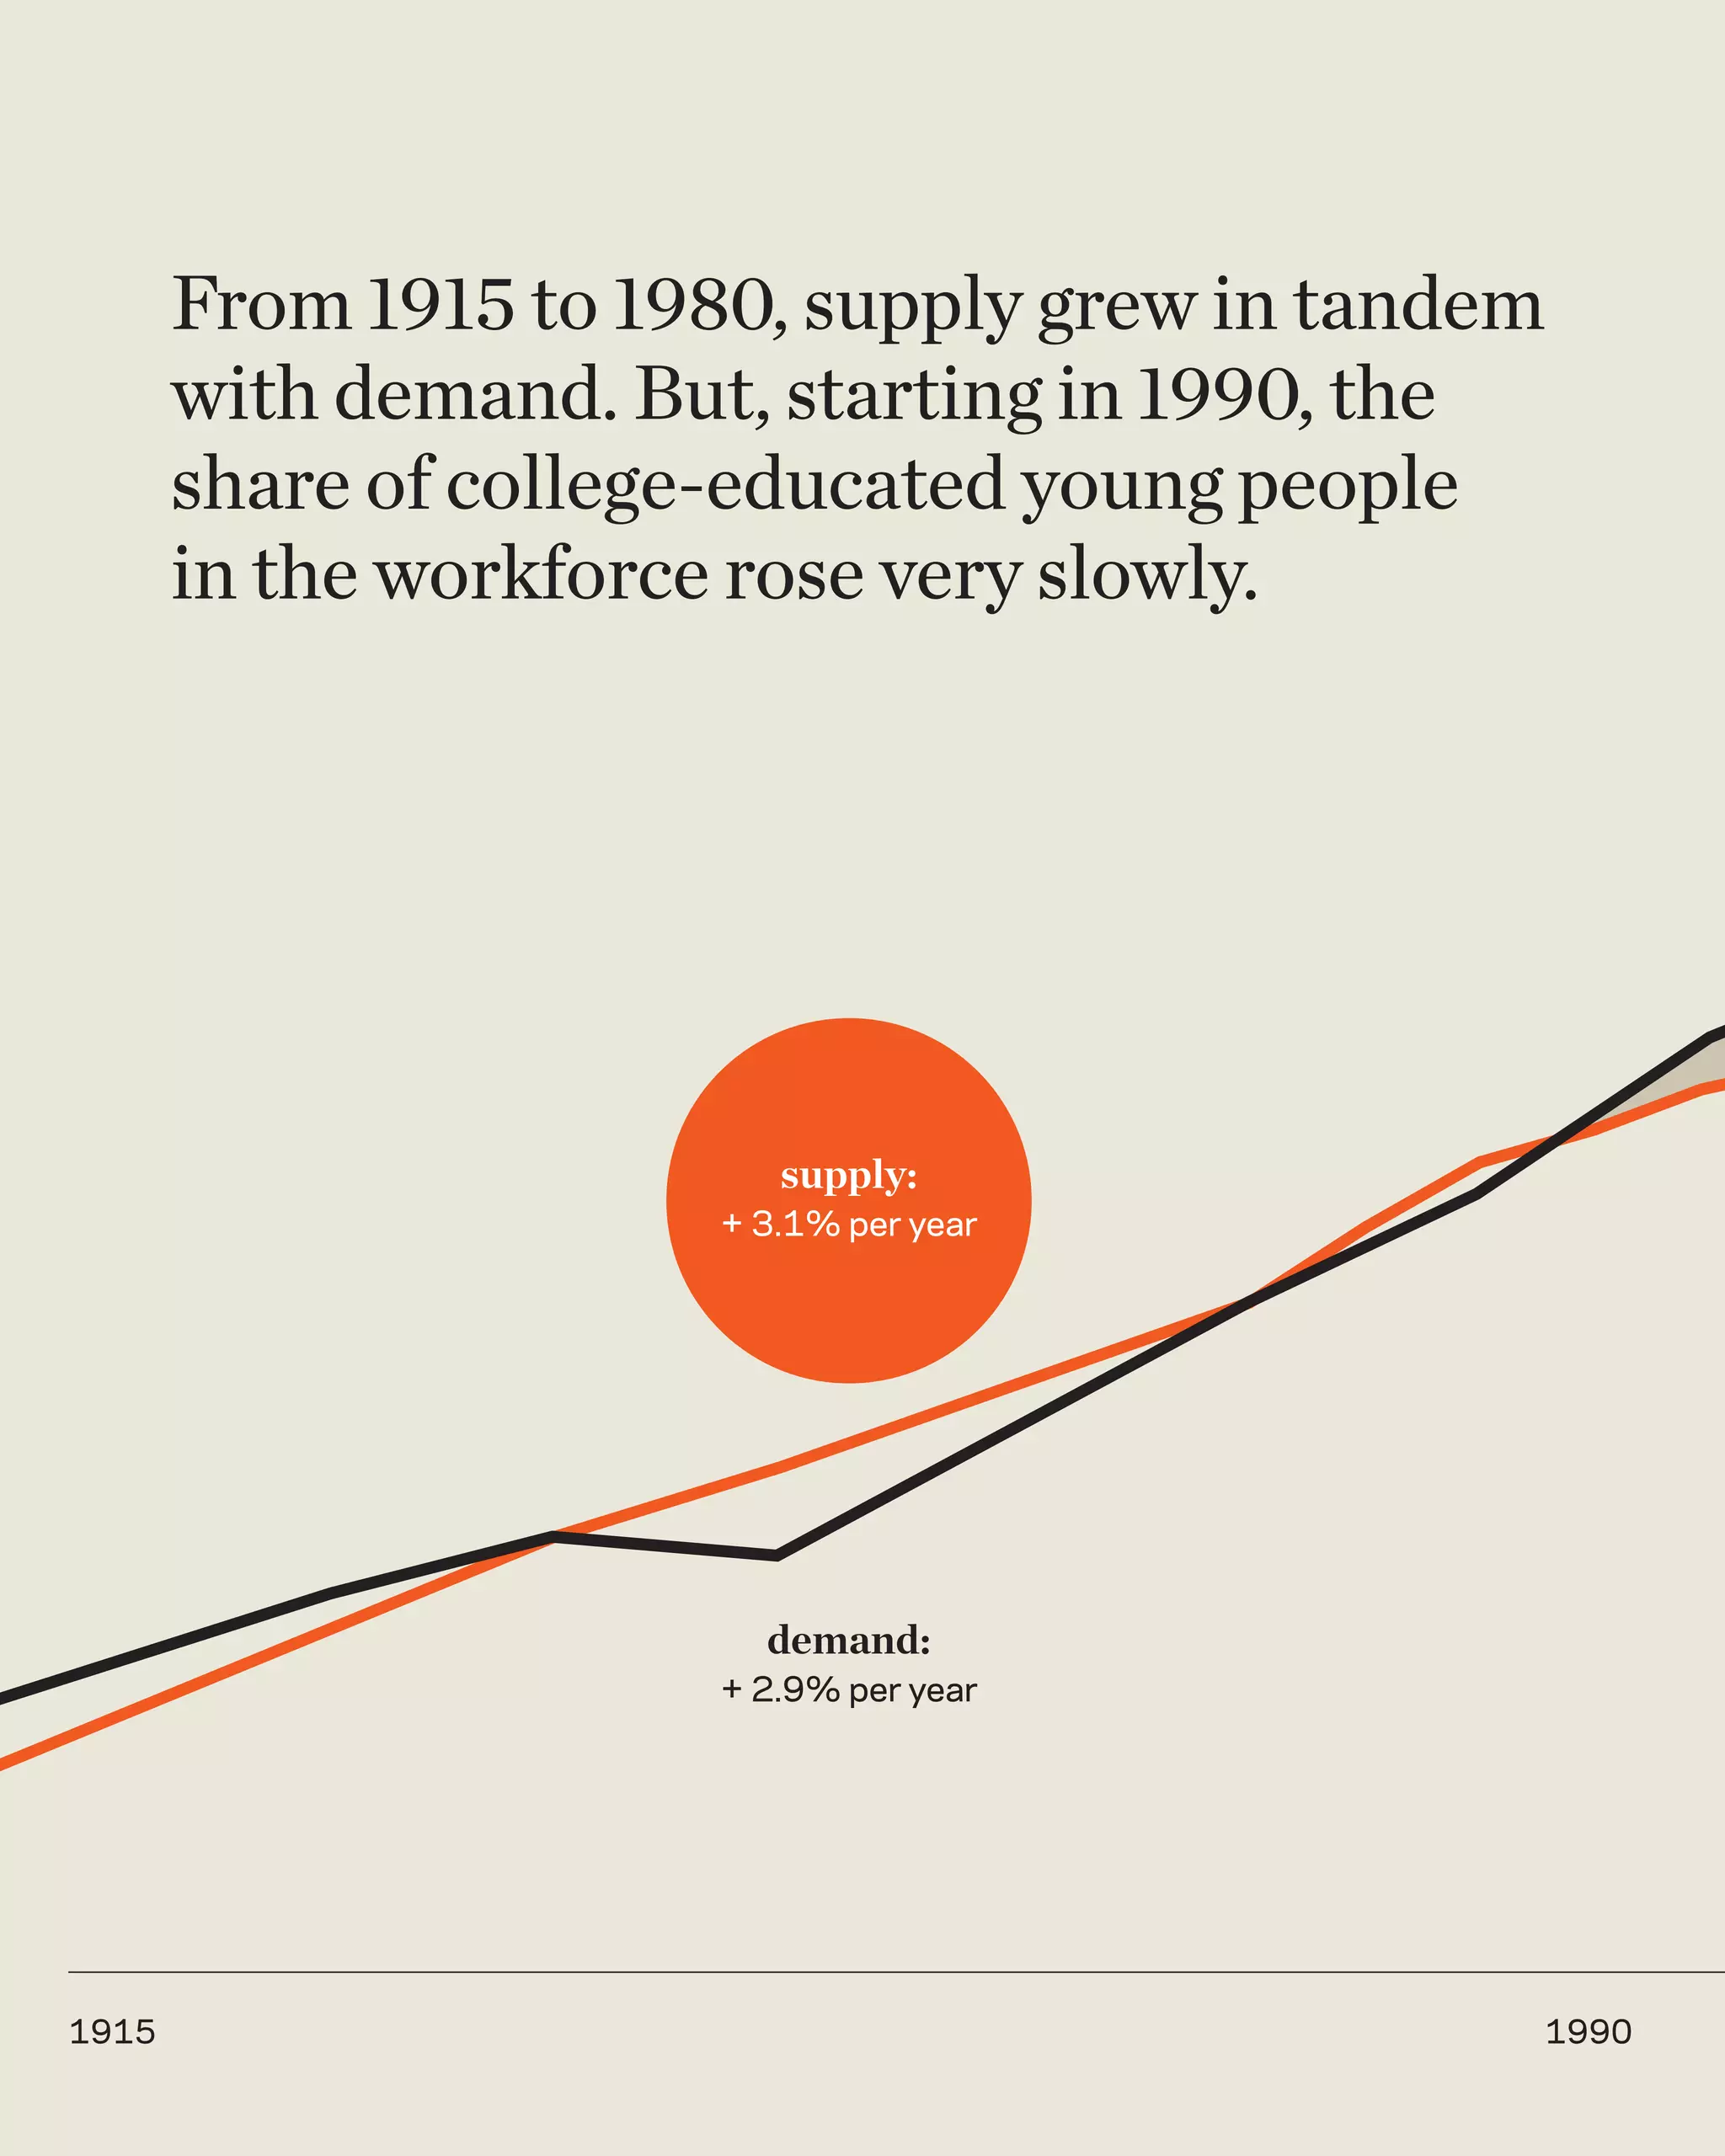
now and 2025. The dotted red line in Figure 9 than the 2.9 percent yearly growth rate that
shows supply rising by 1 percent a year, resulting existed between 1915 and 2010.
in an increasing gap between it and the yearly
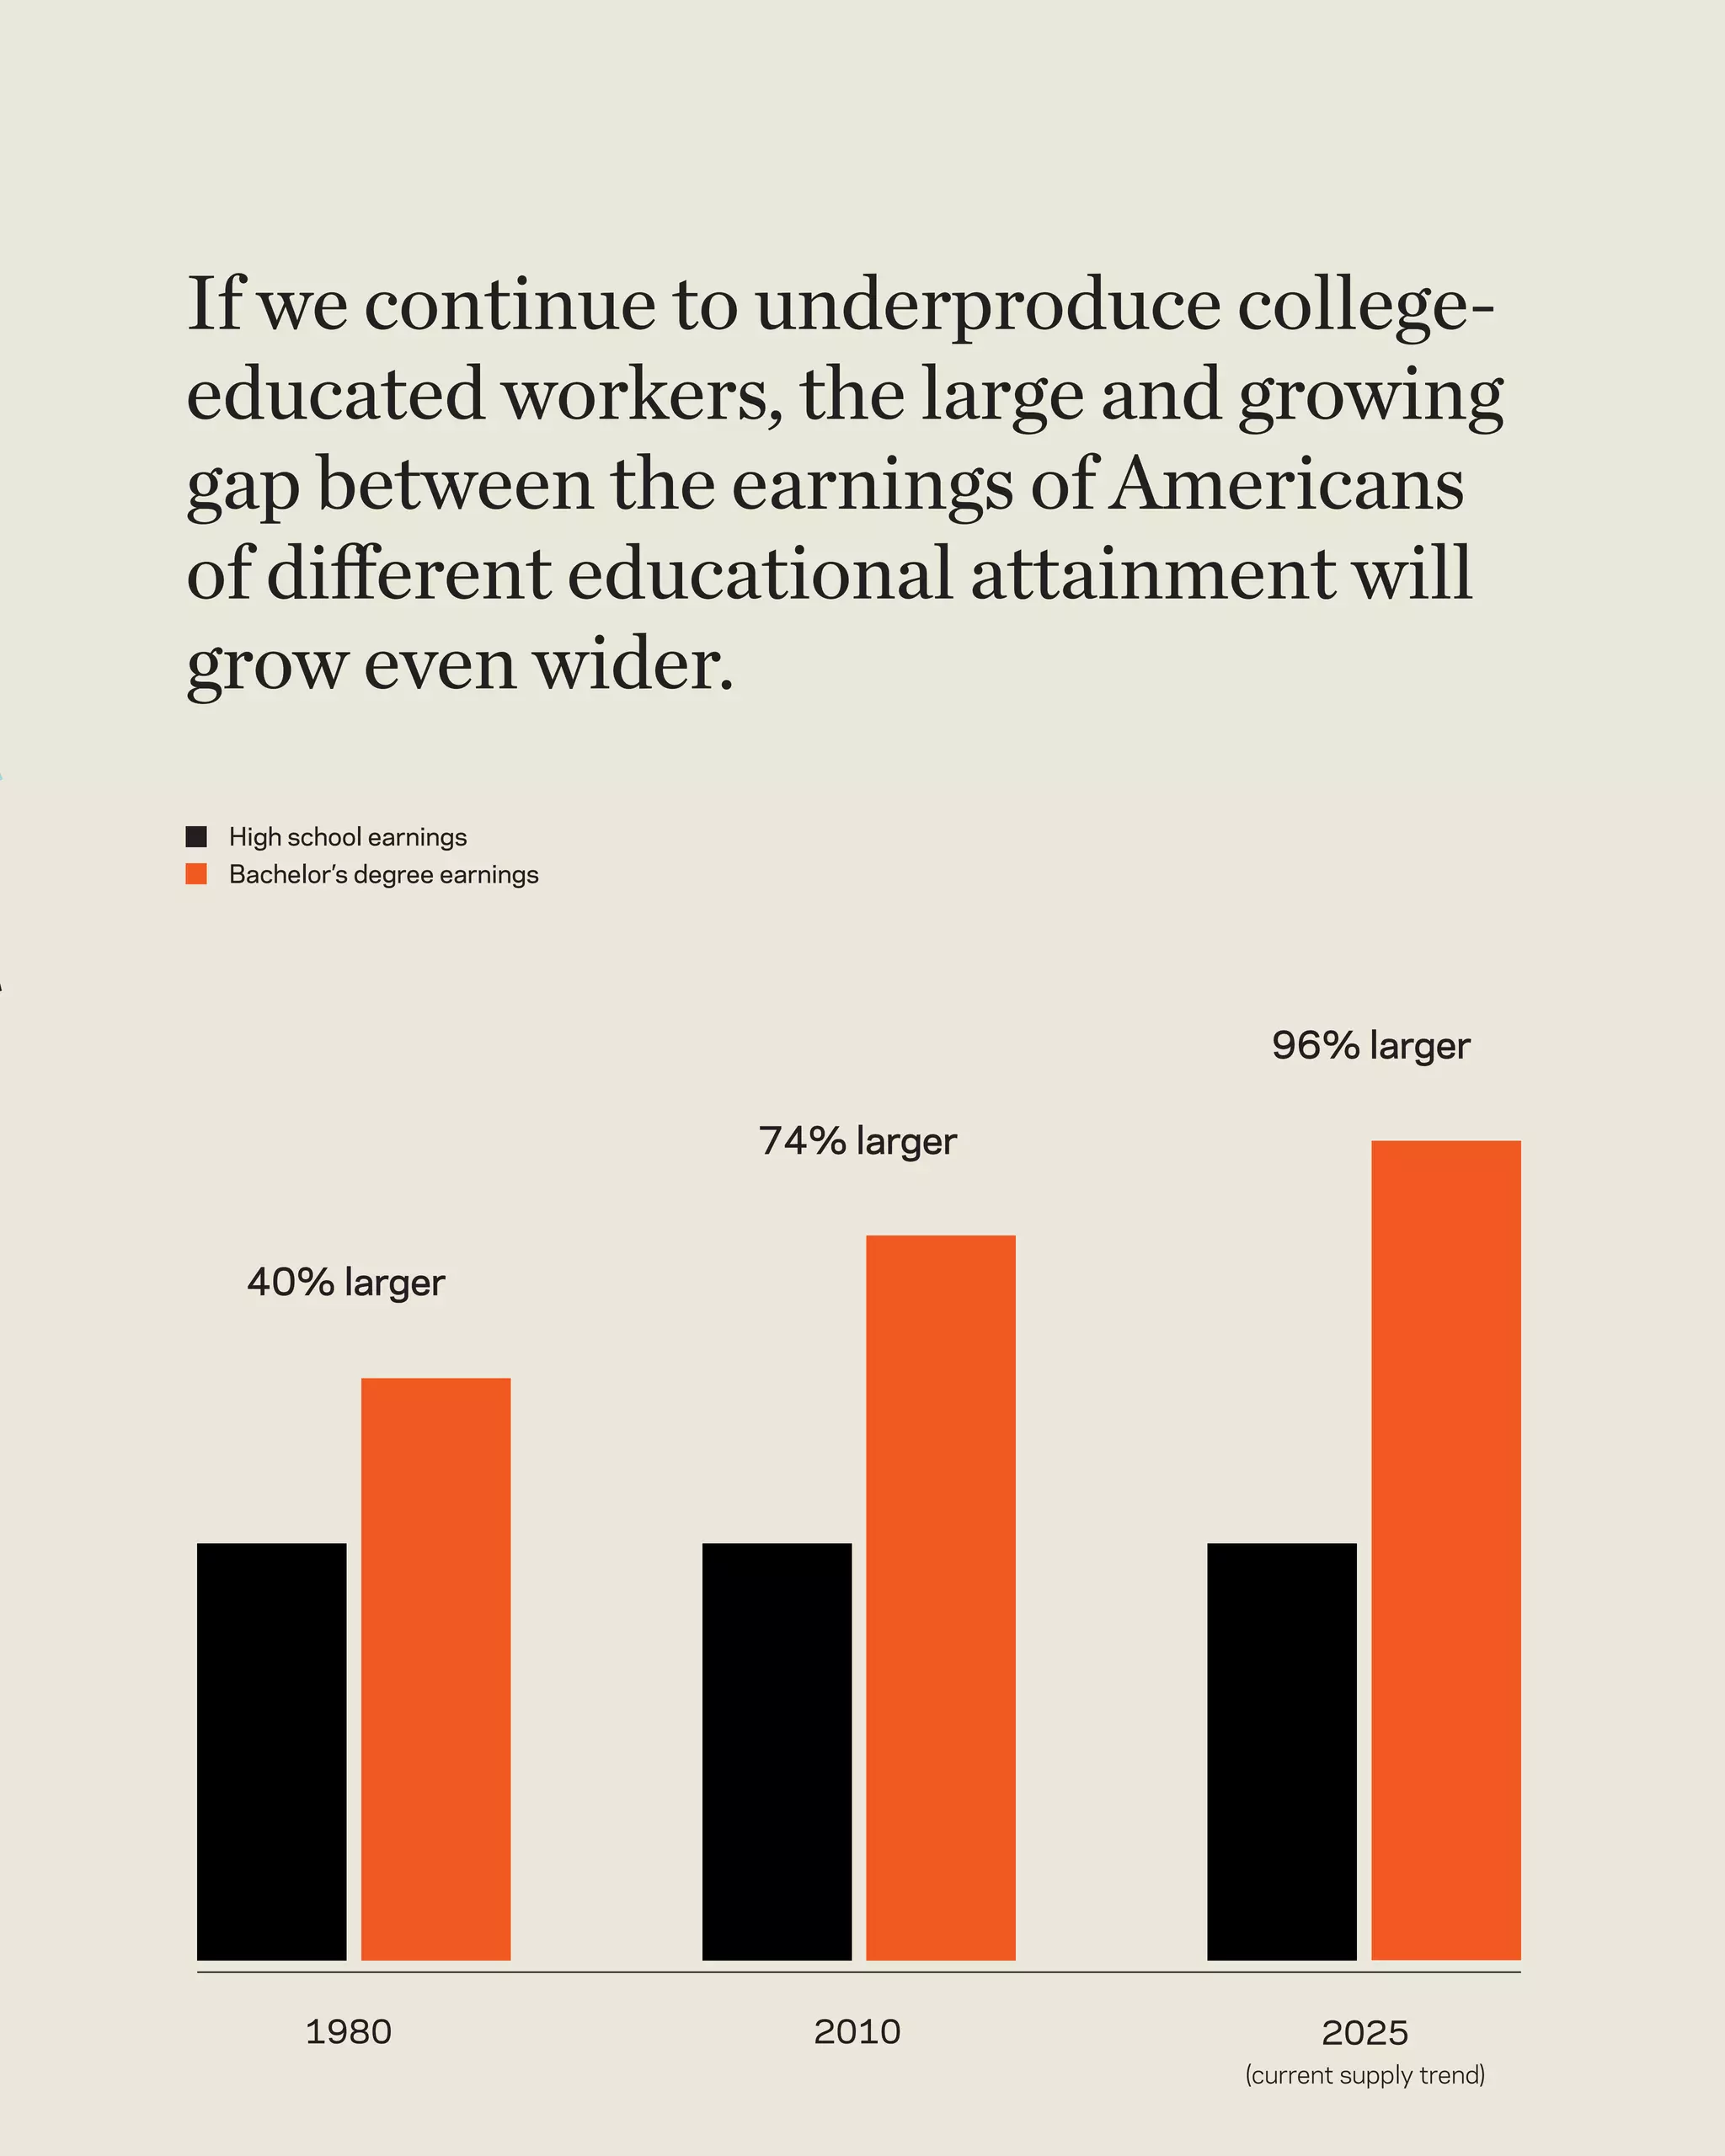
2 percent rise in demand. We project that this If we attain a 2.6 percent growth rate, three-
scenario, in which demand grows at a faster rate quarters of the labor force would have at least
than supply for fifteen years, will result in the some postsecondary education—34 percent
Bachelor’s degree to high school wage premium having obtained an Associate’s degree or attended
rising to 96 percent. some college, and 41 percent having obtained a
Bachelor’s degree. That would mean adding 15
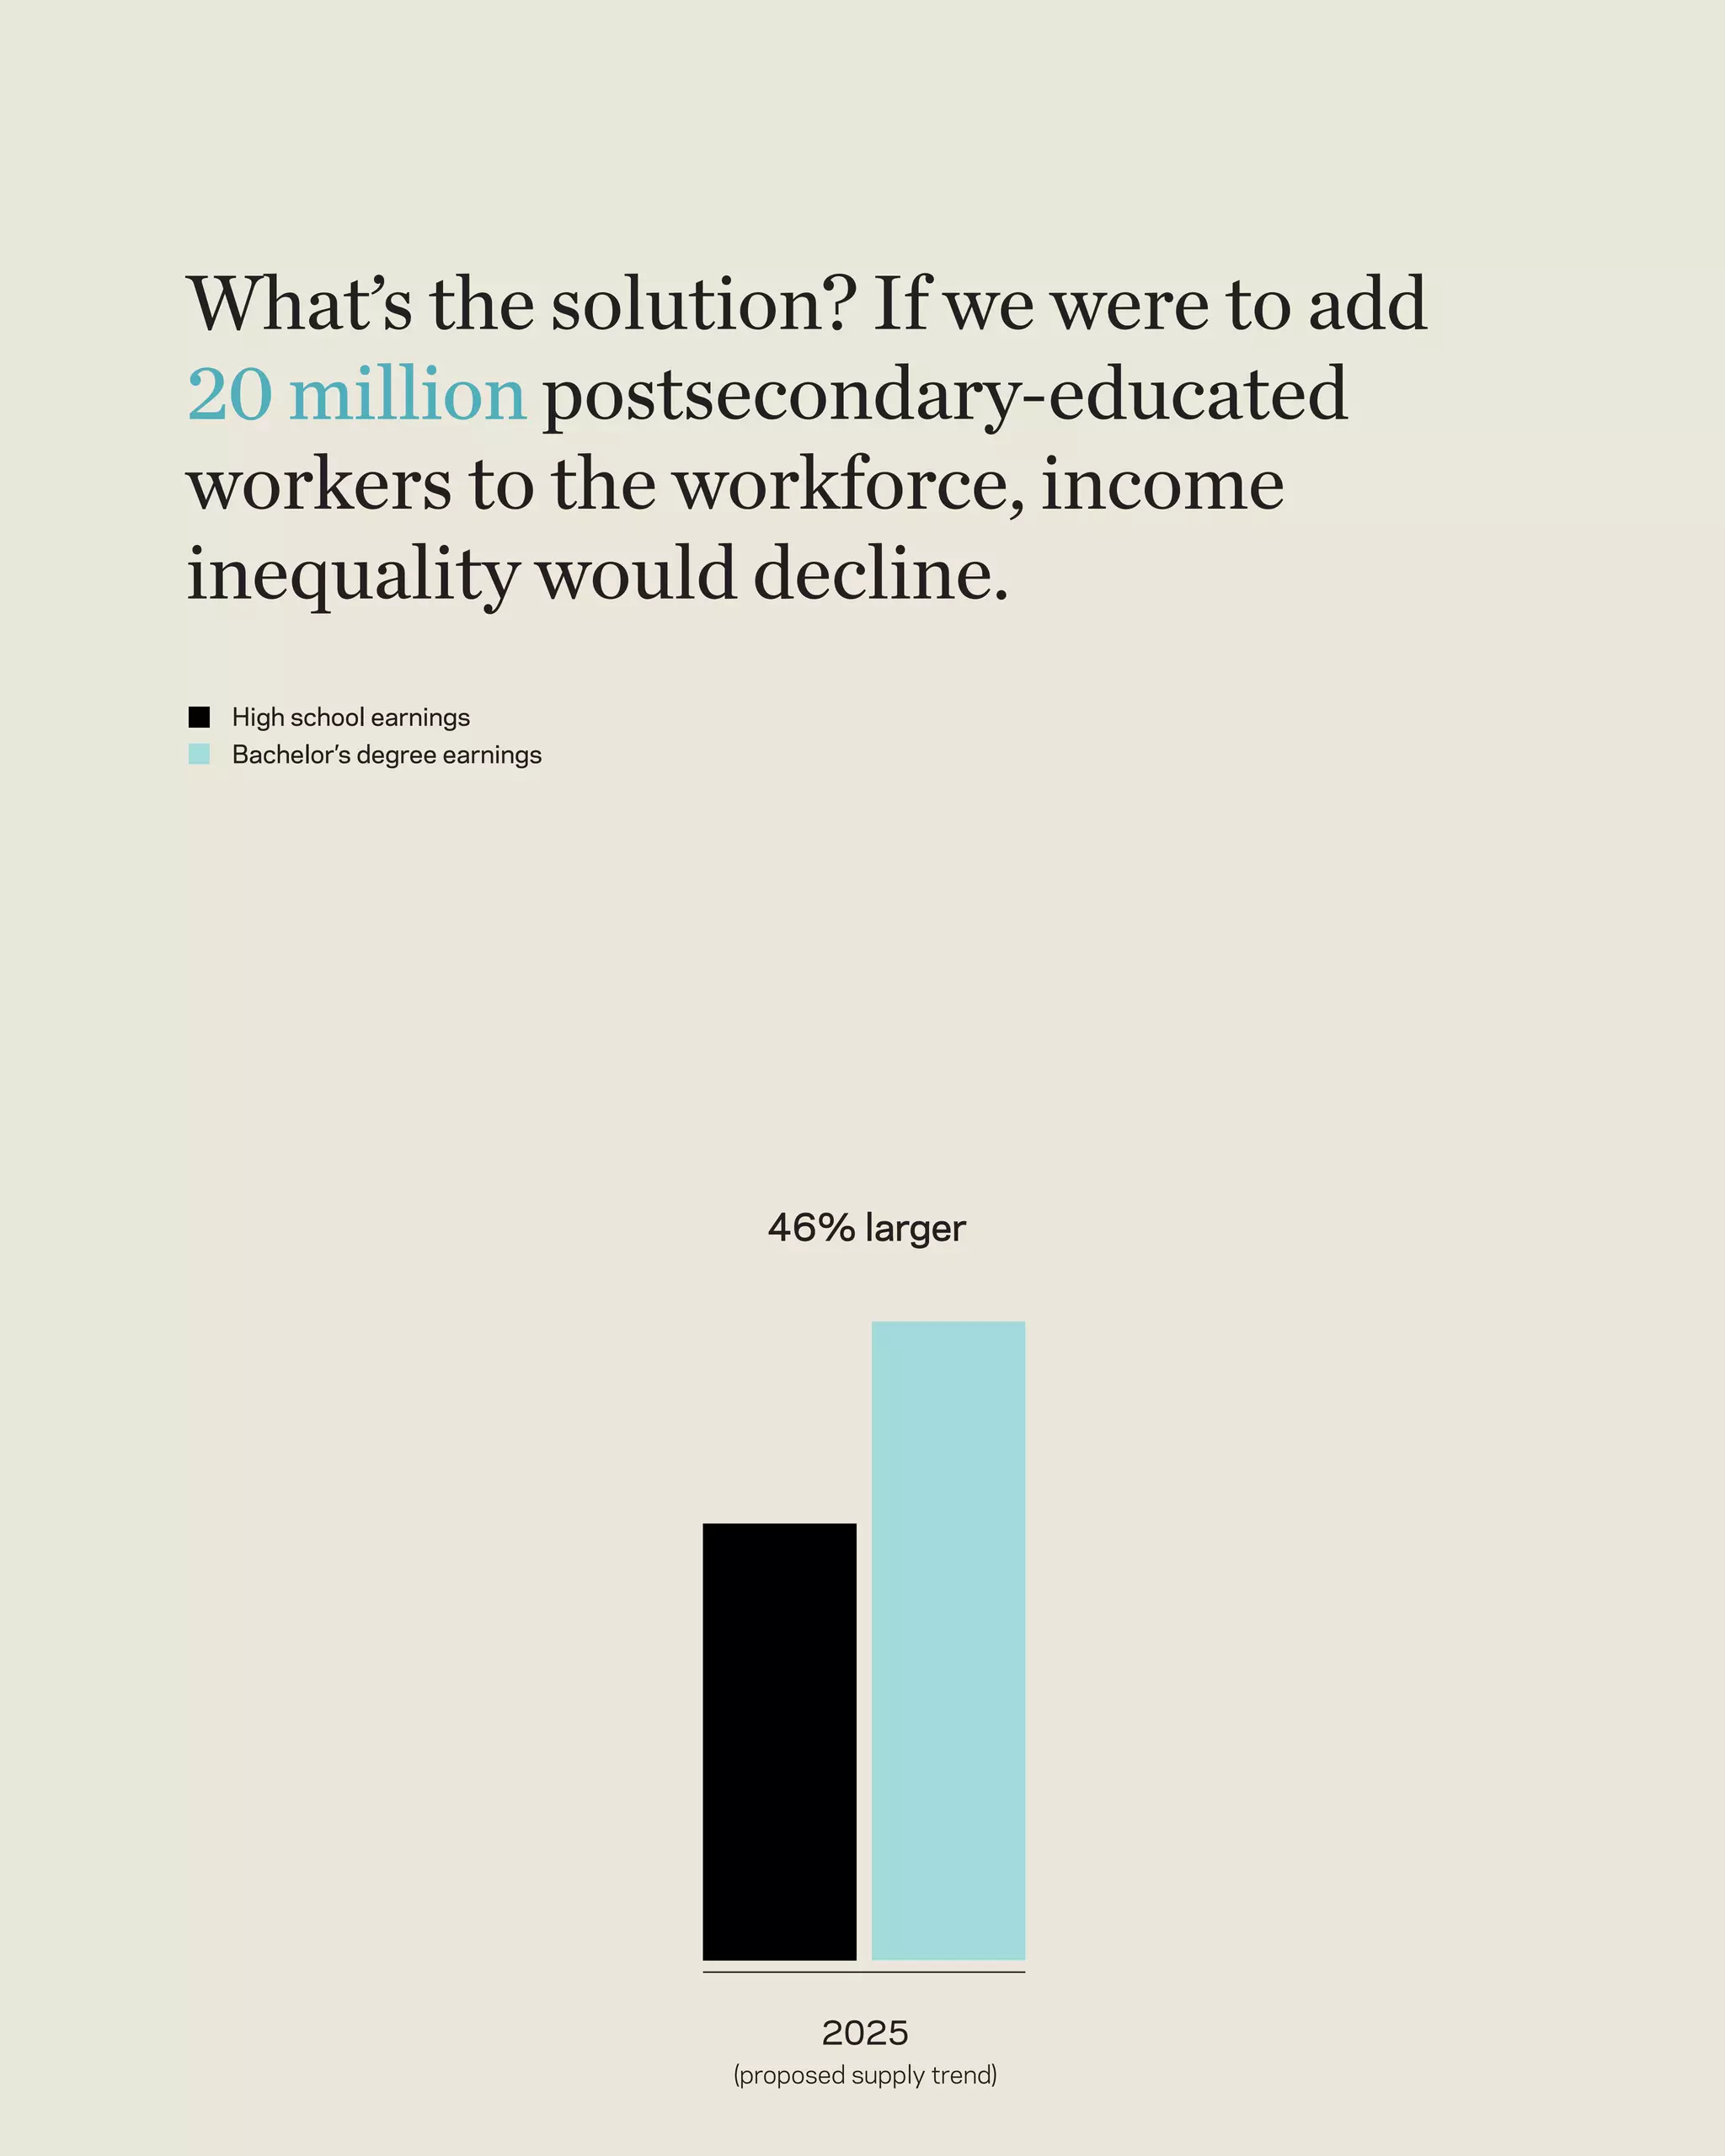
We estimate that to meet the demand for more million workers with Bachelor’s degrees above
skilled workers and to reduce inequality, the current levels and 5.3 million additional workers
number of young people attending college will with some college (including about 1.4 million
need to rise from 66 percent today to 86 percent additional workers with Associate’s degrees).
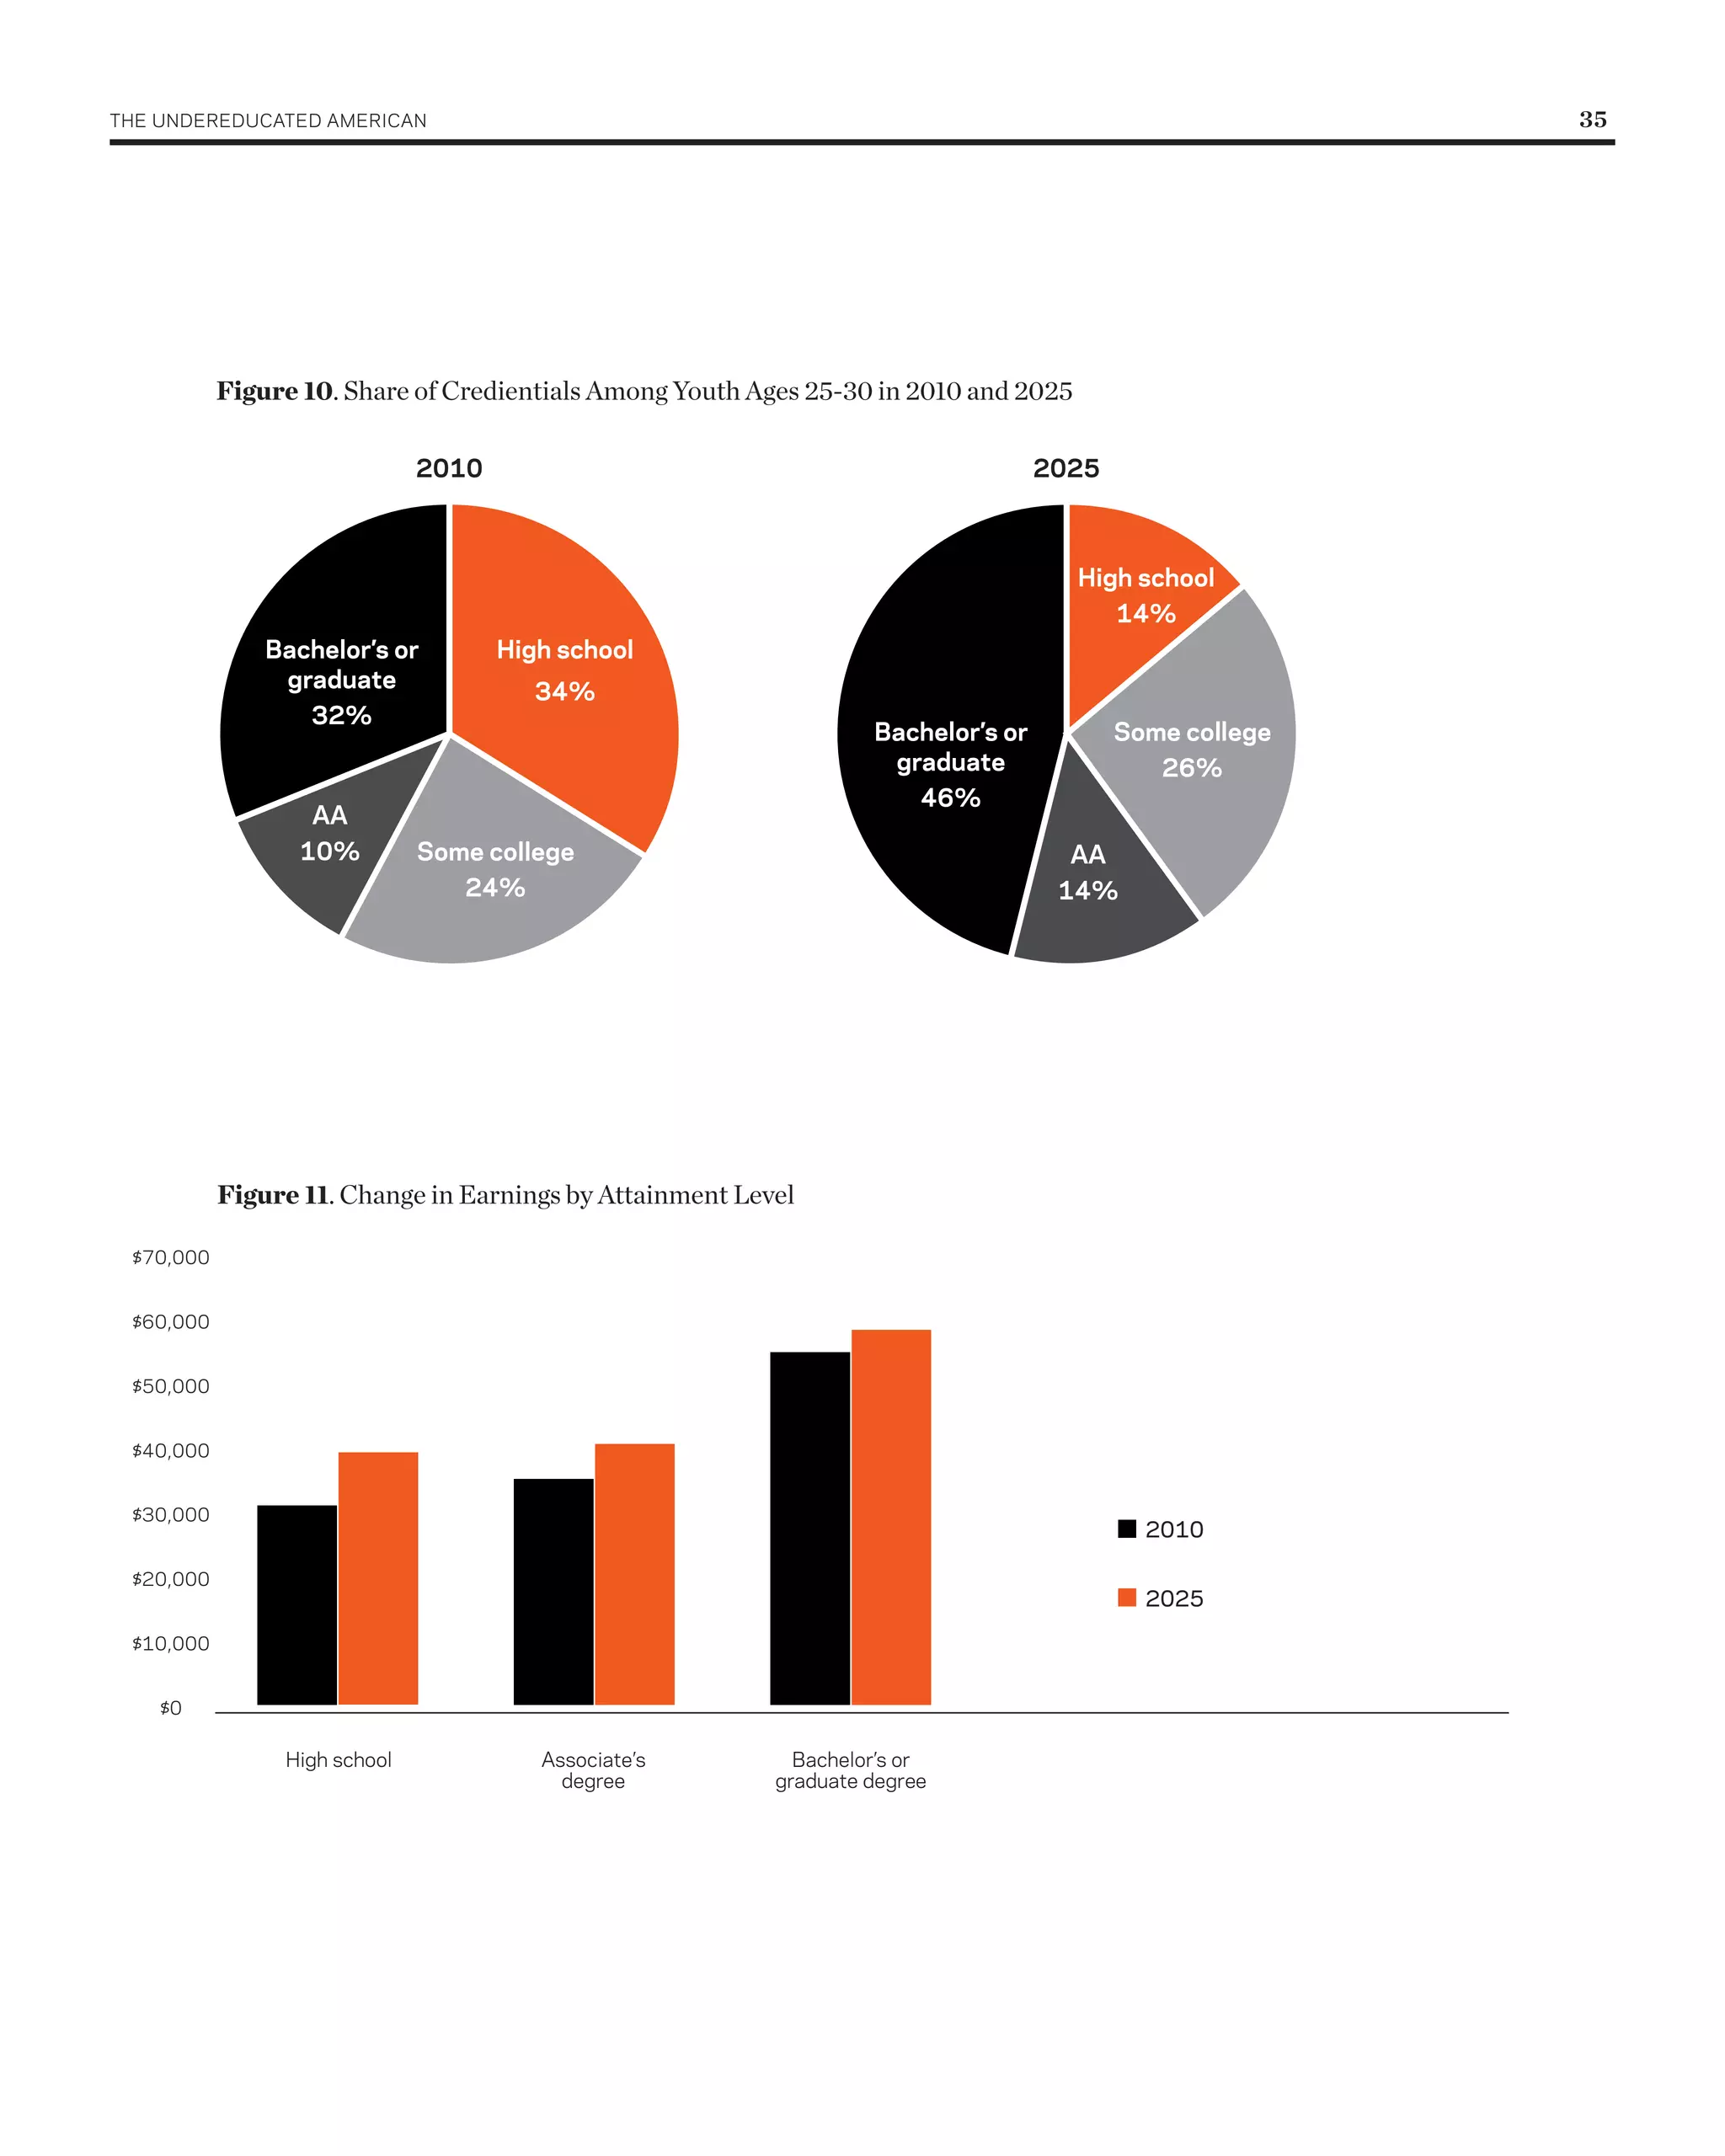
by 2025.21 As Figure 10 shows, the share of Since even without our intervention, the current
young adults with a college degree will also rise trend of increasing college attendance would
to 60 percent—46 percent with a Bachelor’s result in 8 million new college-educated workers,
degree and 14 percent with an Associate’s our preferred path requires producing an
additional 12 million people with postsecondary
We estimate that to meet attendance over 15 years.
the demand for more skilled Finally, if this alternative path is adopted,
workers and to reduce GDP will be $500 billion higher than current
projections and there will be earnings increases
inequality, the number of across the board even though the earnings gaps
young people attending between Bachelor’s degree holders and high
school educated workers will decline. Figure 11
college will need to rise projects the average increase in earnings by
from 66 percent today to education level. Earnings of workers with a
Bachelor’s degree would rise by 6 percent (from
86 percent by 2025. $56,138 to $59,329 [2010 dollars]) and the
21
Appendix 2 traces the year by year changes in BA attainment and the share of young people going from high school to postsecondary. Because not
every college graduate enters or remains in the labor force, adding 15 million additional workers with Bachelor’s degrees to the workforce would actually
require about 18 million additional college graduates.](https://image.slidesharecdn.com/theundereducatedamerican-110709113102-phpapp02/75/The-Undereducated-American-36-2048.jpg)


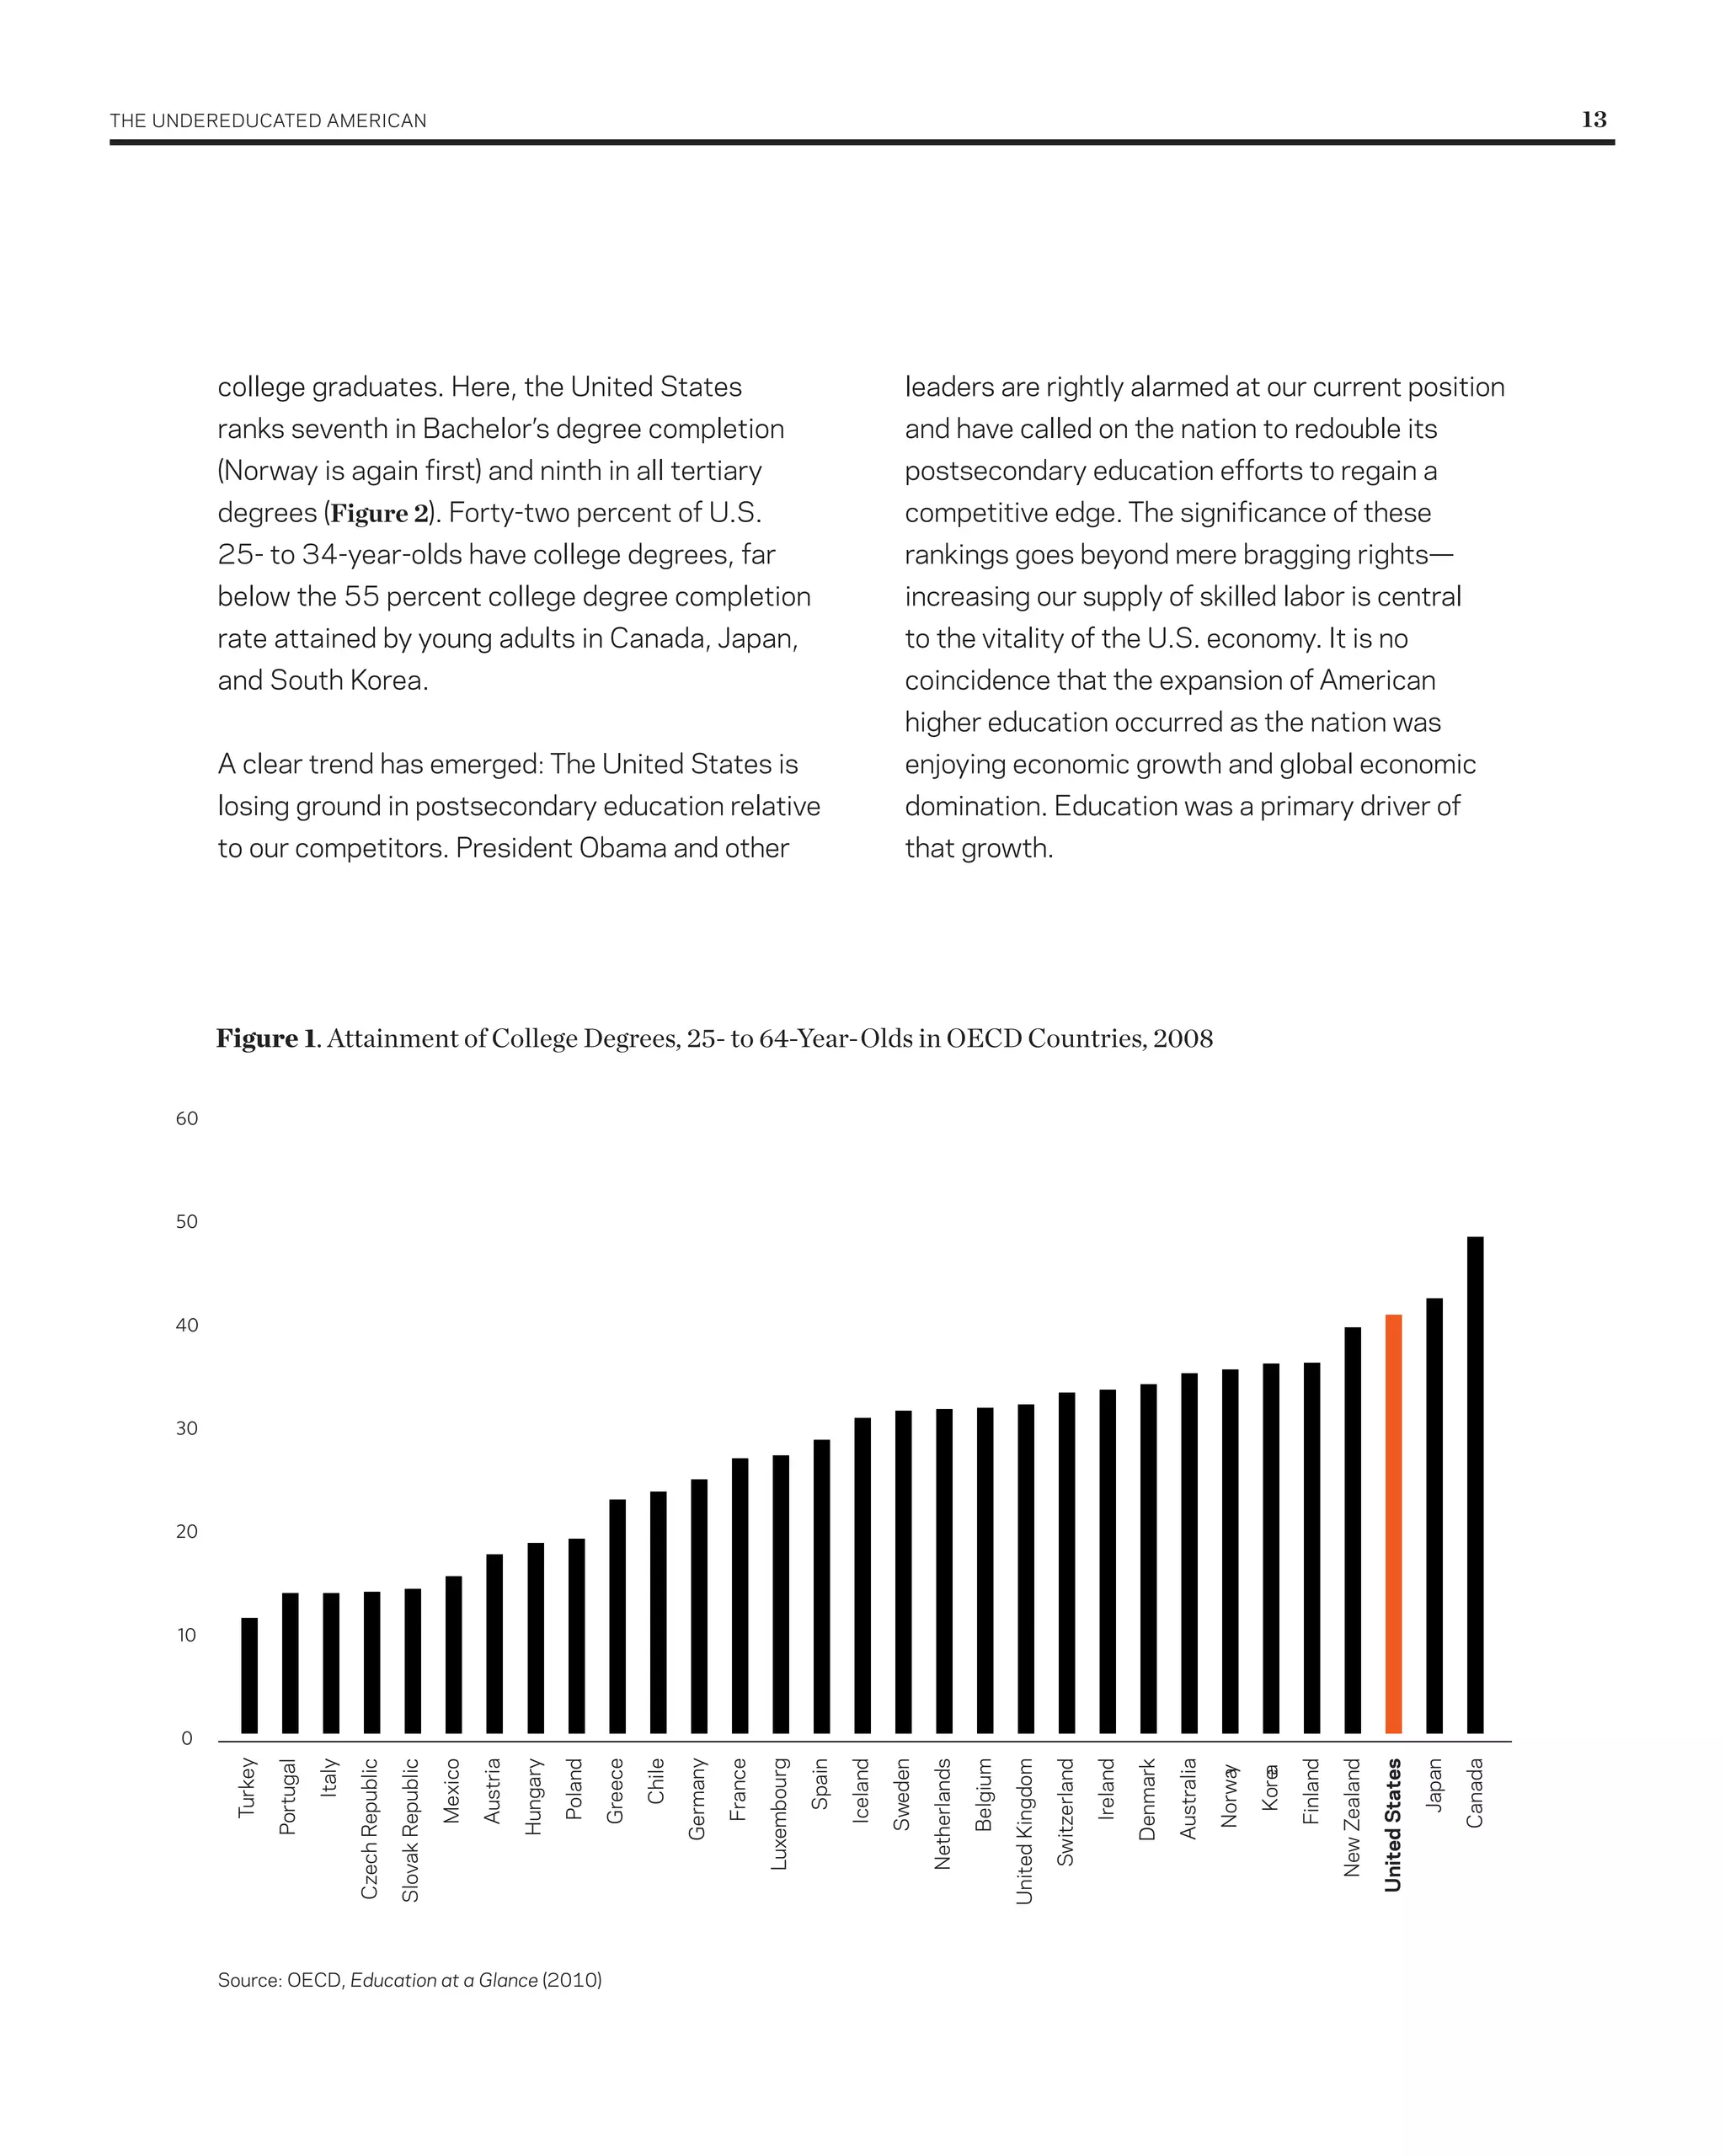
The document discusses how economic growth has become linked with higher educational attainment levels. For many years, the US led the world in college attainment rates but has lost ground relative to other developed countries. Data shows the US now ranks below average among developed countries in the percentage of young adults who have obtained a college degree. Maintaining a skilled workforce with postsecondary education is important for sustaining economic competitiveness and growth.


