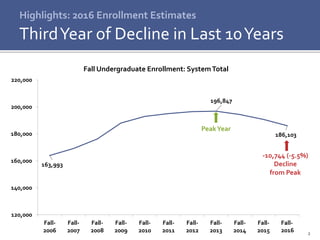
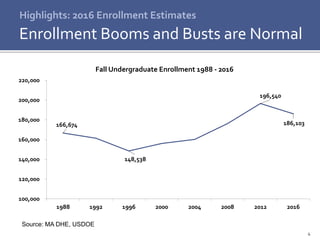
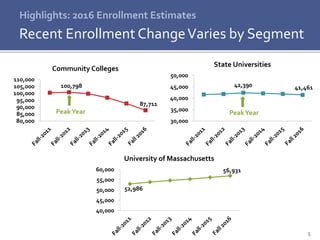
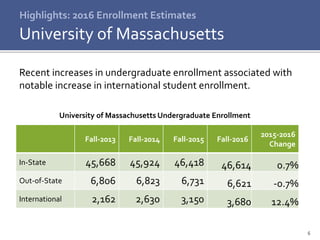
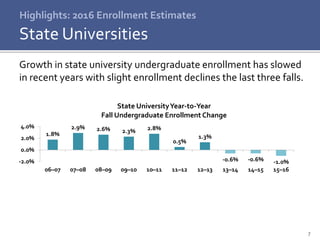
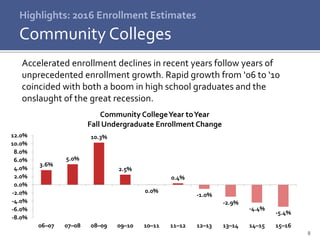
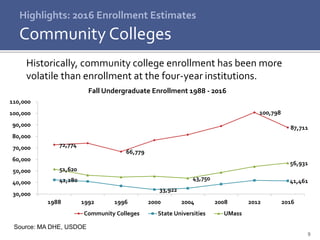
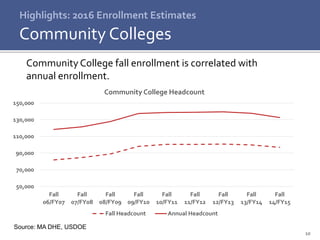
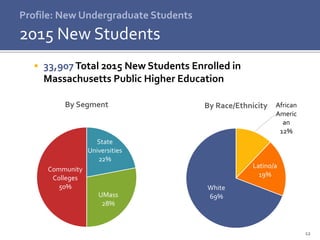
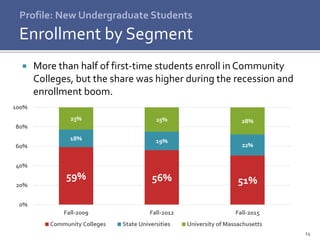
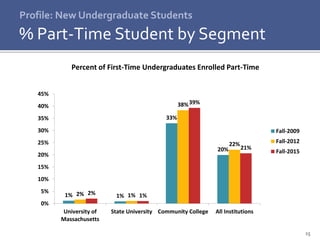
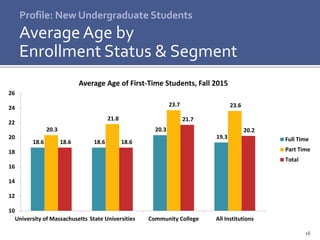
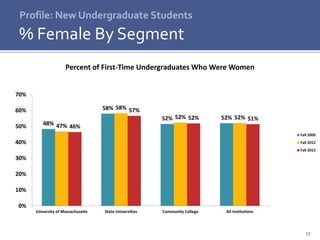
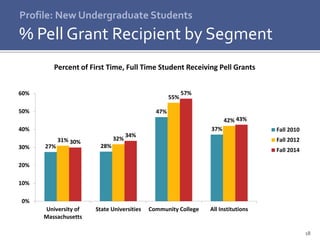
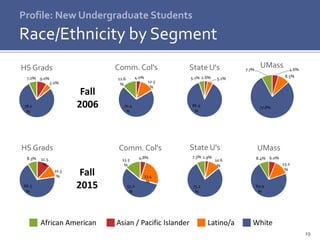
Highlights:
2016 Enrollment Estimates
Board of Higher Education Meeting | October 11, 2016
2
163,993
196,847
186,103
120,000
140,000
160,000
180,000
200,000
220,000
Fall-
2006
Fall-
2007
Fall-
2008
Fall-
2009
Fall-
2010
Fall-
2011
Fall-
2012
Fall-
2013
Fall-
2014
Fall-
2015
Fall Undergraduate Enrollment: SystemTotal
Fall-
2016
Highlights: 2016 Enrollment Estimates
ThirdYear of Decline in Last 10Years
PeakYear
-10,744 (-5.5%)
Decline
from Peak
3
Highlights: 2016 Enrollment Estimates
Consensus Among Multiple Projections
40000
45000
50000
55000
60000
65000
70000
75000
80000
2000 2005 2010 2015 2020 2025
NumberHighSchoolGraduates
100,000
120,000
140,000
160,000
180,000
200,000
220,000
2000 2005 2010 2015 2020 2025
FallHeadcount
Donahue: Public Higher Ed EnrollmentsWICHE: High School Graduates
NCES: 2010-2023 Change in
Public High School Graduates
Decline 5% or more
Decline up to 5%
Grow up to 5%
Grow 5% or more
4
Highlights: 2016 Enrollment Estimates
Enrollment Booms and Busts are Normal
Source: MA DHE, USDOE
166,674
148,538
196,540
186,103
100,000
120,000
140,000
160,000
180,000
200,000
220,000
1988 1992 1996 2000 2004 2008 2012 2016
Fall Undergraduate Enrollment 1988 - 2016
5
42,390 41,461
30,000
35,000
40,000
45,000
50,000
State Universities
100,798
87,711
80,000
85,000
90,000
95,000
100,000
105,000
110,000
Community Colleges
Highlights: 2016 Enrollment Estimates
Recent Enrollment ChangeVaries by Segment
PeakYear
52,986
56,931
40,000
45,000
50,000
55,000
60,000
University of Massachusetts
PeakYear
6
Highlights: 2016 Enrollment Estimates
University of Massachusetts
Recent increases in undergraduate enrollment associated with
notable increase in international student enrollment.
University of Massachusetts Undergraduate Enrollment
Fall-2013 Fall-2014 Fall-2015 Fall-2016
2015-2016
Change
In-State 45,668 45,924 46,418 46,614 0.7%
Out-of-State 6,806 6,823 6,731 6,621 -0.7%
International 2,162 2,630 3,150 3,680 12.4%
7
Highlights: 2016 Enrollment Estimates
State Universities
Growth in state university undergraduate enrollment has slowed
in recent years with slight enrollment declines the last three falls.
1.8%
2.9% 2.6% 2.3% 2.8%
0.5%
1.3%
-0.6% -0.6% -1.0%-2.0%
0.0%
2.0%
4.0%
06–07 07–08 08–09 09–10 10–11 11–12 12–13 13–14 14–15 15–16
State UniversityYear-to-Year
Fall Undergraduate Enrollment Change
8
3.6%
5.0%
10.3%
2.5%
0.0%
0.4%
-1.0%
-2.9%
-4.4%
-5.4%
-8.0%
-6.0%
-4.0%
-2.0%
0.0%
2.0%
4.0%
6.0%
8.0%
10.0%
12.0%
06–07 07–08 08–09 09–10 10–11 11–12 12–13 13–14 14–15 15–16
Community CollegeYear toYear
Fall Undergraduate Enrollment Change
Highlights: 2016 Enrollment Estimates
Community Colleges
Accelerated enrollment declines in recent years follow years of
unprecedented enrollment growth. Rapid growth from ‘06 to ‘10
coincided with both a boom in high school graduates and the
onslaught of the great recession.
9
Highlights: 2016 Enrollment Estimates
Community Colleges
Historically, community college enrollment has been more
volatile than enrollment at the four-year institutions.
Source: MA DHE, USDOE
72,774
66,779
100,798
87,711
42,280
33,922
41,461
51,620
43,750
56,931
30,000
40,000
50,000
60,000
70,000
80,000
90,000
100,000
110,000
1988 1992 1996 2000 2004 2008 2012 2016
Fall Undergraduate Enrollment 1988 - 2016
Community Colleges State Universities UMass
10
Highlights: 2016 Enrollment Estimates
Community Colleges
Community College fall enrollment is correlated with
annual enrollment.
Source: MA DHE, USDOE
50,000
70,000
90,000
110,000
130,000
150,000
Fall
06/FY07
Fall
07/FY08
Fall
08/FY09
Fall
09/FY10
Fall
10/FY11
Fall
11/FY12
Fall
12/FY13
Fall
13/FY14
Fall
14/FY15
Community College Headcount
Fall Headcount Annual Headcount
Profile: New
Undergraduate Students
12
 33,907Total 2015 New Students Enrolled in
Massachusetts Public Higher Education
Profile: New Undergraduate Students
2015 New Students
State
Universities
22%
UMass
28%
Community
Colleges
50%
By Segment African
Americ
an
12%
Latino/a
19%
White
69%
By Race/Ethnicity
13
 Nearly 52% were female
 Average age was 19.9 years
 24.8 years for part-time students
 More than 20% were part-time students
 Approximately 43% of those enrolling full-time
received Pell Grants
Profile: New Undergraduate Students
2015 New Students (cont’d)
14
 More than half of first-time students enroll in Community
Colleges, but the share was higher during the recession and
enrollment boom.
Profile: New Undergraduate Students
Enrollment by Segment
59% 56% 51%
18% 19%
22%
23% 25% 28%
0%
20%
40%
60%
80%
100%
Fall-2009 Fall-2012 Fall-2015
Community Colleges State Universities University of Massachusetts
15
Profile: New Undergraduate Students
% Part-Time Student by Segment
1% 1%
33%
20%
2% 1%
38%
22%
2% 1%
39%
21%
0%
5%
10%
15%
20%
25%
30%
35%
40%
45%
University of
Massachusetts
State University Community College All Institutions
Percent of First-Time Undergraduates Enrolled Part-Time
Fall-2009
Fall-2012
Fall-2015
16
Profile: New Undergraduate Students
Average Age by
Enrollment Status & Segment
18.6 18.6
20.3
19.3
20.3
21.8
23.7 23.6
18.6 18.6
21.7
20.2
10
12
14
16
18
20
22
24
26
University of Massachusetts State Universities Community College All Institutions
Average Age of First-Time Students, Fall 2015
Full Time
Part Time
Total
17
Profile: New Undergraduate Students
% Female By Segment
48%
58%
52% 52%
47%
58%
52% 52%
46%
57%
52% 51%
0%
10%
20%
30%
40%
50%
60%
70%
University of Massachusetts State Universities Community College All Institutions
Percent of First-Time Undergraduates Who Were Women
Fall 2009
Fall 2012
Fall 2015
18
Profile: New Undergraduate Students
% Pell Grant Recipient by Segment
27% 28%
47%
37%
31% 32%
55%
42%
30%
34%
57%
43%
0%
10%
20%
30%
40%
50%
60%
University of
Massachusetts
State Universities Community College All Institutions
Percent of First Time, Full Time Student Receiving Pell Grants
Fall 2010
Fall 2012
Fall 2014
19
Profile: New Undergraduate Students
Race/Ethnicity by Segment
4.6%
8.5%
77.8%
7.7%
UMass
6.0%
13.2
%
69.9
%
8.4%
UMass
2.6% 5.1%
86.9
%
5.1%
State U's
2.9%
10.6
%
75.2
%
7.3%
State U's
4.0%
12.5
%
70.4
%
12.6
%
Comm. Col's
4.8%
23.4
%
55.2
%
13.3
%
Comm. Col's
Fall
2006
Fall
2015
9.0%
5.0%
78.0
%
7.0%
HS Grads
11.5
%
10.3
%
66.3
%
8.3%
HS Grads
African American Asian / Pacific Islander Latino/a White
20
 Latino/a students are less likely thanWhite students to finish
high school and enter college
Profile: New Undergraduate Students
Latino/White Gaps in Attainment
Sources: MA DESE, MA DHE, National StudentClearinghouse.
72%
53%
92%
73%
0%
10%
20%
30%
40%
50%
60%
70%
80%
90%
100%
Graduating High School in Four Years Enrolling in Postsecondary Education After HS Graduation
Gaps in Educational Attainment for MA Public High School Students
Latino White
21
 Latino/a recent HS grads are more likely thanWhite recent
HS grads to enroll in MA Public Higher Education
Profile: New Undergraduate Students
Latino/White College-Going Patterns
Enrolling MA
Public, 72%
Enrolling MA
Public, 45%
Enrolling
Other, 28%
Enrolling
Other, 55%
0%
25%
50%
75%
100%
Latino White
Where Recent High School Graduates Enroll
Discussion

Highlights: 2016 Enrollment Estimates

  • 1.
    Highlights: 2016 Enrollment Estimates Boardof Higher Education Meeting | October 11, 2016
  • 2.
  • 3.
    3 Highlights: 2016 EnrollmentEstimates Consensus Among Multiple Projections 40000 45000 50000 55000 60000 65000 70000 75000 80000 2000 2005 2010 2015 2020 2025 NumberHighSchoolGraduates 100,000 120,000 140,000 160,000 180,000 200,000 220,000 2000 2005 2010 2015 2020 2025 FallHeadcount Donahue: Public Higher Ed EnrollmentsWICHE: High School Graduates NCES: 2010-2023 Change in Public High School Graduates Decline 5% or more Decline up to 5% Grow up to 5% Grow 5% or more
  • 4.
    4 Highlights: 2016 EnrollmentEstimates Enrollment Booms and Busts are Normal Source: MA DHE, USDOE 166,674 148,538 196,540 186,103 100,000 120,000 140,000 160,000 180,000 200,000 220,000 1988 1992 1996 2000 2004 2008 2012 2016 Fall Undergraduate Enrollment 1988 - 2016
  • 5.
    5 42,390 41,461 30,000 35,000 40,000 45,000 50,000 State Universities 100,798 87,711 80,000 85,000 90,000 95,000 100,000 105,000 110,000 CommunityColleges Highlights: 2016 Enrollment Estimates Recent Enrollment ChangeVaries by Segment PeakYear 52,986 56,931 40,000 45,000 50,000 55,000 60,000 University of Massachusetts PeakYear
  • 6.
    6 Highlights: 2016 EnrollmentEstimates University of Massachusetts Recent increases in undergraduate enrollment associated with notable increase in international student enrollment. University of Massachusetts Undergraduate Enrollment Fall-2013 Fall-2014 Fall-2015 Fall-2016 2015-2016 Change In-State 45,668 45,924 46,418 46,614 0.7% Out-of-State 6,806 6,823 6,731 6,621 -0.7% International 2,162 2,630 3,150 3,680 12.4%
  • 7.
    7 Highlights: 2016 EnrollmentEstimates State Universities Growth in state university undergraduate enrollment has slowed in recent years with slight enrollment declines the last three falls. 1.8% 2.9% 2.6% 2.3% 2.8% 0.5% 1.3% -0.6% -0.6% -1.0%-2.0% 0.0% 2.0% 4.0% 06–07 07–08 08–09 09–10 10–11 11–12 12–13 13–14 14–15 15–16 State UniversityYear-to-Year Fall Undergraduate Enrollment Change
  • 8.
    8 3.6% 5.0% 10.3% 2.5% 0.0% 0.4% -1.0% -2.9% -4.4% -5.4% -8.0% -6.0% -4.0% -2.0% 0.0% 2.0% 4.0% 6.0% 8.0% 10.0% 12.0% 06–07 07–08 08–0909–10 10–11 11–12 12–13 13–14 14–15 15–16 Community CollegeYear toYear Fall Undergraduate Enrollment Change Highlights: 2016 Enrollment Estimates Community Colleges Accelerated enrollment declines in recent years follow years of unprecedented enrollment growth. Rapid growth from ‘06 to ‘10 coincided with both a boom in high school graduates and the onslaught of the great recession.
  • 9.
    9 Highlights: 2016 EnrollmentEstimates Community Colleges Historically, community college enrollment has been more volatile than enrollment at the four-year institutions. Source: MA DHE, USDOE 72,774 66,779 100,798 87,711 42,280 33,922 41,461 51,620 43,750 56,931 30,000 40,000 50,000 60,000 70,000 80,000 90,000 100,000 110,000 1988 1992 1996 2000 2004 2008 2012 2016 Fall Undergraduate Enrollment 1988 - 2016 Community Colleges State Universities UMass
  • 10.
    10 Highlights: 2016 EnrollmentEstimates Community Colleges Community College fall enrollment is correlated with annual enrollment. Source: MA DHE, USDOE 50,000 70,000 90,000 110,000 130,000 150,000 Fall 06/FY07 Fall 07/FY08 Fall 08/FY09 Fall 09/FY10 Fall 10/FY11 Fall 11/FY12 Fall 12/FY13 Fall 13/FY14 Fall 14/FY15 Community College Headcount Fall Headcount Annual Headcount
  • 11.
  • 12.
    12  33,907Total 2015New Students Enrolled in Massachusetts Public Higher Education Profile: New Undergraduate Students 2015 New Students State Universities 22% UMass 28% Community Colleges 50% By Segment African Americ an 12% Latino/a 19% White 69% By Race/Ethnicity
  • 13.
    13  Nearly 52%were female  Average age was 19.9 years  24.8 years for part-time students  More than 20% were part-time students  Approximately 43% of those enrolling full-time received Pell Grants Profile: New Undergraduate Students 2015 New Students (cont’d)
  • 14.
    14  More thanhalf of first-time students enroll in Community Colleges, but the share was higher during the recession and enrollment boom. Profile: New Undergraduate Students Enrollment by Segment 59% 56% 51% 18% 19% 22% 23% 25% 28% 0% 20% 40% 60% 80% 100% Fall-2009 Fall-2012 Fall-2015 Community Colleges State Universities University of Massachusetts
  • 15.
    15 Profile: New UndergraduateStudents % Part-Time Student by Segment 1% 1% 33% 20% 2% 1% 38% 22% 2% 1% 39% 21% 0% 5% 10% 15% 20% 25% 30% 35% 40% 45% University of Massachusetts State University Community College All Institutions Percent of First-Time Undergraduates Enrolled Part-Time Fall-2009 Fall-2012 Fall-2015
  • 16.
    16 Profile: New UndergraduateStudents Average Age by Enrollment Status & Segment 18.6 18.6 20.3 19.3 20.3 21.8 23.7 23.6 18.6 18.6 21.7 20.2 10 12 14 16 18 20 22 24 26 University of Massachusetts State Universities Community College All Institutions Average Age of First-Time Students, Fall 2015 Full Time Part Time Total
  • 17.
    17 Profile: New UndergraduateStudents % Female By Segment 48% 58% 52% 52% 47% 58% 52% 52% 46% 57% 52% 51% 0% 10% 20% 30% 40% 50% 60% 70% University of Massachusetts State Universities Community College All Institutions Percent of First-Time Undergraduates Who Were Women Fall 2009 Fall 2012 Fall 2015
  • 18.
    18 Profile: New UndergraduateStudents % Pell Grant Recipient by Segment 27% 28% 47% 37% 31% 32% 55% 42% 30% 34% 57% 43% 0% 10% 20% 30% 40% 50% 60% University of Massachusetts State Universities Community College All Institutions Percent of First Time, Full Time Student Receiving Pell Grants Fall 2010 Fall 2012 Fall 2014
  • 19.
    19 Profile: New UndergraduateStudents Race/Ethnicity by Segment 4.6% 8.5% 77.8% 7.7% UMass 6.0% 13.2 % 69.9 % 8.4% UMass 2.6% 5.1% 86.9 % 5.1% State U's 2.9% 10.6 % 75.2 % 7.3% State U's 4.0% 12.5 % 70.4 % 12.6 % Comm. Col's 4.8% 23.4 % 55.2 % 13.3 % Comm. Col's Fall 2006 Fall 2015 9.0% 5.0% 78.0 % 7.0% HS Grads 11.5 % 10.3 % 66.3 % 8.3% HS Grads African American Asian / Pacific Islander Latino/a White
  • 20.
    20  Latino/a studentsare less likely thanWhite students to finish high school and enter college Profile: New Undergraduate Students Latino/White Gaps in Attainment Sources: MA DESE, MA DHE, National StudentClearinghouse. 72% 53% 92% 73% 0% 10% 20% 30% 40% 50% 60% 70% 80% 90% 100% Graduating High School in Four Years Enrolling in Postsecondary Education After HS Graduation Gaps in Educational Attainment for MA Public High School Students Latino White
  • 21.
    21  Latino/a recentHS grads are more likely thanWhite recent HS grads to enroll in MA Public Higher Education Profile: New Undergraduate Students Latino/White College-Going Patterns Enrolling MA Public, 72% Enrolling MA Public, 45% Enrolling Other, 28% Enrolling Other, 55% 0% 25% 50% 75% 100% Latino White Where Recent High School Graduates Enroll
  • 22.