Download as PDF, PPTX
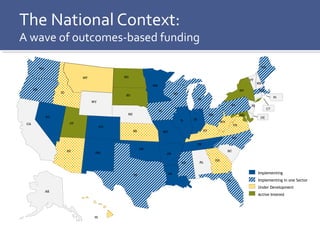
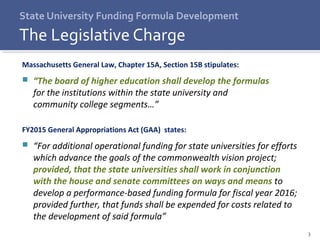
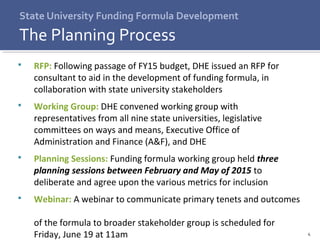
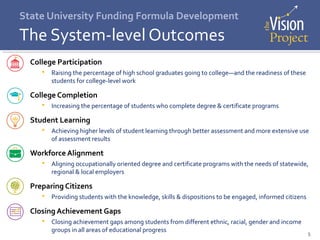
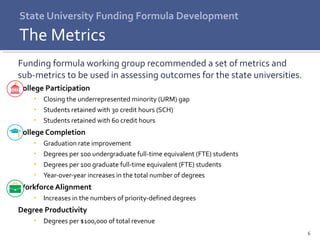
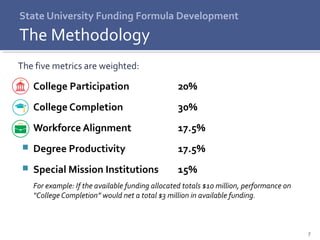
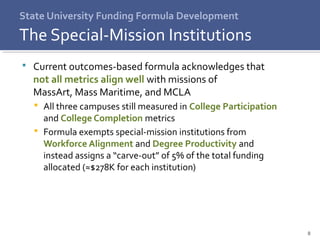
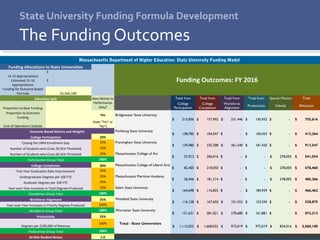
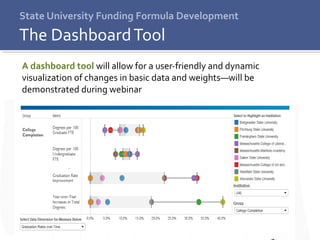
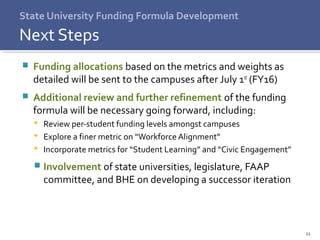


The document outlines the development of a performance-based funding formula for state universities in Massachusetts, as mandated by legislature and the Board of Higher Education. A working group has been established to determine various metrics that will measure outcomes such as college participation, completion, and workforce alignment. The funding formula will allocate resources based on performance against these metrics, with planned implementations and further refinements to be discussed in upcoming sessions.


