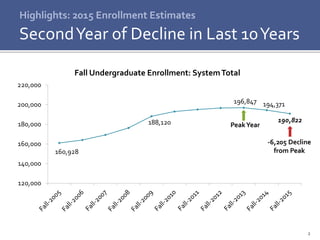
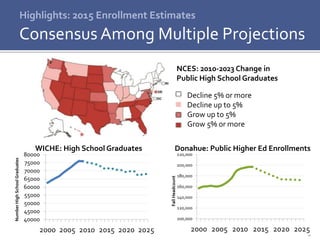
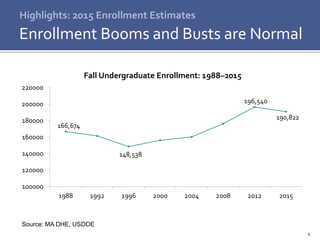
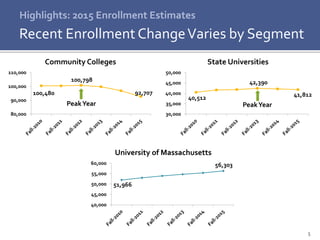
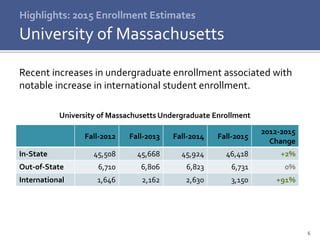
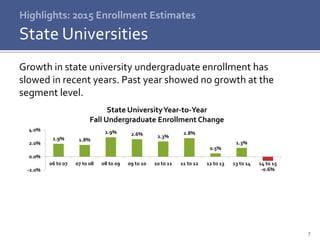
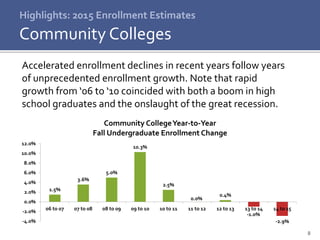
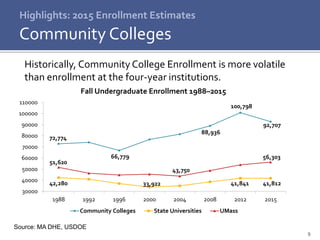
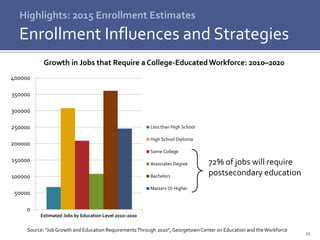
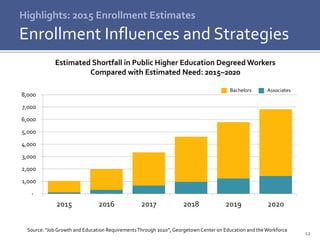
Highlights:
2015 Enrollment Estimates
Board of Higher Education Meeting | October 27, 2015
2
160,928
188,120
196,847 194,371
190,822
120,000
140,000
160,000
180,000
200,000
220,000
Fall Undergraduate Enrollment: SystemTotal
Highlights: 2015 Enrollment Estimates
SecondYear of Decline in Last 10Years
PeakYear
-6,205 Decline
from Peak
3
Highlights: 2015 Enrollment Estimates
Consensus Among Multiple Projections
40000
45000
50000
55000
60000
65000
70000
75000
80000
2000 2005 2010 2015 2020 2025
NumberHighSchoolGraduates
100,000
120,000
140,000
160,000
180,000
200,000
220,000
2000 2005 2010 2015 2020 2025
FallHeadcount
Donahue: Public Higher Ed EnrollmentsWICHE: High School Graduates
NCES: 2010-2023 Change in
Public High School Graduates
Decline 5% or more
Decline up to 5%
Grow up to 5%
Grow 5% or more
4
Highlights: 2015 Enrollment Estimates
Enrollment Booms and Busts are Normal
166,674
148,538
196,540
190,822
100000
120000
140000
160000
180000
200000
220000
1988 1992 1996 2000 2004 2008 2012 2015
Fall Undergraduate Enrollment: 1988–2015
Source: MA DHE, USDOE
5
Highlights: 2015 Enrollment Estimates
Recent Enrollment ChangeVaries by Segment
51,966
56,303
40,000
45,000
50,000
55,000
60,000
University of Massachusetts
40,512
42,390
41,812
30,000
35,000
40,000
45,000
50,000
State Universities
PeakYear
100,480
100,798
92,707
80,000
90,000
100,000
110,000
Community Colleges
PeakYear
6
Highlights: 2015 Enrollment Estimates
University of Massachusetts
Recent increases in undergraduate enrollment associated with
notable increase in international student enrollment.
Fall-2012 Fall-2013 Fall-2014 Fall-2015
2012-2015
Change
In-State 45,508 45,668 45,924 46,418 +2%
Out-of-State 6,710 6,806 6,823 6,731 0%
International 1,646 2,162 2,630 3,150 +91%
University of Massachusetts Undergraduate Enrollment
7
Highlights: 2015 Enrollment Estimates
State Universities
Growth in state university undergraduate enrollment has
slowed in recent years. Past year showed no growth at the
segment level.
1.9% 1.8%
2.9% 2.6% 2.3%
2.8%
0.5%
1.3%
-0.6%-2.0%
0.0%
2.0%
4.0%
06 to 07 07 to 08 08 to 09 09 to 10 10 to 11 11 to 12 12 to 13 13 to 14 14 to 15
State UniversityYear-to-Year
Fall Undergraduate Enrollment Change
8
Highlights: 2015 Enrollment Estimates
Community Colleges
Accelerated enrollment declines in recent years follow years
of unprecedented enrollment growth. Note that rapid
growth from ‘06 to ‘10 coincided with both a boom in high
school graduates and the onslaught of the great recession.
1.5%
3.6%
5.0%
10.3%
2.5%
0.0%
0.4%
-1.0%
-4.3%-4.0%
-2.0%
0.0%
2.0%
4.0%
6.0%
8.0%
10.0%
12.0%
06 to 07 07 to 08 08 to 09 09 to 10 10 to 11 11 to 12 12 to 13 13 to 14 14 to 15
Community CollegeYear-to-Year
Fall Undergraduate Enrollment Change
9
Highlights: 2015 Enrollment Estimates
Community Colleges
Historically, Community College Enrollment is more volatile
than enrollment at the four-year institutions.
72,774
66,779
88,936
100,798
92,707
42,280 33,922 41,841 41,812
51,620
43,750
56,303
30000
40000
50000
60000
70000
80000
90000
100000
110000
1988 1992 1996 2000 2004 2008 2012 2015
Fall Undergraduate Enrollment 1988–2015
Community Colleges State Universities UMass
Source: MA DHE, USDOE
10
What factors necessitate the need for increased enrollment?
 “The Perfect Storm”
 Growth in jobs that require a college-educated workforce
 Declines in college-age population
 Persistent low college completion rates
 Persistent gaps in college enrollment and completion among
growing underserved populations.
 Public Higher Education in Massachusetts has been
grappling with relatively flat student outcomes at a
time in which the demand for college degrees is
perpetually increasing.
Highlights: 2015 Enrollment Estimates
Enrollment Influences and Strategies
11
Highlights: 2015 Enrollment Estimates
Enrollment Influences and Strategies
72% of jobs will require
postsecondary education
Growth in Jobs that Require a College-EducatedWorkforce: 2010–2020
Source: “Job Growth and Education RequirementsThrough 2020”, GeorgetownCenter on Education and theWorkforce
0
50000
100000
150000
200000
250000
300000
350000
400000
Estimated Jobs by Education Level 2010–2020
Less than High School
High School Diploma
Some College
Associates Degree
Bachelors
Masters Or Higher
12
Highlights: 2015 Enrollment Estimates
Enrollment Influences and Strategies
-
1,000
2,000
3,000
4,000
5,000
6,000
7,000
8,000
2015 2016 2017 2018 2019 2020
Bachelors Associates
Estimated Shortfall in Public Higher Education Degreed Workers
Compared with Estimated Need: 2015–2020
Source: “Job Growth and Education RequirementsThrough 2020”, GeorgetownCenter on Education and theWorkforce
13
 Implementation of new
system-wide policies
and practices can change
the trajectory.
 However, there needs to be
a continuous PK–16 effort
to advance educational
attainment if we are to
adequately meet the
requirements of the
Commonwealth’s economy.
Highlights: 2015 Enrollment Estimates
Strategies to Address Declines
“The BigThree”
Discussion

Highlights: 2015 Fall Enrollment Estimates

  • 1.
    Highlights: 2015 Enrollment Estimates Boardof Higher Education Meeting | October 27, 2015
  • 2.
    2 160,928 188,120 196,847 194,371 190,822 120,000 140,000 160,000 180,000 200,000 220,000 Fall UndergraduateEnrollment: SystemTotal Highlights: 2015 Enrollment Estimates SecondYear of Decline in Last 10Years PeakYear -6,205 Decline from Peak
  • 3.
    3 Highlights: 2015 EnrollmentEstimates Consensus Among Multiple Projections 40000 45000 50000 55000 60000 65000 70000 75000 80000 2000 2005 2010 2015 2020 2025 NumberHighSchoolGraduates 100,000 120,000 140,000 160,000 180,000 200,000 220,000 2000 2005 2010 2015 2020 2025 FallHeadcount Donahue: Public Higher Ed EnrollmentsWICHE: High School Graduates NCES: 2010-2023 Change in Public High School Graduates Decline 5% or more Decline up to 5% Grow up to 5% Grow 5% or more
  • 4.
    4 Highlights: 2015 EnrollmentEstimates Enrollment Booms and Busts are Normal 166,674 148,538 196,540 190,822 100000 120000 140000 160000 180000 200000 220000 1988 1992 1996 2000 2004 2008 2012 2015 Fall Undergraduate Enrollment: 1988–2015 Source: MA DHE, USDOE
  • 5.
    5 Highlights: 2015 EnrollmentEstimates Recent Enrollment ChangeVaries by Segment 51,966 56,303 40,000 45,000 50,000 55,000 60,000 University of Massachusetts 40,512 42,390 41,812 30,000 35,000 40,000 45,000 50,000 State Universities PeakYear 100,480 100,798 92,707 80,000 90,000 100,000 110,000 Community Colleges PeakYear
  • 6.
    6 Highlights: 2015 EnrollmentEstimates University of Massachusetts Recent increases in undergraduate enrollment associated with notable increase in international student enrollment. Fall-2012 Fall-2013 Fall-2014 Fall-2015 2012-2015 Change In-State 45,508 45,668 45,924 46,418 +2% Out-of-State 6,710 6,806 6,823 6,731 0% International 1,646 2,162 2,630 3,150 +91% University of Massachusetts Undergraduate Enrollment
  • 7.
    7 Highlights: 2015 EnrollmentEstimates State Universities Growth in state university undergraduate enrollment has slowed in recent years. Past year showed no growth at the segment level. 1.9% 1.8% 2.9% 2.6% 2.3% 2.8% 0.5% 1.3% -0.6%-2.0% 0.0% 2.0% 4.0% 06 to 07 07 to 08 08 to 09 09 to 10 10 to 11 11 to 12 12 to 13 13 to 14 14 to 15 State UniversityYear-to-Year Fall Undergraduate Enrollment Change
  • 8.
    8 Highlights: 2015 EnrollmentEstimates Community Colleges Accelerated enrollment declines in recent years follow years of unprecedented enrollment growth. Note that rapid growth from ‘06 to ‘10 coincided with both a boom in high school graduates and the onslaught of the great recession. 1.5% 3.6% 5.0% 10.3% 2.5% 0.0% 0.4% -1.0% -4.3%-4.0% -2.0% 0.0% 2.0% 4.0% 6.0% 8.0% 10.0% 12.0% 06 to 07 07 to 08 08 to 09 09 to 10 10 to 11 11 to 12 12 to 13 13 to 14 14 to 15 Community CollegeYear-to-Year Fall Undergraduate Enrollment Change
  • 9.
    9 Highlights: 2015 EnrollmentEstimates Community Colleges Historically, Community College Enrollment is more volatile than enrollment at the four-year institutions. 72,774 66,779 88,936 100,798 92,707 42,280 33,922 41,841 41,812 51,620 43,750 56,303 30000 40000 50000 60000 70000 80000 90000 100000 110000 1988 1992 1996 2000 2004 2008 2012 2015 Fall Undergraduate Enrollment 1988–2015 Community Colleges State Universities UMass Source: MA DHE, USDOE
  • 10.
    10 What factors necessitatethe need for increased enrollment?  “The Perfect Storm”  Growth in jobs that require a college-educated workforce  Declines in college-age population  Persistent low college completion rates  Persistent gaps in college enrollment and completion among growing underserved populations.  Public Higher Education in Massachusetts has been grappling with relatively flat student outcomes at a time in which the demand for college degrees is perpetually increasing. Highlights: 2015 Enrollment Estimates Enrollment Influences and Strategies
  • 11.
    11 Highlights: 2015 EnrollmentEstimates Enrollment Influences and Strategies 72% of jobs will require postsecondary education Growth in Jobs that Require a College-EducatedWorkforce: 2010–2020 Source: “Job Growth and Education RequirementsThrough 2020”, GeorgetownCenter on Education and theWorkforce 0 50000 100000 150000 200000 250000 300000 350000 400000 Estimated Jobs by Education Level 2010–2020 Less than High School High School Diploma Some College Associates Degree Bachelors Masters Or Higher
  • 12.
    12 Highlights: 2015 EnrollmentEstimates Enrollment Influences and Strategies - 1,000 2,000 3,000 4,000 5,000 6,000 7,000 8,000 2015 2016 2017 2018 2019 2020 Bachelors Associates Estimated Shortfall in Public Higher Education Degreed Workers Compared with Estimated Need: 2015–2020 Source: “Job Growth and Education RequirementsThrough 2020”, GeorgetownCenter on Education and theWorkforce
  • 13.
    13  Implementation ofnew system-wide policies and practices can change the trajectory.  However, there needs to be a continuous PK–16 effort to advance educational attainment if we are to adequately meet the requirements of the Commonwealth’s economy. Highlights: 2015 Enrollment Estimates Strategies to Address Declines “The BigThree”
  • 14.