This document provides definitions and outlines the effects of grain and particle parameters on ceramic and ceramic composite properties. It defines grains as the primary microstructural units in polycrystalline materials, while particles refer more broadly to discrete solid entities that may be crystalline, noncrystalline, or a combination. Key parameters of grains and particles include their composition, amount, size, shape, orientation, and spatial distribution, which largely determine material properties. The document focuses on the effects of grain and particle size but also discusses how shape and orientation can impact properties. It outlines measuring these parameters and how their interactions sometimes complicate analysis of structure-property relationships in ceramics.

![Grain and Particle Effects on Ceramic Properties 3
again more complex bodies can occur). The matrix and the dispersed particles
can both be crystalline, or one can be amorphous, but usually not both (unless
they are immiscible, which again leads to microstructures not totally described
by the above concepts of grains and particles). In the case of a crystalline matrix
its grain parameters are still often important in the behavior of the composite
along with the particle parameters discussed below. An amorphous matrix de-
rived by sintering may retain some of the original particle character of its pow-
der origin, most commonly when the particles are delineated by substantial
residual porosity. Thus the ideal or classical composite consists of a continuous
amorphous single-crystal, or polycrystalline matrix with a disperion of solid
particles of a distinct second phase, usually mainly or exclusively of single-
crystal or polycrystalline character.
The above ideal microstructures can be broadened to encompass many
other bodies of interest via two modifications. The first is to include some poros-
ity of either intergranular or intragranular locations, and often varying combina-
tions of both, e.g. depending on grain size. (Porosity can be considered a
[nonsolid] second phase. Modeling its effects by using composite models in
which properties of the “pore phase” are set to zero is commonly used, but this
approach, while often used, can also be very misleading [1].) Note that while
real microstructures often have some porosity, which typically plays a role, often
an important one in physical properties, their effects are treated extensively else-
where [1]. In this book the focus is on microstructural effects with no or limited
porosity, the latter commonly corrected for the effects of the porosity [1]. The
second and broader modification is the introduction of a solid phase in addition
to, or with no, pore phase in one or more of the following fashions: (1) along
part, much, or all of the matrix grain, particle–matrix, or both boundaries or (2)
within the grains, particles, or both, e.g. from some phase separation process
such as precipitation.
Finally, a note on ceramic composites, which were originally the result of
empirically derived bodies based on processing natural raw materials, with com-
positions based on the raw materials and processing available and the resultant
behavior. Porcelains and whitewares, which are important examples of compos-
ites of silicate glasses and oxide crystalline phases still in broad use today, are
treated to some extent in this book. Another related, more recent and often com-
plex family of ceramic composites are those derived by controlled crystallization
of glasses of compositions selected for their processing-property opportunities.
These are also treated to some extent in this book. In more recent years, many
composites of designed character, primarily of a crystalline matrix with signifi-
cant dispersions of primarily single crystal particles, have become of interest.
These composites of either or both oxide or nonoxide phases are more exten-
sively covered in this book following evaluation of the grain dependence of
properties of nominally single-phase, i.e. monolithic, ceramics.](https://image.slidesharecdn.com/mechanical-properties-of-ceramics-and-composites-120303143122-phpapp01/85/Mechanical-properties-of-ceramics-and-composites-4-320.jpg)
![Grain and Particle Effects on Ceramic Properties 5
typical two-dimensional measurement to a three-dimensional shape requires as-
sumptions about the grain or particle shape.
Grain or particle shapes may also significantly affect their orientation, both
locally and globally in the bodies in which they occur; both again in turn affect
size measurements and body properties. Property effects occur most extensively
when grain or particle shapes reflect aspects of the crystallographic character,
which is common. In such cases, global orientation of such shaped grains or par-
ticles imparts a corresponding degree of anisotropy of properties in proportion to
the crystalline anisotropy and the degree and volume fraction of orientated
grains or particles. This encompasses all properties of noncubic materials, as
well as various properties of cubic materials such as elastic moduli, fracture (i.e.
cleavage, fracture energy, and toughness), and strengths, since cubic materials,
while being isotropic in some properties such as dielectric constant and thermal
expansion, are generally anisotropic in other properties such as those noted. Lo-
cal grain or particle orientation effects can impact properties via effects on local
crack generation (i.e. microcracking), propagation, or both. It can also result in
grain clusters, i.e. colonies, that act collectively as a larger grain or particle, as
discussed below and later.
Composites where the particles are single crystals, i.e. like grains in a
polycrystalline matrix, are most common and most extensively treated in this
book, including those where the dispersed particles are of more extreme mor-
phological shapes, i.e. platelets or whiskers. When such latter composites are
discussed, they will typically be specifically identified as platelet or whisker
composites, and composites with more equiaxed particles will be referred to as
particulate composites. However, the term particle or particulate composite
will sometimes be used in the genetic sense irrespective of particle shape/mor-
phology. Grain or particle orientation refers to the spatial orientation of either
their physical shape or especially of their crystal structure, which are com-
monly related.
Measurement adequately to reflect size, shape, and orientation and their in-
terrelation and spatial distributions is a large, imperfectly met challenge that is
often inadequately considered. Thus the location, shape, and orientation, and
sometimes the size, of pores are often related to grain, and especially particle,
shape and orientation. For example, pores in platelet composites commonly re-
main at the platelet–matrix interface [2], and such pores often are larger and typ-
ically somewhat platelet in shape. Similar effects have been indicated in fiber
composites (Chap. 8, Sec. III.E, Ref. 1) and are likely in whisker composites.
Particle, and especially grain, growth can be significantly enhanced by impuri-
ties, with resultant larger grains or particles being equiaxed or often tabular or
acicular in shape. Some of these effects are illustrated in the next section, and
later in the book. Resulting effects are further frequently complicated by the
need to define and address their correlation with other microstructural factors](https://image.slidesharecdn.com/mechanical-properties-of-ceramics-and-composites-120303143122-phpapp01/85/Mechanical-properties-of-ceramics-and-composites-6-320.jpg)
![6 Chapter 1
such as other phases or pores, e.g. grain boundary or interfacial ones. Issues of
such measurements and effects are discussed further in this chapter and else-
where in this book.
The grain and particle parameter addressed most extensively is their size,
which is generally of greatest importance and is widely addressed in the litera-
ture. However, the shape and orientation parameters, as well as the statistical and
spatial distributions of these parameters and of sizes of grains and particles, are
also treated to the extent feasible, since these parameters can also be important.
Though interaction and distributions of these parameters are often neglected,
causing considerable variation in the literature, they often play a role in deter-
mining many important physical properties of ceramic composites and mono-
lithic ceramics.
II. RELATIVE EFFECTS AND INTERACTIONS OF
MICROSTRUCTURAL PARAMETERS ON PROPERTIES
In focusing on grain and particle parameters it is important first to recognize the
relative roles and interactions of microstructural features on ceramic properties,
especially porosity, which is a dominant factor, as recently comprehensively re-
viewed [1]. In making ceramic (and other) bodies, processes used can result in
either substantial or limited porosity, depending on both the fabrication process
and the parameters selected. While a variety of factors impact the choice of fab-
rication method, e.g. the size, shape, and cost of components to be made, the
amount and character of the porosity sought or tolerated in the component is also
an important factor. Often, one is dealing with either of two, extreme, cases. In
one case a desired, ideally a designed, pore structure is sought for favorable at-
tributes needed from the amount and character of the porosity balanced against
limitations of other pertinent properties such as stiffness, strength, conductivity,
etc. imposed by the porosity. In the other case one seeks to minimize porosity to
approach, or achieve, high levels of properties limited by porosity as a function
of cost and performance. In polycrystalline materials grain parameters, and for
composites particle parameters, play important, often similar, roles in many
properties, depending on porosity content.
Typically the most significant role of grain and particle parameters on
properties occurs where low porosity is sought for high levels of properties.
This arises because some key ceramic properties, such as strength and fracture,
hardness, wear, and erosion behavior, are significantly impacted by grain and
particle parameters, of which size is often most important. Thus in order to
achieve high levels of important properties in a selected material, porosity
must first be minimized, since this commonly reduces properties substantially,
e.g. by 1 to 2 orders of magnitude at intermediate and higher porosities. How-
ever, beyond increases from reduced porosity, some important properties can](https://image.slidesharecdn.com/mechanical-properties-of-ceramics-and-composites-120303143122-phpapp01/85/Mechanical-properties-of-ceramics-and-composites-7-320.jpg)
![Grain and Particle Effects on Ceramic Properties 7
be further increased, e.g. by 50 to a few hundred percent, by obtaining desired
grain or particle sizes, often as small as feasible. Achieving this entails trade-
offs in terms of amounts and character of residual porosity, since at lower lev-
els of porosity, further heating to reduce porosity commonly leads to grain
growth and attendant sweeping of grain boundaries past previously intergranu-
lar pores. Resultant intragranular pores are often less detrimental to properties,
and may even possibly counter some reductions of properties due to grain
growth. While this approach of accepting some residual, especially intragranu-
lar, porosity is ultimately limiting in properties, it is often a factor in produc-
tion of bulk ceramics. At the other extreme of product size, i.e. production of
ceramic fibers, achieving very fine grains (typically << 1 µm) with ∼ 0%
porosity is essential to achieving strengths up to an order of magnitude higher
than in bulk bodies. Achieving such benefits of fine grain sizes with ∼ 0%
porosity in bulk bodies has also been sought. However, this can entail serious
problems of residual impurities in some materials, particularly in attempting to
achieve nano-scale grain or particle sizes for effects expected from extapola-
tions of conventional grain or particle size dependences, or for possible novel
behavior at such fine grain or particle sizes. Such problems, which have not
been addressed in the nanomaterial literature, are addressed in this book.
In cases where porosity is needed for functions, grain and particle parame-
ters often still play a role in determining properties, but such effects are usually
secondary to those of the pore structure and are typically at fine grain and parti-
cle sizes. Obtaining such fine sizes often entails retaining substantial porosity
due to low processing temperatures used to limit grain or particle growth, and in
the common case of sintering, starting with fine particles. However, since some
growth of grains, particles, or both occurs, often inversely to the level of poros-
ity, grain size effects must also be considered, especially as porosity decreases,
as is extensively addressed elsewhere [1].
A qualitative overview of the relative impacts of pores, grains, and parti-
cles on various properties, mainly at moderate temperatures (the primary focus
of this book), is summarized in Table 1.1, by indicating whether these features
have a primary (P) or a secondary (S) effect on that property. Primary effects are
intrinsic to the presence of the pore, grain, or particle structure in the body, but
vary with compositions and their amounts, sizes, shapes, and orientations. Sec-
ondary effects, which can occur alone or in addition to primary effects arise from
combinations of composition, size, shape, and orientation via local and espe-
cially global grain (or particle) orientation and hence anisotropy or microcrack-
ing, the latter occurring only above a critical grain or particle size for a given
body composition. While many primary effects are very substantial, e.g. most
porosity effects, and many secondary effects are of lesser impact, this is not al-
ways so. Thus while particles in a composite have intrinsic effects on all proper-
ties shown, these are often modest, since particle property impacts typically](https://image.slidesharecdn.com/mechanical-properties-of-ceramics-and-composites-120303143122-phpapp01/85/Mechanical-properties-of-ceramics-and-composites-8-320.jpg)


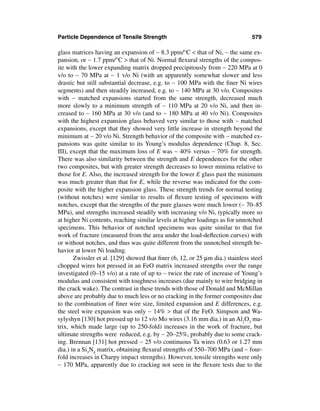
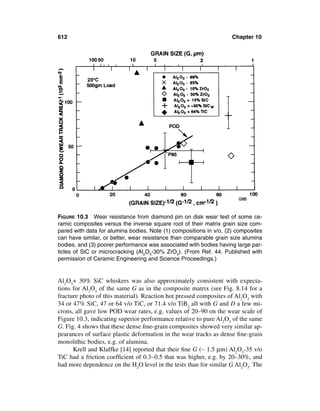
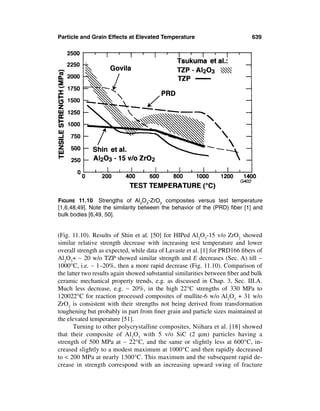
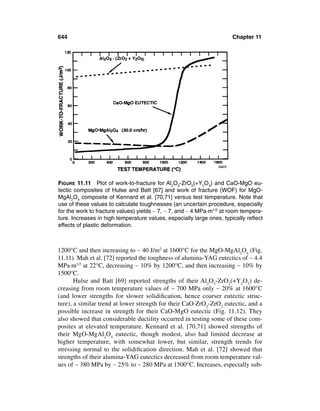
![12 Chapter 1
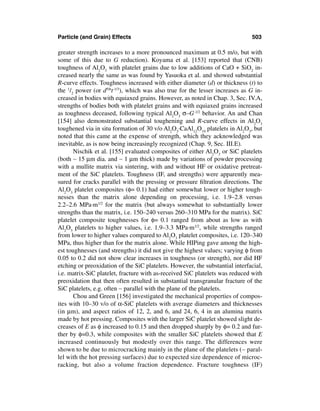
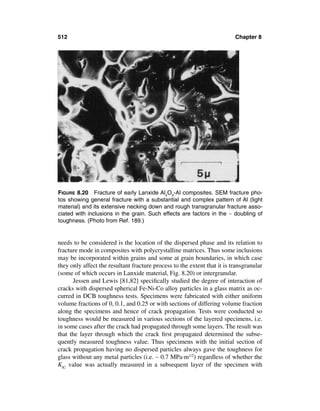
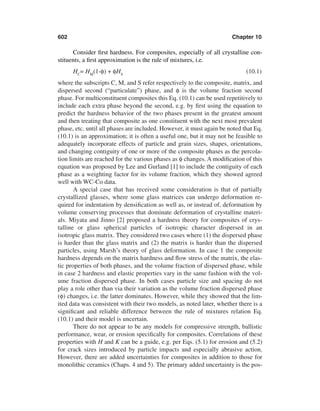
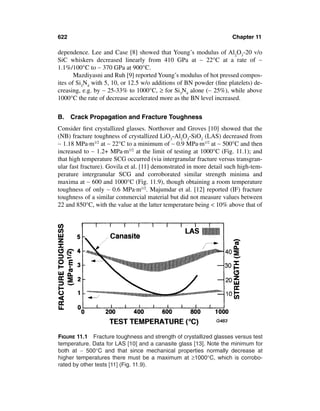
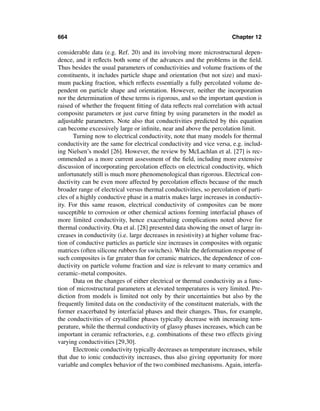
FIGURE 1.1 Clear, more extreme examples of bimodal grain structures seen on
room-temperature fractures. (A) Pure, dense Al2O3 (TEM of fracture surface
replica) showing two grain populations occurring as approximately interleaved (∼
vertical) laminations that are nominally perpendicular to the hot pressing direc-
tion. (B) Sintered ZrO2–8 wt% Y2O3 (SEM of fracture surface) showing a fine grain
matrix with approximately random distribution of much larger grains singly or as
clusters of two or three larger grains. Note in both cases that the smaller grains
exhibit predominately intergranular and the larger ones predominately transgran-
ular fracture.
larger than the average of the surrounding grains (e.g. Figures 1.2–1.4). The im-
pact of such larger grains or grain clusters can be significant, especially on ten-
sile strength, even if their occurrence is sparse, which makes determining their
character and whether they were the actual source of failure challenging, espe-
cially if they are not specifically identified at fracture origins.
While the occurrence and character of larger isolated grains or grain clus-
ters is quite variable, there are certain materials and processing factors that fa-
vor or exacerbate their occurrence and character. The material aspects entail the
basic composition itself and local concentrations of additives or impurities, or
sometimes deficiencies of them, especially additives. Consider first the basic
material composition, where a common factor is crystal structure. Large grains
or grain clusters are most common in some noncubic materials, e.g. CVD ZnSe
[3, 4] (Fig. 1.3C), more extensively in hot pressed or sintered B4C [4–6] (Fig-
ures 1.2D, 1.3D) and Si3N4 [7–10] and especially in SiC [5, 6, 11], Al2O3 [3–5,
12–18], and beta aluminas [5, 19–21]. In Si3N4 they are commonly rod-shaped
β grains often associated with local concentrations of oxide densification addi-
tives [8–10]. In SiC they are commonly long, narrow alpha platelets nucleated](https://image.slidesharecdn.com/mechanical-properties-of-ceramics-and-composites-120303143122-phpapp01/85/Mechanical-properties-of-ceramics-and-composites-13-320.jpg)
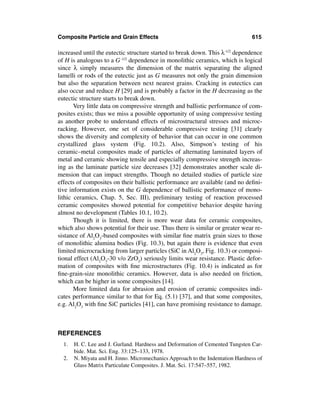
![Grain and Particle Effects on Ceramic Properties 13
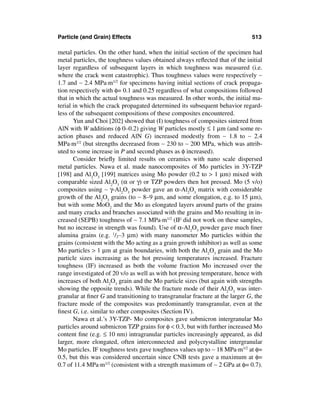
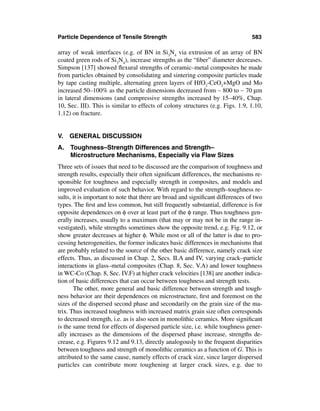
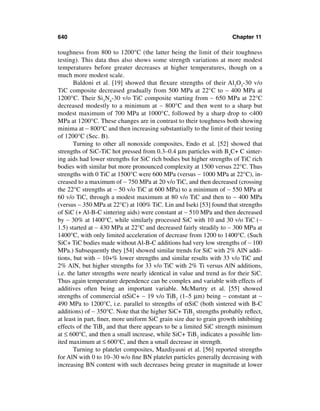
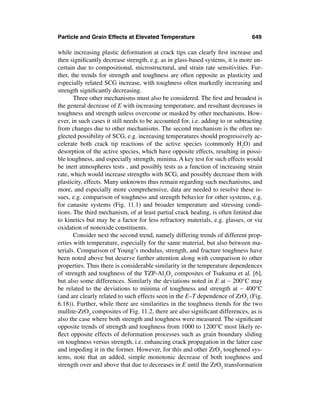
FIGURE 1.2 Examples of fracture origins from a single or dominate large grain
seen on room temperature fractures. (A) and (B) Commercial sintered 96% alu-
mina fracture origins from isolated larger grains at the flexure surface respectively
at 22°C (376 MPa) and -196°C (593 MPa) after Gruver et al. [14]. (C) Origin from
large grain at the flexure surface in pure hot pressed Al2O3 (396 MPa, giving KIC ∼
2.7 MPa·m1/2). (D) Origin from a large grain internal from the flexure surface of a
hot pressed B4C (<350 MPa at the grain). Smaller lighter area at the lower left
side, and the larger one on the right of the large grain, are areas of some porosity
and cracking. Note varying degrees of truncation of larger grains at the surface
from machining.
in bodies of β grains during sintering, typically at temperatures of ≥ 2000°C,
but they also occur as clusters in CVD SiC at much lower temperatures, as dis-
cussed below. Their lengths are often > 10 times their widths, with probable, but
poorly characterized, thicknesses a fraction of their widths [11]. Larger isolated
grains in beta alumina bodies are (usually thin) platelets, which are typical of
such bodies and are attributed to exaggerated growth of grains of the same or
modified beta aluminas [19–21], e.g. due to fluctuations in sodium content.
Large grain character in Al2O3 is more varied, ranging from equiaxed to platelet
or rod shapes. However, noticeable or significant exaggerated grain structures
have apparently not been observed in some noncubic materials such as MgF2
and mullite, which commonly have finer grain structures. The frequency, ex-
tent, and character of larger isolated grains or heir clusters is generally less in
cubic materials.
An important compositional impact on the occurrence and character of](https://image.slidesharecdn.com/mechanical-properties-of-ceramics-and-composites-120303143122-phpapp01/85/Mechanical-properties-of-ceramics-and-composites-14-320.jpg)
![14 Chapter 1
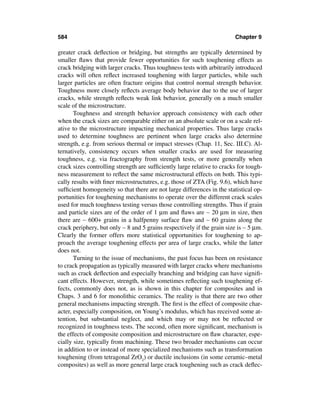
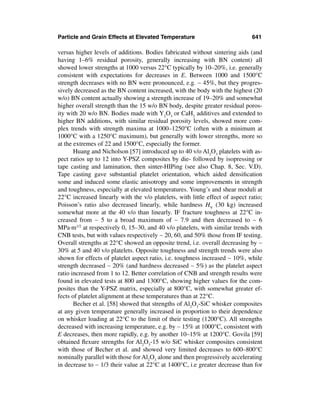
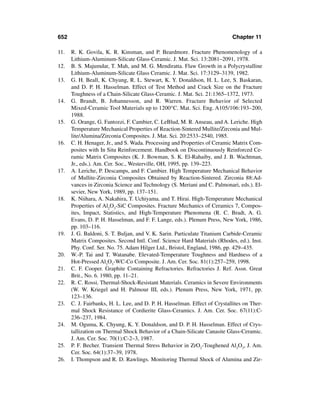
FIGURE 1.3 Examples of a few larger grains at ceramic fracture origins in flexure
at 22°C. (A) Pure hot pressed Al2O3 origin (483 MPa) via intergranular fracture
from a large platelet grain in the plane of fracture, bottom center of photo, and two
similar intermediate sized grains to the right, all three just inside the tensile sur-
face and at progressively higher angles to the fracture surface. The third (right)
grain is a white streak in this view, since it is seen nearly on edge, showing the
thin platelet nature of many such grains in Al2O3. (B) Pure hot pressed Al2O3 origin
from the tensile surface (405 MPa) from a large intergranularly fractured platelet
grain in the plane of fracture, bottom center of micrograph, showing impressions
of two or three intermediate sized tabular grains from the mating fracture surface
and a transgranularly fractured grain (right). (C) CVD ZnSe flexure origin from a
large grain in the plane of fracture at the specimen corner with an adjacent inter-
mediate sized grain (both transgranularly fractured). (D) Hot pressed B4C origin
(376 MPa) from a machining flaw (bottom center) and three to five larger grains
above and to the left. Note light laminar striations on some of the grains indicating
twinning and its interaction with the fracture.
larger grain structures in ceramics is the effects of additives, (local) impurities,
or both. Again, a number of noncubic materials, especially Al2O3, show a greater
extent and diversity of such effects, apparently reflecting significant anisotropy
in crystal (grain) growth characteristics. Thus thin platelets are common in bod-
ies of high purity Al2O3 hot pressed without MgO additions ([3–5, 12–16], for](https://image.slidesharecdn.com/mechanical-properties-of-ceramics-and-composites-120303143122-phpapp01/85/Mechanical-properties-of-ceramics-and-composites-15-320.jpg)
![Grain and Particle Effects on Ceramic Properties 15
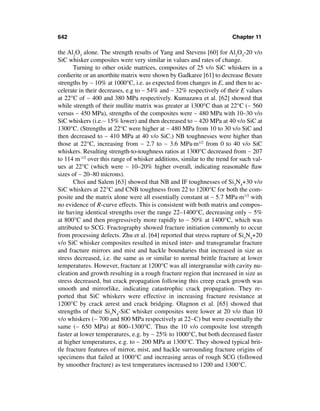
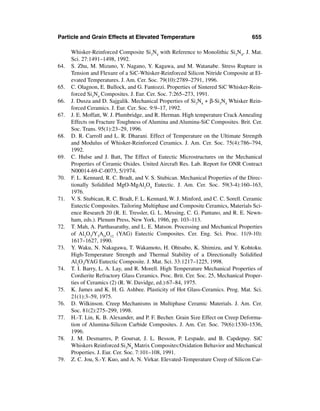
FIGURE 1.4 Examples of flexure fracture origins from clusters of larger grains in
alumina bodies in flexure at 22°C. (A) Pure hot pressed Al2O3 origin (443 MPa)
from a cluster of tabular grains just inside the tensile surface, with mostly trans-
granular fracture and mixed radial and random orientations. (B) Experimental
commercial sintered higher purity alumina origin (266 MPa) inside the tensile sur-
face from a cluster of tabular grains radiating from a central pore.
grain growth control, which can eliminate them if it is homogeneously distrib-
uted; other grain variations can occur with heterogeneous MgO distribution
[22]). Such platelet grains, which are apparently due to small amounts of Na-
based impurities (whose volatilization may be inhibited in hot pressing) trigger-
ing formation and growth of beta alumina grains in the absence of MgO or other
grain growth inhibition, are often primarily indicated by fracture occurring inter-
granularly between them and the adjoining finer grain structure (Fig. 1.3A).
Thicker platelet or rod-shaped grains, as indicated by their transgranular fracture
(Fig. 1.3B), and some nominally equiaxed (Fig. 1.2A) from similar or other
sources, are also common. Many larger grains arise from impurities, especially
when there is some radial growth pattern (Fig. 1.4), where the central void may
be due to a volatilized impurity, e.g. sodium. In some cases larger grains associ-
ated with pores may not be immediately around the pore surface but somewhat
into the surrounding solid, e.g. indicating diffusion of the species causing excess
grain growth reaching the concentration range favoring such growth [22].
Much of the above occurrence of elongated grains or grain clusters re-
flects directional growth, e.g. from a local impurity source. However, more
homogeneous impurity contents or excess additives commonly result in more
equiaxed and homogeneous larger grain clusters This is commonly the case
for the more limited occurrence of larger grains in cubic materials, e.g. MgO](https://image.slidesharecdn.com/mechanical-properties-of-ceramics-and-composites-120303143122-phpapp01/85/Mechanical-properties-of-ceramics-and-composites-16-320.jpg)
![16 Chapter 1
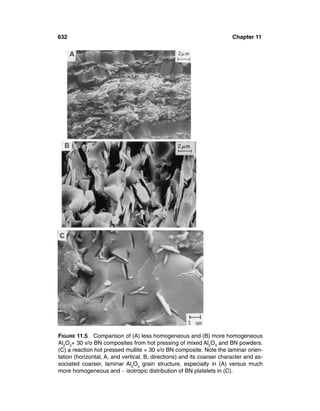
FIGURE 1.5 Examples of clusters of larger equiaxed grains at flexure fracture ori-
gins in Si3N4 at 22°C. (A) Commercial hot pressed material (HS-110), origin (432
MPa) from a larger grain cluster associated with primarily excess Fe and secon-
darily Mn impurities. (B) Experimental hot pressed specimen origin (520 MPa)
from a region of excess ZrO2 densification aid. (From Ref. 22. Published with the
permission of Plenum Press.)
[4, 22]. However, similar effects also occur in noncubic materials, e.g. Si3N4
[22] (Fig. 1.5) and Al2O3(22).
The above common occurrence of variable and often significant roles that
larger grains can play in mechanical failure raises important measurement issues.
The arbitrary use of the size of the largest grains or particles for correlating with
strength, as proposed by some, fails to recognize critical aspects of grains and
particles as fracture origins, namely sufficient sizes and associated defects such
as pores or cracks, which are discussed extensively in this book More fundamen-
tally, effects of larger grains, as well as practical factors, argue against continu-
ing the traditional dominance of obtaining grain and particle parameters from
polished surfaces.
While microstructural measurements from polished surfaces can be of
some use, their preparation and examination is far more time-consuming and
costly than that of fracture surfaces, especially from property tests whose results
are to be related to their microstructure. Fracture surfaces commonly reveal the
microstructure, without etching, more clearly than polished surfaces, even with](https://image.slidesharecdn.com/mechanical-properties-of-ceramics-and-composites-120303143122-phpapp01/85/Mechanical-properties-of-ceramics-and-composites-17-320.jpg)

![18 Chapter 1
observation and impact on grain size is dependent on their orientation relative to
the surface of examination, with very low probability of a random polished sur-
face giving results similar to that from fractures, especially fracture origins. The
second and even greater deficiency of examining polished versus fracture sur-
faces for necessary grain structure information is that other key information is
only available on the fracture surface. This includes whether the fracture origin
was from an atypical area of grain structure of sufficient size and with necessary
associated other defects (e.g. pores of cracks) to be the cause of failure, or
whether failure was from the primary flaw population with little or no effect of
grain structure variations. It also includes other important information such as
the fracture mode, and especially for intergranular fracture, information on grain
boundary character, e.g. phases and porosity.
C. Grain Variations, Mainly Shape and Orientation in Nominally
Single-Phase Ceramics
The above outline of the occurrence of larger isolated grains or grain clusters
has necessarily touched on grain shape and orientation, primarily in radial clus-
ters. However, there are material and fabrication-processing factors that further
affect either or both of these factors in a systematic fashion. Thus columnar, i.e.
longer, typically rod-shaped, grains characteristically form normal to a solidifi-
cation front with grain diameters and lengths typically inversely related to the
speed of the solidification front and the density of nucleation sites for new
grains. Such columnar grain structures occur in fusion cast refractories, espe-
cially near the mold surface where the solidification front is more uniform. The
more rapid cooling, especially near the mold surface, commonly results in
smaller grains there, though they are usually still substantially larger than grains
in typical sintered bodies. More rapid cooling results in smaller size columnar
grains, e.g. Fig. 1.7A. An extreme of the size/solidification speed is melt, e.g.
plasma, sprayed ceramic coatings (Fig. 1.6B) [23]. Thus unless there are com-
plications of other phases or formation of an intermediate amorphous phase, the
molten droplets splatting onto the deposition surface directionally solidify nor-
mal to the surface, typically as fine columnar grains. A large-scale manifestation
of such columnar structures and the common preferred crystal orientation in the
columnar grains that typically accompanies it is the slow, controlled directional
solidification of large polycrystalline ingots of cubic zirconia for the jewelry
trade (Fig. 1.7B) [24]. Such grains can reach dimensions of 10 cm or more in
large commercial ingots.
Vapor deposition processing, e.g. chemical vapor or physical vapor depo-
sition (CVD or PVD), of coatings, or in the case of CVD also of bulk bodies,
commonly results in various clustered grain and columnar structures that occur
together or separately. The occurrence and character of these depends on deposi-](https://image.slidesharecdn.com/mechanical-properties-of-ceramics-and-composites-120303143122-phpapp01/85/Mechanical-properties-of-ceramics-and-composites-19-320.jpg)
![Grain and Particle Effects on Ceramic Properties 19
FIGURE 1.7 Examples of columnar grains from directionally solidified melts of
partially and fully stabilized zirconia bodies. (A) ZrO2 + 5 wt% Y2O3 sequentially
solidified as thin layers on a solid surface (columnar grains form over the whole
thickness of the layer with their length essentially being the layer thickness). (B)
Examples of individual readily extractable grains (since the grains commonly are
not bonded to one another, especially at such large grain sizes) from directionally
solidified skull melts of differing w/o contents of Y2O3 (shown by each grain).
(From Ref. 24)
tion rates (e.g. on pressure and temperature) and the phases involved [4, 25]. At
high deposition rates, larger columnar grains result that are highly aligned axi-
ally (often with random radial crystal orientations), similar to those in directional
solidification. (In such cases the ends of the columnar grains on the free surface
of the deposit typically reflect single crystal faceting and are thus often referred
to as faceted deposits or surfaces, e.g. in TiN [26].) Such columnar grains may
have substantial aspect ratios, ranging from ∼1 to several-fold.
In the deposition range below that for producing larger aligned columnar
grains, deposition often occurs by successively nucleating colonies of grains of
similar orientation, especially axially with the growth direction. The colonies of
grains of related orientation from a common nucleus, typically with higher axial
than lateral growth rates, result in a knobby, bumpy, i.e. botryoidal or kidney-
like free surface of the deposition (Fig. 1.8). Such colonies of grains with pre-
ferred axial orientations can occur with varying grain shapes, including blocky
grains, but they commonly occur with bundles (colonies) of long, narrow
columnar grains (Fig. 1.9). The colonies broaden out as growth occurs but then
become constrained in their lateral growth by increasing competition with other
colonies and in their axial growth by nucleation of new colonies, in all but very
thin depositions.
Several factors should be noted about grain colonies. First, as a result of](https://image.slidesharecdn.com/mechanical-properties-of-ceramics-and-composites-120303143122-phpapp01/85/Mechanical-properties-of-ceramics-and-composites-20-320.jpg)

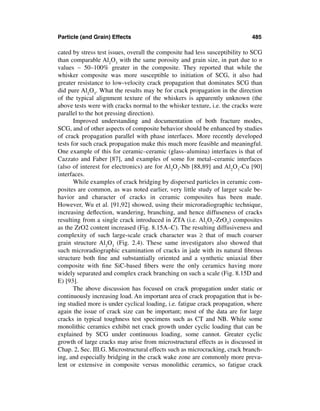
![Grain and Particle Effects on Ceramic Properties 21
the directional growth they have varying preferred orientations, mainly or exclu-
sively in the axial direction, giving a preferred orientation to the resultant coat-
ing or body. This preferred axial orientation within each colony causes it to
behave in some fashion as a pseudo larger, oriented grain or particle. Such grain-
like behavior commonly includes impacting fracture propagation (Fig. 1.10),
and possibly initiation, due to the preferred orientation, as well as possible
weaker bonding to adjacent colonies because of orientation-property differences
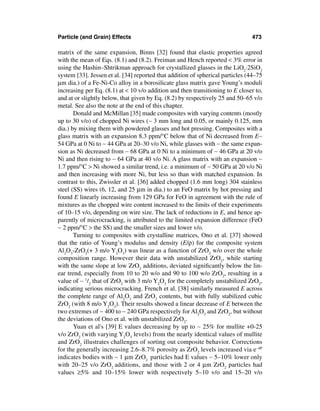
FIGURE 1.10 Examples of the effects of grain colonies in CVD SiC on fracture at
22°C. (A) and (B) Lower and higher magnification SEMs of fracture initiation (583
MPa) from a colony for stressing normal to the CVD growth direction. (C) Frac-
ture surface from stressing parallel with the growth direction, hence fracture nom-
inally parallel with the plane of deposition. The three major colony boundaries are
indicated by B. (After Rice [4], published with the permission of the ASTM.)](https://image.slidesharecdn.com/mechanical-properties-of-ceramics-and-composites-120303143122-phpapp01/85/Mechanical-properties-of-ceramics-and-composites-22-320.jpg)
![22 Chapter 1
and possible accumulation of impurities or other second phases and pores along
colony boundaries. [Pores can more readily form near the base or along the shaft
of the colony (bundle of grains) due to slower lateral versus axial growth of the
colonies and shadowing of these lower regions due to greater lateral growth of
the upper portion of the colony.] Again, the termination of the colonies on the
completed deposition surface (i.e. the side opposite from the initiation of the de-
position) is the characteristic boytrioidal (i.e. kidneylike) structure. While its oc-
currence and specifics vary with the material and deposition process, it is a very
common aspect of all deposition processes. It is well known in the deposition of
graphite, BN, SiC, and Si3N4, since these materials are common candidates for
such deposition, and also is common in many other materials, e.g. TiN [26]. In
the case of graphite it is common to cause some gas phase nucleation of parti-
cles, which on settling to the deposition surface act as nuclei for colonies, so
their number is increased and their size reduced, hence mechanical properties
improved. The boytrioidal structure and the related growth of grain colonies is
also common, but often on a much larger colony scale in a number of mineral
deposits, e.g. of important Fe and Cu ores [27].
Turning to other aspects of grain orientation and shape, consider the inter-
relation of these via particle shape effects in various fabrication methods. Con-
solidation of powder particles into green bodies results in some preferred
particle orientation whenever some of the particles have measurable shape devi-
ations from the equiaxed, i.e. spherical or regular polyhedral. Deviations in
terms of particle surface geometry, especially larger flat surfaces, e.g. reflecting
crystallographic faces formed in the growth or fracture, can play a role in orien-
tation. However, particle aspect ratio, i.e. of the axial length to the lateral di-
mensions, is a key parameter. These particle effects, which can be additive, are
a necessary condition for orientation, but they become sufficient only in con-
junction with varying aspects of different forming methods and their parame-
ters. Thus in pressing operations the aspect ratio of the green part to be formed
is a key factor, e.g. lower ratios in die (cold) and hot pressing result in increas-
ing alignment normal to the pressing directions, but ∼ random orientation in the
plane of pressing. Variations of alignment near the die walls and axial gradients
can occur, with the latter often being greater in single versus double acting
pressing. Tape casting and lamination typically increase the planer alignment,
though the extent and uniformity of this may decrease with increasing tape
thickness and decreasing ratio of particle dimensions to tape thickness. This re-
sults from shear being an important factor in particle alignment, and shear is
highest at the doctor blade surface and grades inward. Similarly, extrusion can
result in substantial orientation, which will be greatest at the surface and grade
inward, the extent of gradation increasing with the extrudate thickness and de-
creasing with the ratio of the particle size to the extrudate dimensions. Much
more complex orientation effects can occur in injection-molded bodies where](https://image.slidesharecdn.com/mechanical-properties-of-ceramics-and-composites-120303143122-phpapp01/85/Mechanical-properties-of-ceramics-and-composites-23-320.jpg)
![Grain and Particle Effects on Ceramic Properties 23
particle orientation can occur in the stream f material injected into the mold, but
then twisted, turned, and deformed in complex ways that depend on the charac-
ter of the mold shape and its inlet ports.
Grain and particle parameters are also frequently intertwined with other
microstructural parameters, especially porosity and impurities. Thus the loca-
tion, shape, and orientation, and sometimes the size, of pores are related to
grain, and especially particle, shape and orientation. For example, as noted
earlier, pores in platelet composites commonly remain at the platelet–matrix
interface [2], with such pores often being larger and typically somewhat
platelet in shape. Similar effects have been indicated in fiber composites [1]
and are likely in whisker composites. The relationship of particle and grain pa-
rameters being related to impurities results primarily from impurities often be-
ing the source of larger grains. Further, such larger grains are often tabular or
acicular in shape, which may have implications for orientation and porosity in-
teractions. Some of these effects are illustrated in the next section, and later in
the book.
D. Grain and Particle Variations in Ceramic Composites
Grain and particle structures are both important and interrelated in natural and
designed composites, and as with nominally single-phase ceramics, they depend
substantially on the fabrication method and parameters. Consider first conven-
tional powder-based fabrication methods, where the volume fraction of added
particles, whiskers, fibers, or platelets and their sizes relative to the matrix grain
size are key parameters. Typically the matrix grains inhibit the growth of the par-
ticles and vice versa. The relative degree of inhibition of the added phase on the
matrix phase increases as the volume fraction of the added phase increases and
its particle size decreases. This mutual inhibition of growth of the matrix and
dispersed phases greatly reduces or eliminates the extremes of exaggerated grain
growth in either phase and hence the complication of exaggerated grain (or parti-
cle) growth noted earlier for nominally single-phase ceramics. Thus just a few
volume percent of fine, homogeneously distributed particles of an insoluble sec-
ond phase can be quite effective in controlling grain growth, e.g. as clearly
demonstrated in Al2O3 without MgO but with fine Mo or W [28–30] or ZrO2 par-
ticles [31]. As discussed later, this inhibition of matrix grain growth can play an
important role in the improvements of strengths of some ceramics and ceramic
composites.
A partial exception to the mutual inhibition of growth of grains and parti-
cles in ceramic composites can occur in making such composites by in situ reac-
tion of powder ingredients. Thus, Cameron et al. [32] showed that larger grains
of various phases, e.g. Al2O3 (Fig. 1.11) and graphite, in such composites, though
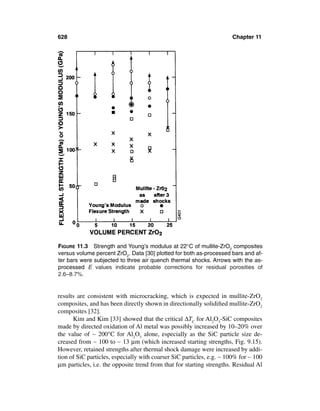
not as extreme in size as often found in nominally single-phase ceramics, were](https://image.slidesharecdn.com/mechanical-properties-of-ceramics-and-composites-120303143122-phpapp01/85/Mechanical-properties-of-ceramics-and-composites-24-320.jpg)
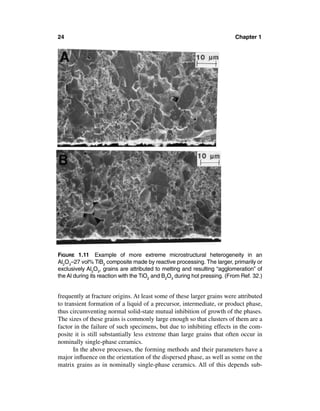
![Grain and Particle Effects on Ceramic Properties 25
stantially on the volume fractions, sizes, and especially the shapes of the parti-
cles to form the matrix grains and the dispersed phase, and the relation of their
shapes to their crystal structure. Use of whiskers, fibers, and platelets for com-
posites are common and has great effects on their orientation in fabricating
composites with them. The aspect ratio of the body and the degree of shear re-
sulting from forming operations are key parameters. Thus lower body aspect ra-
tios in die and hot pressing result in increasing alignment normal to the pressing
directions, but—random orientation in the plane of pressing. Variations of
alignment near the die walls and axial gradients can occur, with the latter often
being greater in double versus single-action pressing. Tape casting and lamina-
tion typically increase the planar alignment. While characterization of the size,
shape, orientation, and spatial distribution of the dispersed phase, as well as of
the matrix grain structure, is important, so can be that of the residual pore struc-
ture. This arises first since dispersed phases inhibit densification, generally in-
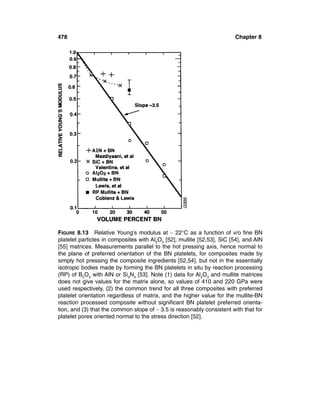
creasingly in the order of particles, whiskers (or short fibers), and platelets.
Second, pores are commonly associated with the dispersed phase, the size and
character of which impacts the size, shape, and orientation of the pores. Thus
platelets in particular commonly have larger laminar or lenticular pores at the
platelet–matrix interface.
Processing ceramic composite bodies from the melt is a large and complex
subject beyond the scope of this chapter, since it entails many variations and
complexities such as varying degrees of liquid solution or immiscibility, and
subsolidus phase separation processes (e.g. Refs. 33–35). The latter include
varying precipitation within grains and along grain boundaries, which all depend
on kinetics, interfacial energies, and their interactions with thermal aspects of the
solidification. The latter include the directionality and uniformity of the solidifi-
cation, the degree of columnar grains formed, and especially their extent of pre-
ferred crystallographic orientation. However, beyond the above broad
comments, two key points should be noted. First, some of the effects of the mul-
tiphase character are used to control the microstructure of the cast bodies, i.e.
similar to the effects of multiphase compositions on grain and particle structures
in sintered composites.
Second, the interaction of solidification, grain structures, and pore forma-
tion should be noted. Pores form in solidifying bodies due to extrinsic and intrin-
sic effects, the former arise mainly from two sources, as has been recently
summarized [1]. An extrinsic source is the release of gases adsorbed on the sur-
faces of the particles to be melted, e.g. such a pervasive problem that most melt-
grown crystals such as sapphire are made from previously melted material. The
other extrinsic source is the exsolution of gases upon solidification that were dis-
solved in the melt. The intrinsic source of porosity in bodies solidified from the
melt arises from the typical reduction of volume on solidification. Many ceram-
ics have volume reductions of 5–10%, as is common for most metals, but they](https://image.slidesharecdn.com/mechanical-properties-of-ceramics-and-composites-120303143122-phpapp01/85/Mechanical-properties-of-ceramics-and-composites-26-320.jpg)
![26 Chapter 1
can be much higher for some ceramic materials, e.g. to > 30%, with alumina
compositions commonly having ∼ 20% [36].
Introduction of porosity, especially intrinsically generated porosity, can be
eliminated by controlled directional solidification wherein the final solidification
occurs at a free surface. Such directional solidification typically results in colum-
nar grains of preferred orientation. In bodies at or near eutectic compositions,
proper control of the solidification front can result in aligned columnar grains or
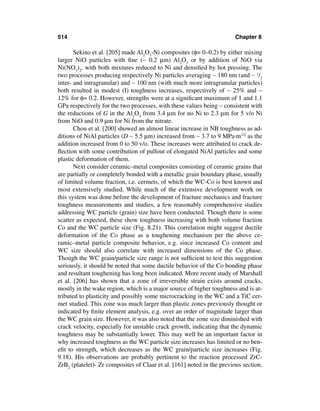
of single crystals with axially aligned rod or lamellar second phase structures
[37–39]. This is a large and extensive topic that is briefly noted here, since such
solidified eutectic structures have been of interest for their mechanical behavior
(Chap. 8, Sec. V. E, Chap. 9, Sec. III.F, and Chap. II, Sec. IV.E).
Another aspect of melt-processed materials is the crystallization of liquid
or amorphous materials, e.g. of glasses. While there are various aspects to this,
three are of particular note based on the source and scope of crystallization. The
first is homogeneous nucleation throughout the body, which occurs only in a mi-
nority of cases. It provides more uniform microstructures, which can be complex
at higher levels of crystallization, where crystallites begin to impinge on one an-
other, which occurs sooner as the aspect ratio of the crystallites increases. The
second, and more common, case is nucleation from free surfaces, either of a bulk
body of the crystallizing glass, or particles of it, e.g. in the latter case prior to or
during their consolidation into a dense body. In either case gradients of crystal-
lization commonly result.
Nucleation of a group of crystals from a common point (often a particle
of an added nucleation agent) commonly results in the formation of colonies of
rod or needle grains radiating from the common nucleation point (Fig. 1.12).
The colony grain structure noted in vapor deposited materials in the previous
section (Figures 1.7–1.9) is an important subset of a broader occurrence in-
volving the same basic underlying nucleation and growth of grains that is re-
ferred to as spherulitic crystallization. Such crystallization extensively occurs
from a variety of liquids, including salt solutions, polymers, and melts, e.g. of
some fusion cast refractories [34, 35], and especially for glasses (e.g. Refs. 40
and 41). Thus such crystallization occurs in various ceramic and related mate-
rials such as cementitious materials and in inorganic, i.e. many silicate-based,
glasses [42, 43] of particular pertinence here. There are two aspects of such
crystallization that significantly impact the nature of the resultant colony struc-
ture, namely the directionality of the nucleation and the subsequent growth of
the colony grains and the mutual impingement of growing colonies. Colonies
originating from a nucleus small in comparison to the resultant colony size and
growing in an isotropic medium may vary from a slightly dog-bone-shaped cross
section to a fully circular cross section, depending on parameters that are charac-
teristics primarily of the material and secondarily of the growth conditions. Fully
spherical colonies reflect central nucleation and radial growth (Fig. 1.12).](https://image.slidesharecdn.com/mechanical-properties-of-ceramics-and-composites-120303143122-phpapp01/85/Mechanical-properties-of-ceramics-and-composites-27-320.jpg)

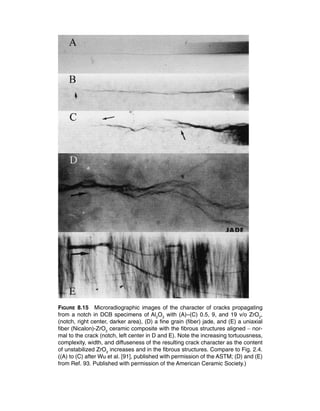
![28 Chapter 1
glass is subsequently destroyed by subsequent crystallization into larger lath
grains at higher temperatures [43].
Individual grains in such spherulites typically have a preferred orientation
in the radial direction but random orientation about their radial axis. Thus one of
the characterization challenges that such spherulite structures pose is the contrast
of radial orientation in each spherulite versus the global orientation of the body.
The latter is typically random, since the orientation within each spherulite is ra-
dially symmetric, and there is rarely any coordination of the orientation of differ-
ent spherulites. However, besides complicating the microstructure, these
spherulites can play a role in some key, especially mechanical, properties since
they often act as large grains, i.e. as noted earlier for spherulitic clusters of larger
grains in sintered bodies (Fig. 1.3) and grain colonies in deposited, e.g. CVD
bodies (Figures 1.8–1.10).
IV. GRAIN AND PARTICLE CHARACTERIZATION
AND PARAMETERS
A. Overview
Thorough microstructural characterization to address most, especially all, of the
challenges and uncertainties noted in previous sections is a large task that is of-
ten beyond the scope and funding allowable for such evaluations. Detailed de-
scription and discussion of all, or even the most important, characterization
methods and how to make them more effective is a task beyond the scope of this
book. The reader is referred to a few references on general characterization
(Refs. 44–47, e.g. more current sources as recommended by academic col-
leagues). The primary problem, however, is that much of the pertinent mi-
crostructural characterization in the literature is marginal or inadequate. This
arises in part from limitations of many techniques as well as their often being in-
completely, inadequately, or inappropriately used, as well as test methods, para-
meters, or results often being inadequately described. Thus an overview of the
process and discussion of some key needs is presented.
The basic approach to the microstructural characterization needed to resolve
important issues effectively from both technical and practical standpoints gener-
ally consists of two aspects. First and most fundamental is to draw upon informa-
tion on the material, fabrication-processing, and microstructural trends, preferably
from both the literature, e.g. as outlined earlier, and the experience of the investiga-
tor and colleagues as a guide for probable needs. The second aspect is a multiple
stage, often iterative, characterization of samples, starting with a screening stage of
the body being investigated.. Though blanket application of routine evaluations,
e.g. basic stereology, can be valuable, selective characterization in a staged fashion
based on initial screening and subsequent information is often more effective.](https://image.slidesharecdn.com/mechanical-properties-of-ceramics-and-composites-120303143122-phpapp01/85/Mechanical-properties-of-ceramics-and-composites-29-320.jpg)
![Grain and Particle Effects on Ceramic Properties 29
The initial screening stage should identify the basic microstructural char-
acteristics pertinent to the behavior of concern, as well as indications of the pres-
ence or absence of complications such as anisotropies and variations, e.g.
gradations and heterogeneities. Such screening should typically entail a range of
samples and tests (e.g. as discussed in the next section) aimed at indicating what
microstructural factors may be pertinent, variable, and in need of more defini-
tion. It should commonly include examination of representative fracture surfaces
for both time and cost effectiveness, as well as fracture information, especially
for mechanical, but also frequently for nonmechanical, property evaluations.
Subsequent characterization stages should be guided by results from previous
stages and remaining needs to clarify or confirm the microstructure-material be-
havior of concern.
The first of three general guides for such evaluations is remembering that
the need for, and the effectiveness of, microstructural characterization can de-
pend on the nature of the properties measured and the specifics of the measure-
ments conducted. Thus one microstructural value or technique will not meet all
needs as discussed below, e.g. to reflect different effects or extents of variations
of the grain size distribution, shapes, and orientations that have differing effects
on different properties. Second, qualitative or semiquantitative characterization
should always be given in the absence of, as well as often with, detailed quanti-
tative characterization, e.g. illustrative microstructural photos (with scales and
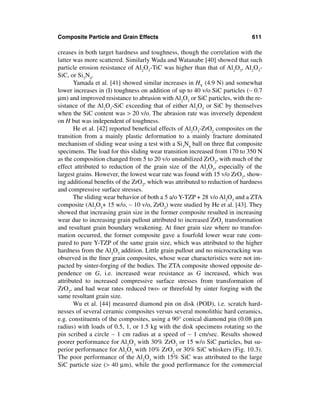
comments) can be valuable. This is also true of descriptions of the fabrication,
process parameters, and resulting samples. Examples of more detailed, but still
incomplete, grain structure descriptions are those of Ting et al. [48] and espe-
cially McNamee and Morrell [49]. Third, it is usually valuable to compare dif-
ferent related measurements, e.g. this is often of more value than one more
detailed measurement, since all have their limitations.
B. Grain and Particle Size Measurements
Turning to actual measurements of grain and particle size, two aspects of this are
detection of the grain and particle structure and then its measurement, which to-
gether can entail several stages. Most grain and particle structures are detected
by various microscopies, typically in the order of decreasing simplicity and in-
creasing magnification ability and cost: optical (OM), scanning electron (SEM),
and transmission electron microscopy (TEM, occasionally still of replicas, but
mainly of thin sections). TEM for very fine (submicron) grain or particle struc-
tures overlaps with analysis of x-ray and neutron diffraction data to yield grain
and particle size information. OM and SEM can be done directly on either pol-
ished or fracture surfaces, and OM can also be done on optical thin sections.
While both polished and fracture surfaces may require etching to reveal the grain
and particle structures, this is primarily so for polished surfaces, which are far](https://image.slidesharecdn.com/mechanical-properties-of-ceramics-and-composites-120303143122-phpapp01/85/Mechanical-properties-of-ceramics-and-composites-30-320.jpg)
![30 Chapter 1
more time-consuming and costly to prepare. Thin sections are also more time
consuming and costly to prepare but typically readily define size and shape as-
pects of the microstructure and can often give substantial orientation and some
crystallographic information. Fracture surfaces also have the advantage of re-
vealing the grain structure of fracture, which can be critical for revealing effects
of isolated larger grains or grain clusters, especially of thin platelet grains. Repli-
cas of fracture are sometimes used in OM and SEM to increase the amount of re-
flected light or contrast definition of the microstructure.
Microscopies typically give photo or screen images from which measure-
ments can be made by various, especially stereological, techniques. A compre-
hensive discussion of these techniques is a large and complex topic beyond the
scope of this book, since there are variations of, limitations of, and complica-
tions to many of these techniques. The reader is referred to other sources on the
subject [50–63]. The goal here is instead to note basic techniques and limitations
and suggest basic and practical approaches to provide guidance, and to stimulate
further development of the techniques.
At the lower, basic end of a potential hierarchy of needs is a simple but im-
portant nominal average grain or particle size value. An approximate value can
often be obtained by measuring a few representative grains or particles, and a
more accurate value from the commonly use linear intercept and related tech-
niques. These give G=αl, where l is the average intercept length for grains along
a random sample line and α = a constant (commonly ∼ 1.5) to account for the
fact that neither the sampling lines nor the plane on which they are taken cut
grains at their true diameters. However, both theory and experiment show α val-
ues ranging from <1 to >2, due to only partially understood dependencies on
grain shape and size distributions [64, 65] and possibly on whether the surface is
polished or fractured [66, 67] and the degree of inter- vs. trans-granular fracture.
(See Refs. 68 and 69 for other limited microstructural evaluation from fracture
surfaces, and Ref. 70 for characterization of intergranular and transgranular frac-
ture.) It is thus important to give measurement specifics, including what value is
used to obtain the “true” grain size, since there is no single conversion value.
Many investigators simply use α = 1 but often do not state this nor give enough
other information.
Next, consider several aspects of linear intercept and related measure-
ments starting with the reliability and repeatability of determining an average G
value based on detailed comparative round robin tests [71, 72]. These showed
about a 10% scatter among 25 international laboratories on an ideal computer-
generated grain structure, based on counting at least 100 linear (or circular) in-
tersections (and is estimated to be only cut in about half by going to 1000
intersections). Scatter increased to ∼ 25% for a “nice” (96% sintered alumina)
microstructure (equiaxed grains of relatively uniform size with clearly marked
grain boundaries). The increase was attributed to factors such as differences in](https://image.slidesharecdn.com/mechanical-properties-of-ceramics-and-composites-120303143122-phpapp01/85/Mechanical-properties-of-ceramics-and-composites-31-320.jpg)
![Grain and Particle Effects on Ceramic Properties 31
polishing and etching techniques and their effectiveness. Analyses of a more
complicated but not uncommon (sintered 99% alumina) microstructure resulted
in an ∼ doubled scatter of results (and somewhat higher scatter still for similar
measurements of the limited porosity). Thus measurements of grain sizes are
likely to vary by 25–50% or more, and uncertainties in conversions to a “true
three-dimensional size” can double or triple this variation or uncertainty.
Consider now four issues of linear intercept (and related circle and grid)
measurements. These are, in order of decreasing development and increasing se-
riousness, (1) that it is limited in giving values reflecting the range of grain size,
e.g. the standard deviation (since analysis is based on a single-size, equiaxed
grain), (2) that these are limitations in handling nonequiaxed grains or particles,
e.g. of tabular or rod-shaped grains or particles, (3) there being no precise way to
relate an average G or D value with an individual, e.g., maximum value, i.e. Gm
or Dm (e.g. there is no way accurately to relate the measurement of a single grain
diameter on a sample surface to random grain chords or linear intercepts), and
(4) a single G or D value may often not be sufficient, i.e. there can be a need for
different grain or particle size values to reflect differing impacts of the grain or
particle structure itself, or of its variation in size, shape, or orientation. Though
progress has been made allowing estimates of the grain size distribution, it still
assumes uniform, e.g. spherical or tetrakaidecahedral, grains [50–56, 64–66].
Exact accounting for a mixture of grain sizes can be made by computations for
mixtures of a few groups of different size grains, with each group consisting of
uniform size spherical grains [50]. Methods for a broader range of grain sizes
have been presented [73].
Progress has also been made on conversion of measurements of non-
equiaxed grains or particles, e.g. of tabular or rod-shaped grains or particles and
their shape factors on a plane (typically polished) surface to their true three-di-
mensional character. An exact relation has been derived and validated assuming
identical cylindrical grains as an extreme of elongated grains [74]. More re-
cently, using similar idealizing assumptions based on spheroids of uniform size
and shape [75], a shape factor, R, has been recommended, defined as
R = (AT)-1ΣiAifi (1)
where Ai is the area on the sampling plane of the individual grain, f the corre-
sponding grain aspect ratio, and AT the total area of all grains on the surface be-
ing evaluated. Handling of bi- or multimodal distributions of such nonequiaxed
grains is recommended via a rule of mixtures based on the areal weighting of
each population of elongated grains or particles. However, as noted below for
analysis of fracture behavior, specific dimensions are still important. Further,
while the above-outlined procedures are of significant help, they involve uncer-
tainties, which can be significantly compounded by factors such as shape, size,
and orientation distributions in a single grain structure.](https://image.slidesharecdn.com/mechanical-properties-of-ceramics-and-composites-120303143122-phpapp01/85/Mechanical-properties-of-ceramics-and-composites-32-320.jpg)
![32 Chapter 1
Consider now the comparison of average values of grain or particle sizes
in a given body when there are grains or particles present representing other size
(or shape) populations. There are at least three cases of concern. The first is bi-
or multimodal populations (e.g. Fig. 1.1). This presents the least problem, espe-
cially when the differing populations are clear and present in sufficient quantities
so that normal techniques can be applied to each distinct population. The second,
and particularly serious, case is when there are only a limited number of substan-
tially larger (or differently shaped, or both) clustered or individual grains, espe-
cially as fracture origins (e.g. Figures 1.2–1.5). Accurate comparison of an
average size from linear intercept and related measurements with the size of one
or a few larger grains or particles on a fracture surface is not possible, though it
can be addressed by the use of two-dimensional sizes as discussed below. A sim-
ilar problem with essentially the same solution is that commonly found in bodies
with some, and especially most, or all large grains. The problem arises since the
large grains at the surface, though commonly substantially truncated by machin-
ing (e.g. Figures 1.2 and 1.3C) are still often the fracture origin, but the body av-
erage grain size does not reflect their, often substantially, reduced dimension.
However, even with a normal monomodal population there are issues of
which average size is appropriate. While a linear average size, i.e. weighted by
the first power of G or D for each grain or particle size respectively, is commonly
used, since it is the simplest to obtain, it is often not the most physically meaning-
ful [5]. Such a linear average gives a high weighting to small gains and a low
weighting to larger ones [76], which is opposite to important trends for some key
mechanical properties. Thus an average based on the volume of the grains or par-
ticles, hence weighted by G3 and thus substantially by the presence of larger
grains or particles, may often be more appropriate for some property compar-
isons. Examples of this are where mass distribution or volume absorption (e.g. of
radiation), or diffusion in composite, or more commonly in single-phase, bodies
are important. More pertinent to this book is where properties are related to the
surface areas of the grains or particles. Thus where diffusion, conduction, or frac-
ture along grain boundary surfaces is pertinent, an average weighted by G2, which
gives more, but not extreme, emphasis to larger grains or particles may be appro-
priate. Similar, and of somewhat greater interest in this book, are cases where
properties or behavior depends on the cross-sectional area of grains or particles.
Key examples are transgranular fracture in crack propagation tests and especially
tensile and compressive failures, and hardness, wear, and erosion resistance eval-
uations. Electrical and thermal conduction, especially in composites, may often
fall into this latter category. For example, weighting based on grain area, i.e. G =
[∑iGi3][∑iGi2]-1, as opposed to grain diameter, i.e. G = (1/n) [∑iGi], increases the
impact of larger grains on the average (e.g., in measuring diameters of 30 grains
on a commercial lamp envelope Al2O3, the area-weighted and normal Ga were re-
spectively 51 and 29 µm) [3, 5]. An alternant, direct weighting method for obtain-](https://image.slidesharecdn.com/mechanical-properties-of-ceramics-and-composites-120303143122-phpapp01/85/Mechanical-properties-of-ceramics-and-composites-33-320.jpg)
![Grain and Particle Effects on Ceramic Properties 33
ing a “composite” grain size was suggested by Goyette et al. [77], who noted that
it was important in correlating the microstructure of various commercial alumina
bodies and their response to single-point diamond machining.
The other aspect of which G or D value to use is whether it should be a
two- or a three- dimensional value [5]. Some properties and behavior are better
correlated with a three-dimensional grain or particle size, e.g. elastic properties
(of composites) and electrical and thermal conductivities. However, since frac-
ture is an area-dependent process, it is more realistic to make measurements of
grain or particle dimensions actually exposed on the fracture surfaces. Similarly,
the area intercepted by larger grains on wear or erosion surfaces is more impor-
tant than the three-dimensional sizes. Converting a linear intercept measurement
to an average surface grain diameter, Gs, might be done using Gs ∼ ({1 + α}/2) l
(i.e. assuming that half of the correction, α - 1, is due to the randomness of the
sampling plane cutting the grains and half to the randomness of the linear inter-
cept itself), but it is uncertain in both the form and the actual α value. Overall, it
appears better to measure actual grain or particle diameters exposed on the frac-
ture surface, e.g. selected by using random lines as in the linear intercept
method. Such measurements would be directly related to measuring individual,
e.g. the largest, grains on fracture. Having actual grain or particle diameters on a
fracture surface allows the calculation of an average grain size (G) or particle
size based on various weightings. Such two-dimensional values should be more
pertinent to bulk fracture properties as well as wear and erosion phenomena.
Two further points should be noted. First, for fracture from elongated
grains or particles, use of a size reflecting their area on the fracture surface is
typically a good approximation [78], but more accurate calculations require the
actual dimensions. Some used the maximum grain or particle dimension, i.e.
length [11], but fracture mechanics uses the smaller dimension of an elongated,
e.g. elliptical, flaw as C (the larger dimension impacts the flaw geometry para-
meter), so this is inappropriate (as is the smallest grain dimension by itself, as
previously suggested [41]); an intermediate grain or particle size value is appro-
priate. However, the aspect ratio (and orientation effects) may be important, e.g.
as indicated by Hasselman’s [79] modeling of effects of elastic anisotropy of
grains on mechanical properties. Second, it is important that the different, i.e.
two- and three-dimensional grain or particle size values be relatable, which re-
quires substantial further analytical and experimental evaluation.
C. Spatial Distribution and Orientation Measurements
Besides grain or particle size and shape, the spatial distributions of these para-
meters can also be important, especially if fracture origins were not identified.
Systematic spatial variations of sizes and shapes, e.g. between the surface and
the interior, e.g. from loss of additives near the surface or machining truncating](https://image.slidesharecdn.com/mechanical-properties-of-ceramics-and-composites-120303143122-phpapp01/85/Mechanical-properties-of-ceramics-and-composites-34-320.jpg)
![34 Chapter 1
large surface grains (Figures 1.2 and 1.3C), are easier to handle. Handling ran-
dom or irregular distributions of larger grains or particles (e.g. due to variations
in initial particles, additives or impurities, or porosity) indicates the need for sta-
tistical methods, especially to determine spacings of larger grains, particles, or
their clusters. Stoyan and Schnabel [80] used a pair correlation approach to ad-
dress this problem, characterizing the frequency of interpoint distances (e.g. be-
tween grain vertices or centers—the latter was preferred). They showed a higher
correlation of strength for nearly dense Al2O3 bodies than with Ga (∼ 9 to 15 µm)
itself. Modern stereological tools make such characterization more practical (and
potentially applicable to pores and pore–grain or pore–particle associations), but
again fractography is the most assured method of addressing this.
Overall, i.e. global, preferred crystallographic orientation of grains or parti-
cles clearly occurs in varying degrees as a function of forming methods and pro-
cessing and material parameters, as is discussed in Chaps. 2–12. Such orientation
can clearly affect properties, especially mechanical ones, in a desirable or undesir-
able fashion, and is often a major issue in understanding the microstructural depen-
dence of properties, especially when its presence is not accounted for. When
associated with grain or particle geometry, especially elongation, substantial orien-
tation information can be obtained from stereological measurements. However, x-
ray diffraction techniques, which range from qualitative Laue patterns, to
comparisons of intensities of various x-ray lines, to complete pole figures, are typi-
cally more versatile, effective, and widely used. Pole figures are the most accurate,
comprehensive, costly, and time-consuming but have been greatly aided by modern
computer aided characterization, and possibly by newer, additional methods of de-
termining grain orientations [81–83]. Also of potential importance is local grain or
particle orientation, e.g. of individual elongated or platelet grains or particles, or
clusters of them, especially at fracture origins. Such information can be important to
determine if microcracking from thermal expansion anisotropy was a factor in frac-
ture. In the past such information was difficult to obtain. However, modern micro-
scopic analytical techniques are providing increasing capabilities in this area [84].
Thus, in summary, at least two different but related G or D values may often
be needed, one based on cross-sectional, especially fracture, area for fracture, as
well as probably wear and erosion, and one on three-dimensional size for elastic
and conductive properties. Both values should be relatable, which is a challenge
due to varying size, shape, and orientation not necessarily being independent of
one another and their interrelations probably varying for different properties. Fur-
ther, the impact of these grain parameters on properties can depend significantly
on the spatial distributions of each of these variables. Thus the size of isolated
larger platelet grains is likely to have limited effect on some properties such as
electrical or thermal conductivities, provided they are not associated with other
important microstructural complications such as accumulations of second phases
or microcracking. However, even in the absence of the latter complications, they
can have varying effects on fracture properties ranging from erosive particle im-](https://image.slidesharecdn.com/mechanical-properties-of-ceramics-and-composites-120303143122-phpapp01/85/Mechanical-properties-of-ceramics-and-composites-35-320.jpg)
![36 Chapter 1
ure rods have the smallest stressed volume but a larger surface area from which
surface-related flaws can be activated at variable stress. Progressing to true ten-
sile tests (e.g. from three- to four-point bending, to hoop tension then uniaxial
tension) as well as increasing specimen sizes in each test gives grater emphasis
to failure from microstructural extremes and to the role of associated defects
(mainly pores and cracks). Of equal or greater importance is the effect of temper-
ature. A recent review [85] and Chaps. 6, 7, and 11 show that temperature
changes of a few hundred degrees Celsius can shift the microstructural depen-
dence of behavior in different fashions for different materials and thus can be a
valuable tool in defining the mechanisms controlling behavior.
Fractography, besides being important for microstructural characterization,
is also the first and most fundamental of three approaches to properly correlate
fracture, especially strength, and grain or particle parameter values. This, if suc-
cessful, allows both the actual G and the location of fracture initiation to be deter-
mined. With the latter the failure stress (if <σm) can be corrected for stress
gradients into the sample depth. (Correction for off-center failures due to gradients
along the sample length, e.g. for three-point flexure, is a separate operation from
fractography.) However, as noted above, even with fractography there can still be
considerable uncertainty; hence the need for other approaches. The second ap-
proach is to use the various microstructure measurements and analysis discussed in
the previous section, especially in conjunction with specimen stress–volume and
surface area relations noted earlier. Thus smaller specimens and stressed volumes
reflect less G variation, so Ga is more reasonable, while larger specimens and more
uniform stressing emphasizes effects of microstructural extremes. The third ap-
proach is to use the known property-microstructure behavior as a guide. This and
the other approaches are best when done in combination with one another, e.g. for
specimens known to have a range of G, the statistical fit of its σ with other data, es-
pecially for more homogeneous grain structures, at the pertinent G values can be
used as a guide for the placement (or rejection) of a data point probably also aided
by fractography. Lack of such combinations and comparison has been a serious
shortcoming of many earlier studies, including those using Gm.
The need for fractography for other mechanical tests has also been demon-
strated in crack propagation–fracture energy and toughness tests, e.g. again
showing the impact of microstructural heterogeneities such as larger grains [86].
Thus tests with different crack sizes and extents of propagation should be of
value, especially with fractographic examination. Similarly, evaluation of wear
and erosion as a function of impacting particle sizes, velocities, and materials
can be important, again especially when coupled with microstructural (i.e. often
local fractographic) examination of various wear or impact sites. Again tests as a
function of even limited temperature increases can be very valuable.
Finally, the importance of demonstrating isotropy of properties, instead of
assuming it without substantial reason, is critical because of the frequent occur-
rence of some anisotropy in bodies commonly assumed to be isotropic. Such eval-](https://image.slidesharecdn.com/mechanical-properties-of-ceramics-and-composites-120303143122-phpapp01/85/Mechanical-properties-of-ceramics-and-composites-37-320.jpg)
![Grain and Particle Effects on Ceramic Properties 37
uations should include measurements of other properties, which are of broader im-
portance than just the issue of isotropy. Thus elastic property measurements are
important to correlate not only with other mechanical properties but also with non-
mechanical ones, e.g. electrical and thermal conductivities, as well as of the latter
with other mechanical properties, especially in composites. An important aspect of
such intercomparison of properties is not only the specific property values but also
their distribution. Thus the Weibull modulus of failure from mechanical testing is
similar, but not identical, to that for failure from dielectric breakdown [87, 88], re-
flecting the similarities and differences of the sources of such fracture and break-
down [1]. While both failures are impacted by locally higher porosity, mechanical
failure is determined more by a compact area of more, larger, or both pores, usu-
ally intergranular, often close or connected, ones, acting as much or all of the fail-
ure causing flaw. Thus the cross-sectional area of the pores parallel with the stress
is not a key factor, while their area normal to the stress is, along with their close
spacing. Electrical breakdown also is fostered by accumulations of pores, espe-
cially intergranular ones (often associated with larger grains, and probably bound-
ary phases). However, pores that are most serious in electrical breakdown are those
in an (often discontinuous) chain forming a failure path with the least solid mater-
ial through the body. The closeness or connection of the pores and their cross-sec-
tional area normal to the breakdown is not as critical, while their net area along the
resultant breakdown path is. Another factor is that most mechanical tests are in
flexure, and hence in a stress gradient, while most electrical breakown tests are in a
uniform electrical field analogous to uniaxial tensile testing. Recognition and use
of such differences in the details of the microstructural effects of varying tests and
properties is thus a very valuable, but seldom used, tool to separate out specifics of
the microstructural dependences of properties.
VI. SUMMARY AND CONCLUSION
Grain and particle parameters, especially but not exclusively size, play an impor-
tant role in many, especially mechanical, properties. Though often less in magni-
tude than effects of porosity, grain and particle shapes and orientations and
especially sizes can commonly vary important properties by up to a few to sev-
eral fold. Since increased properties from control of grain or particle parameters
are typically over and above those obtained by minimizing porosity, they are es-
sential factors in obtaining high property levels. While their impact is greatest
through primary effects, secondary effects can also be important but have re-
ceived much less attention.
Microstructures range from fairly simple to very complex, offering both
challenges for characterization and opportunities for achieving desired proper-
ties. However, accurate characterization of even simple microstructures can be
complex and uncertain in meeting needs. For example, at least two grain and
particle sizes are needed, one based on area and one on volume (i.e. respectively](https://image.slidesharecdn.com/mechanical-properties-of-ceramics-and-composites-120303143122-phpapp01/85/Mechanical-properties-of-ceramics-and-composites-38-320.jpg)


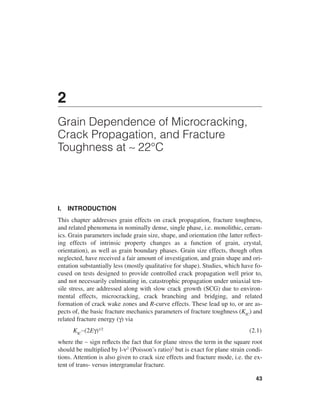
![44 Chapter 2
A fundamental complication in addressing fracture toughness is that differ-
ent tests often give similar results for some materials and microstructures, but
different results, often significantly so, for other materials and microstructures
for the same test parameters. While some factors causing these differences, such
as crack size and microstructure, are recognized, much understanding is still
needed, e.g. of interrelations between crack size and geometry, microcracking,
crack branching, slow crack growth, and crack bridging. Another complication is
the frequent inadequate material, especially microstructural, characterization, a
concern it is hoped this book will aid in rectifying. However, since the full range
of test and materials parameters has not been evaluated, understood, or recog-
nized, compounding confusion and uncertainty, it is necessary to note some as-
pects of the different tests to indicate some probable contributions to these
complexities. A further complication is that while there are many common and
self-consistent trends in crack propagation tests considered in this chapter, there
are differences, e.g. in fracture mode, and especially differences between grain
dependences of fracture toughness and tensile strength, which are partly ad-
dressed here and more extensively in Chaps. 3, 6, 8, 9, 11, and 12.
Despite complications outlined above, much understanding has been es-
tablished or can be obtained by integrating observations of fracture mode, SCG,
microcracking, toughness, and strength. Thus fracture is mainly intergranular for
finer grains, becoming transgranular for most grain sizes and materials; but mi-
crocracking, which can be environmentally, and is clearly G, dependent, and
SCG can extend intergranular fracture to larger G. The significant maxima seen
in many fracture energy and toughness tests as a function of G, originally attrib-
uted to microcracking, are now generally attributed to wake bridging or R-curve
effects. However, microcracking can play a role in intergranular fracture, crack
branching, and crack wake bridging or R-curve effects, as well as some other
toughness and mechanical property behavior. Fracture toughness–tensile
strength differences are due to basic differences in propagation of their respec-
tively large versus small cracks, e.g. their scale to that of the microstructures.
II. TEST AND MECHANISMS BACKGROUND
A. Crack Propagation–Fracture Toughness Test Methods,
Factors, and Differences
A variety of crack propagation tests exist for slow crack growth and fracture en-
ergy (γ) and toughness (KIC), which form an extensive subject themselves. Here
the focus is primarily on grain effects and secondarily on related parameters, e.g.
whether the assumed crack character and scale is pertinent to behavior to be
evaluated. The reader is referred to other sources for the mechanics and evalua-
tions of these methods [1–10]. These methods can be approximately ranked by](https://image.slidesharecdn.com/mechanical-properties-of-ceramics-and-composites-120303143122-phpapp01/85/Mechanical-properties-of-ceramics-and-composites-45-320.jpg)
![Grain Dependence of Microcracking, Crack Propagation 45
the typical crack sizes they entail and these in turn broken into subgroups based
on both test specimen nature and partly on the extent of stable crack propagation.
Going from larger to smaller potential crack sizes, major tests employ (1) plates,
i.e. double cantilever (DCB), double torsion (DT), and compact tension (CT), (2)
beams the same as or very similar to those for flexural strength, i.e. notch (NB),
chevron notch (CNB), indent (I, or indent fracture, IF), and (3) fractography (F,
i.e. calculated from the strength and subsequently observed failure initiating flaw
size, location, and geometry). This ranking by crack size, though only approxi-
mate, since it also depends on specimen sizes and the extent of crack propaga-
tion, is important, since it approximately correlates with toughness values (Table
3 of Ref. 11) and is a factor in different microstructural dependences of tough-
ness and strength. Recent terminology distinguishing “long” and “short” cracks
is a step in the right direction, but it is incomplete, because this refers to only
one, neglecting the other, dimension of crack propagation; “large” and “small”
are more accurate descriptions for crack size effects.
The diversity of tests is greater since there are different versions of them,
especially of DCB and NB tests; no test is dominant, since each has advantages
and disadvantages. Thus plate-based tests use the most material and indentation
(I) tests the least, but the latter as well as DCB and CT tests are generally not ap-
plicable for differing, especially high, temperature tests. DCB and DT tests typi-
cally provide the greatest extent of constant stress intensity propagation and the
lowest achievable controlled crack velocities for SCG tests. DT, which is useful
at high temperatures, uses torsion loading with a resultant long curved crack
front (the direction of which depends on the direction of torsion loading) that
may limit in situ observations of crack-microstructure interactions, while DCB
and CT tests, along with I tests, are most amenable to such observations. NB
tests using the same or similar test beams as for flexure strength are readily used
at high temperatures but are less amenable to in situ crack-microstructural obser-
vations and may present serious uncertainties in the nature of the crack character
involved. Sufficiently fine notches for forming a sharp crack at the notch root has
been identified in finer grain alumina bodies [2, 12] but not other bodies, e.g.
there is still some uncertainty even in fine grain Si3 N4 [13]. Less investigated is
whether cracks from the notch are of the assumed slit nature on which the NB
test is based. Fractography has shown significant deviations in NB toughnesses
values due to failure from ∼ half penny rather than the assumed slit cracks, de-
spite being done in materials that should be ideal for such tests (i.e. ZrO2 single
crystals [14] and especially a silicate glass [9]). Residual stresses from indents,
which depend on indent load and type (mainly Vickers versus Knoop), and
whether the indents are ground off (which can raise issues of the nature of the re-
sulting crack) can be an issue for indentation tests.
Recognizing the above issues, variations, and uncertainties, it is essential to
gain further understanding of crack propagation and its microstructural dependence,](https://image.slidesharecdn.com/mechanical-properties-of-ceramics-and-composites-120303143122-phpapp01/85/Mechanical-properties-of-ceramics-and-composites-46-320.jpg)
![46 Chapter 2
in which case differences between the various tests can become a tool to enhance
this understanding. The first of three needs is intercomparison of several tests on the
same bodies, instead of only one test (often on materials of limited or no mi-
crostructural characterization). Second is much broader comparison of the mi-
crostructural dependence of toughness and tensile strength, i.e. measuring both, not
just toughness. Third is more evaluation of the resultant fracture surfaces, especially
where there are test variations for which a few studies have noted significant test
and microstructural [15] deviations.
Observations of grain structure dependence of crack bridging in the crack
wake zone (i.e. behind the crack front) are important but require more attention
[16]. Thus they have typically been made close to the intersection of a free ma-
chined surface with large cracks arbitrarily introduced into the samples that were
propagated at limited, mostly unknown, velocities and then arrested for observa-
tion. This is in contrast to cracks for normal tensile failure from the most serious
defect, propagated at an accelerating, rather than an arresting, velocity, mostly
into the sample bulk, not primarily along the specimen surface. Better quantifica-
tion of the bridging occurrences is needed, e.g. their frequency-density as a func-
tion of microstructure, surface finish, and crack velocity and size. Except for one
study using microradiography [6] (which qualitatively indicates some similar
crack complexities in the interior of samples as on the surface), and some optical
observations, many bridging observations are made in situ in a SEM precluding
environmental effects, which may be a factor. Bridging observations, though in-
voked in biaxial behavior, have been made mostly or exclusively under uniaxial
tensile stress and have been applied without consideration of crack geometry, de-
spite indications that crack geometry may be a factor [16]. Thus increased tough-
ness due to wake effects may scale with wake area, its rate of increase, or both,
possibly normalized, all of which depend on basic crack shape (Fig. 2.1). Simi-
larly, crack tip dependent processes, e.g. microcracking, crack branching (and
possibly some bridging) may depend on the periphery (L) of the crack tip, its rate
of increase (dL/dt), or both, again normalized by l/L. Such normalized values
again differ, e.g. are 0 for expected cracks in DCB and NB, but is (l/C)(dL/dt) for
some other ideal cracks, e.g. half penny cracks [17]. Recent analysis by Gilbert
et al. [18] indicated that bridging is independent of crack size, if bridging scales
wth crack area, but neglects possible threshold crack area/grain size or crack pe-
riphery/grain size effects on the onset and growth of bridging.
B. Slow Crack Growth
Griffith’s theory of brittle fracture [19] (originally for silicate glasses) assumed
crack propagation started at a critical stress and rapidly accelerated to cata-
strophic failure. However, it is now known that slow crack growth (SCG) occurs
in a variety of ceramics [9, 20] and other materials such as intermetallic alu-](https://image.slidesharecdn.com/mechanical-properties-of-ceramics-and-composites-120303143122-phpapp01/85/Mechanical-properties-of-ceramics-and-composites-47-320.jpg)
![Grain Dependence of Microcracking, Crack Propagation 47
FIGURE 2.1 Idealized crack geometries for crack propagation and strength tests
and their rate of generating normalized crack wake area per unit crack area (and
of crack periphery, see text). Note (1) differences in wake area effects and (2)
(π/2)∈ is replaced by tan θ/2 for a triangular crack, but the net expression is the
same as for elliptical cracks of constant shape. (After Rice [17], published with
the permission of The Journal of the American Ceramic Society.)
minides of Ni and Fe [21]. Such SCG, which is also referred to by various terms
such as stress corrosion, static fatigue, or delayed failure, occurs prior to, or in
the absence of, catastrophic failure. Such growth results in reduced strengths
from those for the original crack sizes, but the resultant tensile strength (σ) is
generally consistent with those predicted by Griffith’s equation when the in-
crease of crack-flaw size c is accounted for [9, 21–22] i.e.
σ = YKIC(c)-1/2 (2.2)
where Y = a geometrical factor to account for flaw shape, orientation, and location.
While there are still uncertainties about SCG, some of which concern its
microstructural dependence as discussed later for grain and particle effects, and
elsewhere for porosity effects (Chap. 4 of Ref. 5), the overall mechanisms and
nature of the process are understood, at least for species that effect crack propa-
gation at and near room temperature [10, 20], the focus of this chapter. (More](https://image.slidesharecdn.com/mechanical-properties-of-ceramics-and-composites-120303143122-phpapp01/85/Mechanical-properties-of-ceramics-and-composites-48-320.jpg)
![48 Chapter 2
limited data on SCG due to active species at higher temperatures, e.g. of molten
aluminum, are discussed in Chap. 6.) Thus SCG is an important mechanism of
crack propagation, much of it at orders of magnitude lower crack velocities than
those associated with initiation of catastrophic failure (Fig. 2.2). SCG occurs as a
result of weakening and failure of stressed atomic bonds at crack tips due to in-
teractions with active environmental species at lower stresses than in the absence
of such species. While water is one of the most active and prevalent species for
SCG in many materials, there are other species such as NH4 and hydrazine that
can be active with some of the same, as well as different, materials susceptible to
effects of H2O [20]. Details of chemical interactions at the crack tip may vary,
since crack growth entails some balance between crack tip sharpening and blunt-
ing via local corrosion. Bulk chemical corrosion may also lower strengths, but
FIGURE 2.2 Schematic of log crack velocity versus stress intensity for environ-
mentally driven slow crack growth (SCG). Upper and lower curves represent re-
spectively maximum and more dilute concentration of the active environmental
species, often a liquid, such as H2O. The three main stages or regions of SCG,
starting from the lowest crack velocity, are controlled by (I) the reaction rate of the
active species and crack tip bonds, (II) diffusion of the active species down the
crack to its tip, and (III) effects of the active species dielectric properties on elec-
trostatic interaction of bonds at the crack tip. Eq. (2.3) is used for stage I where
the crack spends its greatest time (above a possible limiting stress intensity, K0,
below which no environmental effect is observed, indicated mainly in soda lime
glasses). Though experimental variations occur, the slope (n) is assumed to be
constant, characterizing the process with curves for different concentrations, be-
ing differentiated mainly or exclusively by A [Eq. (2.3)].](https://image.slidesharecdn.com/mechanical-properties-of-ceramics-and-composites-120303143122-phpapp01/85/Mechanical-properties-of-ceramics-and-composites-49-320.jpg)
![Grain Dependence of Microcracking, Crack Propagation 49
due to other mechanisms, e.g. corrosion often occurs when SCG does not and
vice versa.
SCG measurements, e.g. by DCB and DT tests, are typically characterized
by region I crack velocity (v) versus stress intensity (K) portion of the crack
growth (Fig. 2.2), per the most common expression for this:
v = AKn (2.3)
where A = a constant of proportionality and n = the slope, since stage I growth
normally entails the longest time of the growth process. Attention is com-
monly focused on the exponent n as a characterization of SCG, since the para-
meter A changes with concentration of the active species at the crack tip, but n
is generally assumed independent of concentration and reflects, and is experi-
mentally found to be approximately so. Two other tests, dynamic fatigue (DF)
and delayed failure, measure respectively strength as a function of stressing
rate and the time to tensile (typically flexure) failure as a function of constant
loads applied to various specimen sets. Slower loading rates and longer times
of loading (at lower loads) allow more slow crack growth and hence lower
strengths, and calculation of n values. Indentation induced flaws are used, es-
pecially in DF tests, to give a more uniform and identifiable starting flaw pop-
ulation. Details of possible effects of crack sizes (e.g. including greater
possible effects of residual surface and indent stresses for smaller cracks), mi-
crostructural variations, and test factors such as inadvertently using some data
points from stage IA or II in calculating n values have received limited atten-
tion but are possible factors in the scatter of n values. SCG and fast fracture
are shown to be typically via respectively intergranular and transgranular
fracture in polycrystals [23, 24] (Figures 2.5, 2.6), and grain size dependence
of n is indicated (Fig. 2.8).
C. Occurrence and Character of Microcracking
Microcracking occurs due to microstructural mismatch strains, most commonly
from differential expansion (e.g. on cooling from processing) between (1) adja-
cent grains of noncubic phases having inherent thermal expansion anisotropy
(TEA) as a function of crystal direction or (2) particles and a surrounding matrix
of different composition and thermal expansions [25–34]. Phase transforma-
tions, e.g. the tetragonal to monoclinic transformation of ZrO2, can also cause
similar microcracking, as can other sources of strain differences between grains
as well as grain clusters or colonies. Strain differences due to elastic anisotropy
(EA, amplifying applied stresses in cubic and noncubic materials, as well as
TEA stresses in the latter) or elastic differences between particles and a matrix
can also contribute to such microcracking [25].
Regardless of the source of microcracking, it generally has a basic mi-](https://image.slidesharecdn.com/mechanical-properties-of-ceramics-and-composites-120303143122-phpapp01/85/Mechanical-properties-of-ceramics-and-composites-50-320.jpg)
![50 Chapter 2
crostructural dependence in that it does not occur until a critical size, GS, which
depends on local properties [25–34] per expressions of the following nature:
GS ∼ 9γ[E(∆∈)2]-1 (2.4)
where γ = the local fracture energy pertinent to the microcracking (e.g. grain
boundary or single crystal values depending on whether the microcracks are re-
spectively inter- or transgranular), E = Young’s modulus, and ∆∈ = the mismatch
strain. Strains derived from differences in thermal expansion (∆α) between two
grains are ∆∈ = (∆α)(∆T), where ∆T = the temperature difference between the on-
set of stress buildup (i.e. where stress relief is no longer possible, often ∼ 1200°C)
and the temperature where the microcracks are formed (often > 22°C). As grain
sizes increase beyond GS for a specific material, the number and size of microc-
racks increases until the process saturates, e.g. due to reduced body stiffness.
Different derivations of Eq. 2.4 (mostly from two-dimensional models)
give its functional form with similar numerical values to 9, as does the one sim-
ple but reasonable three-dimensional model [29]. The latter equates a volume
source of strain energy (e.g. about 1.5 to 2 times the grain or particle diameter)
with a surface sink for that energy due to fracture around or through most or all
of the grain. More detailed analysis shows somewhat more severe microcracking
in three-versus two-dimensional models and differing effects of the specific
character of the grain junctions [34]. Both grain shape and the location and ex-
tent of microcracking affect the process. While intergranular cracks about the
size of the grains causing them are assumed and observed, transgranular cracks
can frequently occur, especially at larger G, as is noted later.
Equation (2.4) does not directly address possible environmental effects on
microcracking but is probably consistent with them, e.g. by reducing the γ value.
This is important, since there is evidence that microcracking can depend on envi-
ronmental effects, as is shown by microcracking in various HfO2 bodies not
commencing until moisture was present, and taking a few days to saturate [35,
36]. Such effects (also seen in ceramic composites, Chap. 8) are probably vari-
able due to differing (often limited) degrees of connectivity of microcracks to
provide paths into the bulk of the body, but connected porosity may provide
more access for environmental species even at limited porosity levels.
Microcrack observations on polished or fracture surfaces are uncertain
because of effects of the free surface on the occurrence and character of micro-
cracks intersecting such surfaces. Neutron scattering [37], and more commonly
following the progressive increase of microcracking via elastic moduli and
electrical or thermal conductivity measurements (and the hysteresis of these
changes with temperature cycling), can provide valuable microcrack characteri-
zation (Ref. 5, Chaps. 4 and 10), as can effects on fracture toughness and
acoustic emission, which are discussed in subsequent sections. Tensile (and also
compressive) stresses applied to a sample before or during testing can also be](https://image.slidesharecdn.com/mechanical-properties-of-ceramics-and-composites-120303143122-phpapp01/85/Mechanical-properties-of-ceramics-and-composites-51-320.jpg)
![Grain Dependence of Microcracking, Crack Propagation 51
important in microcracking and whether it occurs throughout the body, locally
in conjunction with propagation of a macrocrack, or combinations of these.
Modeling indicates that microcracking in conjunction with macrocracking com-
mences when G ∼ 0.4GS [32, 33].
The relevance of microcracking to this book arises from its occurrence de-
pending on G per Eq. (2.4) and the resultant G dependence of properties. Thus mi-
crocracks introduce some grain size dependence to thermal expansion (normally
independent of grain size, Figure 7.10B of Ref. 5) [38] and to electrical and thermal
conductivities (also often independent of grain size, especially above room temper-
ature), as well as on mechanical properties. Effects of microcracking on fracture en-
ergy and toughness are a focus of this chapter, while tensile and compressive
strengths, hardness, wear, and erosion, are discussed (to the extent that data exists)
respectively in the next and subsequent chapters. Microcracking may also have
broader applicability as a mechanism of crack propagation, e.g. a qualitative mech-
anism to explain fracture mode changing from mainly intergranular at finer G to
mainly transgranular at larger grain sizes (Ref. 5, Fig. 2.3) [39, 40]. A quantitative
two-dimensional model of fracture mode has also been proposed by Tatami et al.
[41], which provides some guidance. But further development is needed.
1
2
FIGURE 2.3 Schematic of a possible microcrack mechanism of intergranular frac-
ture. Crack tip stress concentrations may cause fracturing of grain boundary facets
at and closely ahead of the crack (see 1 above), which are then linked to the main
crack via cracking of a previously uncracked boundary (see 2 above). This favors
intergranular fracture at finer grain sizes, since the stress concentrations are higher
over boundary facets closer to the crack tip, while larger grains have lower stresses
on boundary facets because of their inherent greater distance from the crack tip.
(After Rice [39], published with the permission of the ASTM.)](https://image.slidesharecdn.com/mechanical-properties-of-ceramics-and-composites-120303143122-phpapp01/85/Mechanical-properties-of-ceramics-and-composites-52-320.jpg)
![52 Chapter 2
D. Microcracking and Wake Bridging Effects on
Crack Propagation and Toughness
A few models have been developed to explain the often substantial grain size de-
pendence of fracture energy and toughness found with large crack tests of some
noncubic materials (Fig. 2.16) which were first attributed to microcracking. Fu
and Evans [33] presented a model (later updated [42]) that at least semiquantita-
tively explained such noncubic fracture toughness–grain size data. Rice and
Freiman [43] derived the following equation for microcracking effects on frac-
ture energy (γm) in noncubic materials based on competition between increased
energy requirements from microcrack formation ahead of the main crack versus
reduced energy requirements for crack advance by linking with microcracks as:
γm = M(∆∈)[(9E γbG)1/2 - ∆∈EG] (2.5)
where M = a proportionality factor, e.g. ∼ 3, ∆∈ = the mean strain mismatch be-
tween grains, γb = the grain boundary fracture energy (assuming intergranular
microcracking), and E = the local average (often the body) Young’s modulus.
This model gives the maximum increase in fracture energy (hence also fracture
toughness) occurring at G = (1/4)GS, independent of M. This and other microc-
rack models based on more rigorous mechanics [44–47] were developed based
on microcracks forming at or somewhat ahead of the main crack. A model
proposing that microcracks occurred mainly in two lobes extending somewhat
ahead of the main crack, one well above the main crack plane and one well be-
low it [44] (Fig. 8.2A) has not been supported by observations [48–50] and has
been abandoned. However, the cessation of most study of microcracking, espe-
cially at and ahead of the main crack tip due to the focus on R-curve and related
wake effects, as discussed later, is premature.
The shift to a focus on crack wake or R-curve effects was driven by obser-
vations of variable toughness increases with increasing crack propagation (then
plateauing after propagation of up to 5–10 mm in typical toughness tests), the
essence of R-curve effects. These occur with transformation toughening or with
crack bridging in a number of, especially, larger grain noncubic, ceramics as the
extent, typically the length, of the macrocrack increases. Wake effects refer to
phenomena found in the region behind the tip of a propagating crack (Fig. 8.2B,
typically substantially larger than natural flaws), i.e. in the region through which
the crack has propagated. That R-curve effects are due to wake effects was
clearly shown by the disappearance of increased toughness when the wake re-
gion was removed [51], as is discussed later. Bridging refers to portions of, com-
plete, or multiple, grains left connecting the two sides of a crack in regions
through which it has propagated (Fig. 2.4). However, as noted earlier, there are
critical gaps in the data and tests, in particular the onset and extent of such ef-
fects at smaller crack sizes, especially of natural failure causing flaws and sur-](https://image.slidesharecdn.com/mechanical-properties-of-ceramics-and-composites-120303143122-phpapp01/85/Mechanical-properties-of-ceramics-and-composites-53-320.jpg)
![Grain Dependence of Microcracking, Crack Propagation 53
FIGURE 2.4 Examples of crack bridging and related complexity in the wake re-
gion, (A) and (B) Microradiographs of fused alumina refractory (G ∼ 50–2000 µm)
showing preexisting microcracks, large ∼ spherical pores, and crack tortuosity.
(C) Microradiograph of dense MgO (mixed G ∼ 25–50 µm) showing greater crack
tortuosity attributed to heterogeneous grain structure (corroborated by SEM ex-
amination). (D) In situ SEM test of dense alumina (G ∼ 30–50 µm) with an as-fired
surface; note the multigrain nature of the isolated crack branch-bridge (∼ photo
center). (E) In situ SEM test of dense alumina (Lucalox) with an as-fired surface
showing a fairly isolated multigrain bridge having substantial cracking (After Wu
et al. [6], published with the permission of the ASTM.)](https://image.slidesharecdn.com/mechanical-properties-of-ceramics-and-composites-120303143122-phpapp01/85/Mechanical-properties-of-ceramics-and-composites-54-320.jpg)
![54 Chapter 2
face and environmental limitations of most observations, e.g. in situ in a SEM [6,
49, 50, 52–55] and along cracks from indents. Recent alumina testing by Tandon
and Faber [56] showed a substantial strain rate dependence of toughness-type
tests, indicating that the increased toughness can have substantial dependence on
environmental effect, i.e. SCG of microcracks, as is discussed further later.
Several investigators have developed various crack bridging models, often
focused more on mechanics of the process and less on specific microstructural
effects, but some have explicitly addressed effects of grain or particle sizes and
volume fractions of these involved, e.g. Refs. 57–59. Most treat bridging ele-
ments as uniform in character and spatial distribution, often require iterative so-
lutions, and depend on adjustable parameters often obtained by data fitting
which is often not precise. Typically, crack tip shielding is assumed, with some
models noting that the process starts with microcrack formation, but that fric-
tional pullout of bridges is an important factor as shown experimentally, and by
simpler order of magnitude models (Sec. III.G).
Before reviewing grain structure dependence in detail it is again important
to note that fracture toughness and strength behavior must be correlated, as is
done elsewhere [5, 11, 60] and here in this book, since there are often major in-
consistencies in the grain size dependence of these two properties. Similar dis-
crepancies, which will be shown for ceramic composites and have been
previously shown for effects of porosity [5], are critical in designing and using
ceramics where fracture is an important concern. They are a reminder of the im-
portance of measuring both strength and toughness (preferably by more than one
test, especially for toughness), instead of a single measurement, as has unfortu-
nately become common, e.g. via indentation, assuming, but not showing, that
strengths will show similar trends with composition, microstructure, etc. Grain
shape effects have been considered a limited amount (mainly in conjunction with
bridging), as have grain orientation effects (commonly associated with grain
elongation). Global effects of grain orientation on fracture toughness should gen-
erally parallel those of E, since, per Eq. (2.1), KIC and E as well as E and γ are
closely related [61], as long as fracture is a simple elastic process and there is no
flaw anisotropy, which occurs much more than is commonly assumed.
III. GRAIN DEPENDENCE OF CRACK PROPAGATION
A. Grain Size Dependence of Fracture Mode
A detailed review by Rice [62] showed that the overall fracture mode of ceram-
ics, the average trend over a complete fracture surface, is for finer grain fracture
to be mainly, often exclusively, intergranular, then transition to mainly, often ex-
clusively, transgranular fracture as grain size increases for a broad range of stress
conditions. The more limited data for nonoxide ceramics is consistent with the](https://image.slidesharecdn.com/mechanical-properties-of-ceramics-and-composites-120303143122-phpapp01/85/Mechanical-properties-of-ceramics-and-composites-55-320.jpg)
![Grain Dependence of Microcracking, Crack Propagation 55
more extensive results for oxide ceramics (Fig. 2.5). The transition between in-
ter- and transgranular fracture at finer grain sizes is often completed by the time
grain sizes have reached 1 to several microns, but it may not be completed till
larger grain sizes. This transition is seen not only between different grain size
bodies but also as a function of the grain distribution on a given fracture where
its grain size range straddles much or all of the range of the transition found for
bodies of different average grain sizes (Fig. 1.1).
The first two of three factors besides higher temperatures that can shift the
transition to transgranular fracture to larger grain sizes are grain boundary
phases and porosity These are probably factors in intergranular fracture often not
beginning till G ∼ 1 or so microns, since obtaining finer grain sizes typically en-
tails lower processing temperatures that may leave residual boundary impurities
and porosity that enhance intergranular fracture. Porosity effects are important
when there is substantial boundary coverage by pores on the scale of, or smaller
than, the grains [5]. Boundary phases, important examples of which are those
from oxide densification aids for AlN, Si3N4, and SiC, commonly play an impor-
tant role in extending intergranular fracture by themselves and in conjunction
FIGURE 2.5 Trans- and intergranular fracture of oxide ceramics versus gram
size. Note that most materials have mainly transgranular fracture, except at finer
grain sizes, and, at least for some materials, at large (Al2O3 here) and very large
grain sizes (ZrO2 here). Very large G for Y2O3 and ZrO2 are from fused ingots. (Af-
ter Rice [62], published with the permission of the American Ceramic Society.)](https://image.slidesharecdn.com/mechanical-properties-of-ceramics-and-composites-120303143122-phpapp01/85/Mechanical-properties-of-ceramics-and-composites-56-320.jpg)
![56 Chapter 2
with the third source of shifting the transition to larger G, namely SCG. Thus
while the transition between inter- and transgranular fracture is typically shifted
to larger grain sizes with SCG in the absence of boundary phases, such phases
can cause SCG, shift the transition to larger grain sizes, or both, as is discussed
in the next section.
A mechanism of intergranular fracture has been proposed based on micro-
cracking of grain boundary facets at, and just ahead of, the macrocrack tip (Fig.
2.3), which then connects with them as a mechanism of its advance. Such micro-
cracking should be more extensive at finer grain sizes due to higher net stress
concentrations across smaller grain facets at and close to the crack tip, and less
as grain size increases. TEA stresses, which occur only in noncubic materials,
are independent of, but can add to the, applied stresses, extending the range of
microcracking. EA, which occurs in both cubic and noncubic materials, locally
alters the applied and TEA stresses, so its effects on microcracking clearly drop
off significantly as a function of distance from the crack tip. The two-dimen-
sional model of Tatami et al. [41] also provides an explanation for the
inter–transgranular fracture transition but does not account for TEA and EA,
which are probably basic reasons why the predictions are inconsistent with some
increased intergranular fracture trends at intermediate and larger grains (dis-
cussed below).
Partial to complete transition back to intergranular fracture occurs at
larger, often very large, grain sizes in at least some ceramics. Though there is of-
ten substantial variation, there is a common trend for some increase in intergran-
ular fracture of alumina as grain size increases at larger grain sizes (Fig. 2.5).
This contrary trend in the normal G range versus other common ceramics is also
indicated in TiB2 [62], suggesting that the substantial TEA in both these materi-
als is a factor. This is supported by the observations of transgranular fracture be-
ing the dominant mode at G ∼ 2 µm, diminishing to a minority mode by ∼ 20 µm
in less anisotropic MgTi2O5 [63], this transition being at even finer grain sizes in
more anisotropic Fe2TiO5 [26, 27]. Thus the decrease in transgranular fracture
with increasing grain size in noncubic materials is attributed to increasing effects
of TEA on fracture. Such attribution to TEA effects is tentative, since the data-
base is limited, and there are some potentially inconsistent observations; B4C,
with nearly identical TEA as Al2O3 [64] retains transgranular fracture to at least
G ∼ 200 µm. However, this may be associated with the extensive twinning that is
commonly indicated in B4C, especially in larger grains.
Transitioning back to primarily intergranular fracture is also indicated in
cubic materials, but at much larger than normal grain sizes [62]. Thus polycrys-
talline ingots from skull melting of CaO, MgO, and ZrO2 (Figure 1.7) show pro-
gressively increasing intergranular separation in the order listed as the grain
diameters increase typically to 1 to several centimeters. Elastic anisotropies of
these materials, respectively ∼ 0, 2+, and 6–10% at room temperature, all in-](https://image.slidesharecdn.com/mechanical-properties-of-ceramics-and-composites-120303143122-phpapp01/85/Mechanical-properties-of-ceramics-and-composites-57-320.jpg)
![Grain Dependence of Microcracking, Crack Propagation 57
crease as temperature increases [65], i.e. are higher where intergranular cracking
is likely to initiate. (Note that at ∼ 8% EA the maximum-to-minimum E ratio is
2.) This correlation of intergranular fracture at very large grain sizes to EA is
consistent with and supports similar TEA effects, but further evaluation is neces-
sary. Varying combinations of TEA and EA effects is probably an important fac-
tor in variations in fracture mode, e.g. between TiB2 and Al2O3 (and other related
behavior).
B. Grain Dependence of Slow Crack Growth and
Other Environmental Effects
While only a few key studies of slow crack growth directly address its grain de-
pendence, these and other data clearly show that grains frequently can have sub-
stantial effect on slow crack growth. Consider first a comparison of single crystal
and polycrystalline data on the same material, with a key case being MgO.
Shockey and Groves’s [66] DCB tests showed that there was no SCG, i.e. water
vapor had no effect, on {100} fracture (cleavage) of MgO crystals; in fact, tests
in liquid water increased toughness by ∼ 30%. They correlated increased tough-
ness with increased fracture surface roughness [66, 67] but did not associate the
increased roughness with enhanced dislocation activity. Freiman and McKinney
[68] also found no SCG in DCB tests of MgO crystals for {100} or {110} cleav-
age. In contrast to no SCG in MgO crystals, Rhodes et al. [69] showed SCG oc-
curred in dense polycrystalline MgO, but by intergranular fracture, which
appeared to be associated with grain boundary impurities (in bodies with G ∼
26–46 µm). Little or no SCG occurred in the highest purity (∼99.98%), largest
grain body, but SCG clearly occurred in bodies with higher impurity content (to
∼ 0.4%), much of which was at grain boundaries, e.g. single or mixed oxides of
Ca, Na, and Si (typical of most high-purity MgO powders), as well as residual Li
and F in bodies made with LiF additions.
Grain boundaries allowing the occurrence of SCG via even very limited
levels of grain boundary phases in materials that have no intrinsic susceptabiliy
to environmentally driven SCG were also shown in a study of Si3N4 [70] and a
review of fracture mode in ceramics [62]. These showed nonoxides commonly
made with oxide additions leaving a few percent residual oxide-based grain
boundary phases, e.g. SiC (+Al2O3), AlN (+CaO or Y2O3), and Si3N4 (+MgO,
Al2O3, Y2O3, etc.) showed SCG due to H2O via predominant to exclusive inter-
granular fracture. On the other hand, bodies made without such additives, e.g.
CVD SiC or Si3N4, and RSSN, or SiC made with B+C or B4C additions, showed
no SCG. Further, tests of Si3N4 bodies with oxide additions also often showed a
crack size dependence of SCG, i.e. bodies with oxide additives commonly
showed delayed failure, hence SCG, with normal strength controlling flaws, but
not in larger scale crack, e.g. DCB or DT, tests. In some cases, large cracks](https://image.slidesharecdn.com/mechanical-properties-of-ceramics-and-composites-120303143122-phpapp01/85/Mechanical-properties-of-ceramics-and-composites-58-320.jpg)
![58 Chapter 2
showed no SCG, and in other cases they showed evidence of some initial, lim-
ited, erratic SCG, which then ceased. This significant difference as a function of
crack size was attributed to incomplete second-phase coverage of boundaries to
provide a sufficiently continuous boundary phase path for SCG with larger
cracks. However, many such bodies should have sufficient contiguity of bound-
aries with adequate second-phase content for SCG along the much smaller
crack fronts to allow sufficient crack growth from natural flaws in many de-
layed failure tests. Thus SCG due to H2O could occur with small flaws because
of the limited number of grain boundaries needed with sufficient second-phase
content balanced by the significant number of small flaws, while with much
larger cracks, regions of insufficient boundary oxide phase were frequently en-
countered either initially or with limited, erratic propagation of the large crack.
This evaluation implies that strength losses in delayed failure of such nonoxides
made with oxide additions should be limited when cracks grow to sizes where
sufficient contiguity of boundary phases no longer occurs. Nonoxides made
without oxide additions, but having some oxide contamination, may also show
some, probably variable, SCG, due to limited or irregular distribution of the ox-
ide contamination, e.g. as indicated by limited, variable SCG in materials such
as TiB2 and B4C.
While intergranular fracture via SCG may often occur due to boundary
phases that are susceptible to environmental SCG, such SCG fracture due to en-
vironment is also observed in materials that exhibit SCG in single crystal form,
e.g. Al2O3 and MgF2 [23, 24, 62, 71]. Thus while boundary phases can play an
important role in intergranular SCG, this may reflect other environmental and
microstructural effects. For example, some intergranular fracture may reflect
varying environmental effects of the range of crystal orientations required to ac-
commodate transgranular fracture in polycrystalline bodies, especially randomly
oriented ones; i.e. some intergranular SCG may simply reflect grains unfavor-
ably oriented for transgranular SCG.
An important aspect of intergranular SCG is that following catastrophic
fracture is often transgranular, i.e. SCG often shifts the transition to mainly or
exclusively transgranular fracture (Fig. 2.5) to larger G only over the SCG area.
This inter- to transgranular fracture transition with the change from SCG to fast
fracture often provides definition of the SCG region (Fig. 2.6). Particularly clear
occurrences of such inter- to transgranular transitions have been observed in
Al2O3, MgF2, and ZnSe [23, 24, 71]. However, at least one important deviation
from this, i.e. the reverse trend, has been observed by Beauchamp and Monroe
[52, 53], namely SCG via more transgranular fracture and fast fracture via more
intergranular fracture in a larger grain (∼ 35 µm, with less Ca at the grain bound-
aries) versus a finer grain (∼ 24 µm) Mn Zn ferrite (see also the note at the end of
this chapter). They also observed that crack velocity and the stress intensity for
crack growth initiation were dependent on prior history, as have a few others.](https://image.slidesharecdn.com/mechanical-properties-of-ceramics-and-composites-120303143122-phpapp01/85/Mechanical-properties-of-ceramics-and-composites-59-320.jpg)
![Grain Dependence of Microcracking, Crack Propagation 59
FIGURE 2.6 Example of the change from intergranular SCG to fast transgranu-
lar fracture in hot pressed alumina (∼ 2% porosity, strength 290 MPA). (A)
Lower magnification SEM showing fracture origin (bottom center). (B) and (C)
Higher magnification SEMs of respectively intergranular fracture due to SCG
and transgranular fracture adjoining this and for the rest of the fracture (After
Rice [71], published with the permission of the Journal of the American Ce-
ramic Society.)
Tests by Rice and Wu [72, 73] comparing the strengths of specimens in
air at 22°C versus in liquid nitrogen (-196°C, eliminating SCG with only a
modest change in strength due to a 2–4% increase in E with decreased tem-
perature) showed SCG in various materials. Single crystals of both stoichio-
metric MgAl2O4 (for {100} or {110} fracture) and cubic ZrO2 (+20 w/o Y2O3)](https://image.slidesharecdn.com/mechanical-properties-of-ceramics-and-composites-120303143122-phpapp01/85/Mechanical-properties-of-ceramics-and-composites-60-320.jpg)
![60 Chapter 2
both exhibited SCG, via respectively ∼ 30 ± 10% and ∼ 50% increased
strengths in liquid N2, while ZrO2 crystals partially stabilized with 5 w/o Y2O3
only increased strength 9%. However, DCB tests by Wu et al. [74, 75] of SCG
of stoichiometric MgAl2O4 crystals oriented for {110} <110> crack propaga-
tion instead showed a zigzag {100} fracture at lower crack velocities that
transitioned to the planned {110} <110> fracture at higher crack velocities
(Fig. 2.7). Similarly, DCB tests of other orientations, e.g. where (100) and
(110) or (111) planes were parallel to the specimen axes, but at different an-
gles to the specimen surfaces, always resulted in crack propagation on (100)
planes, despite this requiring 30% or more fracture area to be generated.
However, flexure tests of bars oriented for fracture on (100) or (110) planes
did so from machining flaws formed on these planes (including the typical
strength anisotropy as a function of machining direction relative to the stress
axis). Thus despite a strong preference for (100) fracture with large, low-ve-
locity cracks in DCB tests, flexure tests showed no significant preference of
(100) over (110) planes for formation of machining flaws and subsequent fail-
ure. Crack propagation studies of quartz crystals by Ball and Payne [76]
showed the opposite type of crack propagation variation on some fracture
planes, namely an increasing amplitude of zigzag crack propagation at high
crack veocities, due to mist and hackle formation as a precursor to crack
branching in quartz. Thus the spinel results show that important changes in
FIGURE 2.7 Change from {100} zigzag to planar {110} crack propagation in stoi-
chiometric MgAl2O4 crystals oriented for {110}<110> fracture in DCB SCG tests.
(A) Schematic of low-velocity fracture. (B) and (C) Lower magnification SEMs of
fractures with lower velocity (e.g. 2–50 m/s) crack propagation at the left and
higher velocity (including catastrophic) propagation to the right. (After Wu et al.
[74], published with the permission of the Journal of Materials Science.)](https://image.slidesharecdn.com/mechanical-properties-of-ceramics-and-composites-120303143122-phpapp01/85/Mechanical-properties-of-ceramics-and-composites-61-320.jpg)
![Grain Dependence of Microcracking, Crack Propagation 61
crack propagation, and thus presumably in fracture toughness, can occur as
crack velocity changes.
The above tests at -196 versus 22°C of polycrystalline cubic ZrO2 (6.5
mol-% Y2O3 bodies, G ∼ 20 µm) also showed that SCG with the same or very
similar strength increases as the cubic stabilized crystal specimens. Polycrys-
talline bodies of stoichiometric MgAl2O4 with the same surface finishing as the
above MgAl2O4 crystals, showed decreasing strength increases in liquid nitrogen
versus air at 22°C. Bodies with G ∼ 100 µm showed the same or similar strength
increases as the single crystals did, i.e. ∼ 35%. On the other hand, bodies with G
∼ 20, 8, and 3 µm gave respectively decreasing strength increases of 31%, 27%,
and 16%, i.e. the latter ∼ 1/2 the single crystal and large grain increases, indicat-
ing reduced SCG as grain size decreases (but still with predominant transgranu-
lar fracture) [72]. This G dependence is similar to that of alumina (Figure 8A).
Polycrystalline bodies of CeO2, Y2O3, and TiO2 (with 1 of 4 ∼1/4% oxide addi-
tions) having respective grain sizes of ∼ 20, ∼ 100, and 5–10 µm showed respec-
tive strength increases of ∼ 12%, ∼ 25%, and 40–75% [72]. All exhibited
predominant or exclusive transgranular fracture at the fracture origin (and else-
where), implying that SCG occurs in single crystals of these materials.
Similar strength tests of nonoxide materials in air (22°C) and liquid N2
corroborated and extended results, e.g. showing that very limited (e.g. 5%) or no
strength increase in liquid N2 occurred, indicating little or no SCG in ZrB, B4C,
TiC, ZrC, and Si3N4(CVD) bodies made without additives [73]. This was corrob-
orated by the predominate or exclusive transgranular fracture of grains (typically
20–50 µm) at the fracture origins and over the total fracture. Bodies such as TiB2,
SiC, and Si3N4 (commonly, especially the latter two, made with oxide additions)
exhibited some to substantial strength increase, hence SCG, with mixed to sub-
stantial intergranular fracture at origins, and often across the fracture. Similarly,
comparative tests of a silicate glass, and finer grain bodies of Al2O3, and MgF2
were consistent with other tests, i.e. substantial strength increases in liquid N2
and mainly or exclusively intergranular fracture in the SCG region of polycrys-
talline fractures.
Two specific evaluations using v–K or dynamic fatigue (DF) tests showed
a grain size dependence of SCG in Al2O3. Gessing and Bradt [77] showed from
their own studies as well as from a literature survey that the crack growth expo-
nent, n [Eq. (2.3)] increased with decreasing alumina grain size (Fig. 2.8A), with
this trend being fitted by
n ∼ 10 + 225G-1 from K–v data and
n ∼ 20 + 114G-1 from DF data (2.6)
Becher and Ferber [78] subsequently corroborated this v–K data trend for Al2O3
using some of the same and some of their own DCB data (Figure 8A) for high
purity Al2O3 [79] e.g. giving n values of ≥ 110, 107, and 38 respectively for G =](https://image.slidesharecdn.com/mechanical-properties-of-ceramics-and-composites-120303143122-phpapp01/85/Mechanical-properties-of-ceramics-and-composites-62-320.jpg)
![62 Chapter 2
FIGURE 2.8 Grain size dependence of the exponential crack growth parameter
n[Eq. (2.3)] from difference v–K studies of: (A) alumina of Gessing and Bradt
[77] and Becher and Ferber [78, 79], and (B) BaTiO3 data from de With’s compi-
lation [86].
4, 5, and 25 µm, corroborating the above trend. However, n = 22 for a body with
bimodal grain size (averages ∼7 and 25 µm) indicates complexities of the G de-
pendence. Liang et al. [80] obtained n ∼ 26 and 78 for two aluminas with G ∼ 20
and 2 µm, consistent with the above data. Despite higher scatter, n values of
26–38 for various alumina bodies (G ∼ 3–8 µm) with various SiO2 contents,
while somewhat lower, are reasonably consistent with the trends of these more
extensive studies [81–83]. Data of Ferber and Brown (n: 36–42, G: not given)
[84] are also reasonably consistent with the above trends but clearly showed sig-
nificant effects of variations in the water due to additives (as do other studies).
However, data of Byrne et al. [85] for various commercial aluminas gave some
results inconsistent with the above trend of n to increase with decreasing grain
size (and again showed significant effects of pH). Some of these differences are
probably due to varying degrees of chemical attack, e.g. dissolution of some of
the boundary phase in some bodies (which is related to composition-pH effects
discussed by them). Such effects of dissolution are probably consistent with dif-
fering effects of crack sharpening versus crack blunting in stress corrosion.
Three other data sets indicate decreasing n values as G increases. De
With’s compilation of data on BaTiO3 for multilayer capacitors [86], though
scattered (probably reflecting differing compositions), also shows a decrease in
n values as grain size increases (Fig. 2.8B). Hecht et al.’s [87] data for various](https://image.slidesharecdn.com/mechanical-properties-of-ceramics-and-composites-120303143122-phpapp01/85/Mechanical-properties-of-ceramics-and-composites-63-320.jpg)
![Grain Dependence of Microcracking, Crack Propagation 63
toughened zirconia bodies (G ∼ 0.3–45 µm), though widely scattered, again
probably reflecting composition differences, also suggested a possible signifi-
cant increase in n values at finer grain sizes. Becher and Ferber [79] obtained n
values for two TiB2 bodies (G = 5 and 11 µm, hot pressed with 10 wt% Ni, re-
sulting in ∼ 1.3–1.5 wt% NiB) respectively of 150 and 62, which again indi-
cated a strong increase of n with decreasing grain size. Thus while there can be
significant effects of compositional details of the bodies and the corrosion
medium, there is substantial indication that n increases substantially with de-
creasing grain size, which is corroborated by results for strengths of MgAl2O4
in liquid nitrogen and in air at 22°C noted earlier. Therefore, much more atten-
tion to effects of grain size on SCG is needed than has been given. Considerably
more SCG data exists, but often with only one, often unspecified, grain size,
e.g. Yamade et al. [88] demonstrated SCG in dense sintered mullite (KIC ∼ 2
MPa·m1/2) due to H2O.
Gessing and Bradt [77] modeled the G dependence of n based on microc-
racking at the crack tip due to TEA stresses, i.e. in noncubic materials. Becher
and Ferber [78] also presented a model, again based on TEA stresses in noncu-
bic materials, but considering the superposition of TEA and applied stresses at
finer grain sizes, and crack shielding from wake effects at larger grain sizes.
However, the first and most fundamental of three points is that the focus on
grain facet fracture due to TEA stresses neglects the frequent significant trans-
granular fracture of many of the materials, particularly at intermediate grain
sizes, e.g. of aluminas at 5–20 µm, Figures 2.5 and 2.6. Second, the focus on
TEA stresses and associated microcracking of grain boundary facets implies ef-
fects only in noncubic materials of sufficiently high (but unspecified) TEA, i.e.
either neglecting, or assuming no, effects in cubic materials (as did much work
on crack bridging and shielding). However, though limited and not directly giv-
ing n values, the data for MgAl2O4 implies a similar grain size effect in cubic
materials (where bridging has also been found). Third, the form of Gessing and
Bradts’ model [Eq. (2.6)] would be consistent with a crack pinning-bowing
model (Figure 8.4), in this case crack pinning due to points of greater difficulty
of SCG. Pinning points could be grain boundary facets with low tensile or espe-
cially substantial compressive TEA stresses between them, or simply grains un-
favorably oriented for SCG around or through them. Such a model would be at
least partially focused on impediments to propagation of the macrocrack rather
than just on microcracks in advance of it and would be consistent with both in-
ter- and transgranular fracture and grain size effects in not only all noncubic
materials but also cubic ones.
The above indications of a G dependence of the slow crack growth para-
meter n are but one of many examples of the limited data directly showing sub-
stantial effects of G, hence putting much data not giving reasonable G
characterization in question. Both the probability of effects of G on n and the un-](https://image.slidesharecdn.com/mechanical-properties-of-ceramics-and-composites-120303143122-phpapp01/85/Mechanical-properties-of-ceramics-and-composites-64-320.jpg)
![64 Chapter 2
certainties and complexities this introduces with inadequate documentation of
results and microstructure is shown by work of Singh et al. [89]. They made dif-
fering measurements on two sintered β″ - alumina, both of which had mixtures
of finer and larger (often more tabular) grains, which gave substantially different
n values for the two bodies. For example, they obtained n values of 76 and 26 for
the two respective bodies via dynamic fatigue tests, again indicating an impor-
tant effect of grain structure like that noted earlier. However, there were two im-
portant variations indicating further complexities of test-grain structure
interactions. First, they obtained different n values, e.g. 26 and 16 respectively,
for the same larger G body via dynamic fatigue, depending on whether they used
a diametrally loaded ring or flexure testing. Second, and more serious, they ob-
tained an opposite trend, i.e. n = 64 and 96 respectively in the finer and coarser G
bodies by DCB/DT stress relaxations tests. Both discussion and modeling indi-
cated that these variations reflected combined effects of the crack-grain size and
the microstructural variation in the bodies.
Consider briefly grain size dependence of other environmental, especially
corrosion, effects on mechanical properties, which is a large and complex sub-
ject with limited attention to microstructural effects. Some TZP bodies partially
stabilized with Y2O3 are subject to serious degradation, beginning with attack
along grain boundaries and resultant microcracking from transformation of
tetragonal to monoclinic ZrO2, which lowers crack resistance and strength, and
in the extreme causes crumbling to a granular or powder character due to effects
of water (Fig. 2.9). Degradation increases with the activity of the water (to an
upper limit of ∼300–500°C), decreasing Y2O3 content, and increasing grain size
(with the latter two generally being inversely related) [90]. More recent data cor-
roborates this general trend but shows a more complex variation with G than a
simple monotonic change for a two m/o Y2O3 TZP over the limited G range
(∼0.5–1 µm) investigated [91]. Swab [92] has clearly outlined the composi-
tion–grain size variations of such degradation.
More generally, ceramics, while being more chemically inert, can be sub-
ject to a variety of other corrosive attacks at modest to high temperatures that re-
duce strengths at all subsequent testing temperatures. Such attack is commonly
most severe along grain boundaries, which introduces a grain size dependence
from intrinsic and extrinsic sources such as TEA stresses and frequent greater ac-
cumulation of more corrosion susceptible species at grain boundaries as G in-
creases. Some probable G dependence can also occur in lower, e.g. room,
temperature corrosion of materials susceptible to H2O attack, e.g. CaO and
MgO, where expansion of hydroxide products in pores or cracks causes failure
as observed in CaO single- and polycrystals (e.g. over periods of weeks to
months) [93] and in polycrystalline MgO (e.g. over years) [94, 95]. A G depen-
dence of strength after corrosion is expected from the G dependence of tensile
strength (Sec. 2.2).](https://image.slidesharecdn.com/mechanical-properties-of-ceramics-and-composites-120303143122-phpapp01/85/Mechanical-properties-of-ceramics-and-composites-65-320.jpg)
![Grain Dependence of Microcracking, Crack Propagation 65
FIGURE 2.9 Example of gross degradation of a commercial Y2O3 TZP ball in 100
psi steam exposure for 30 hours at 200°C. (Photo courtesy of Dr. T. Quadir.)
C. Grain Size and Other Dependence of Microcracking
Equations of the form of (2.2) with the same or similar numerical value give
reasonable estimates of grain sizes for the onset of spontaneous microcracking
due to microstructural stresses from phase transformation or TEA, as a function
of material (mostly local) properties (Fig. 2.10), as is shown by the studies of
Cleveland and Bradt [26, 27], Hunter et al. [35], Rice and Pohanka [29], and
Yamai and Ota [96, 97]. Some of these evaluations have explicitly or implicitly
used as a first approximation the γ/E ratio being ∼ constant, leaving Gs ∝ (∆∈)-2,
and for TEA-driven microcracking that Gs ∝ (∆α)-2, e.g. per a recent compila-
tion [96], since ∆T does not vary widely for most ceramics. Over a broad range
such approximations give reasonable estimates, but these estimates can often be
improved by using known or estimated values of E, γ, and ∆T and adjustments
of these. Note that Telle and Petzow’s designation of spontaneous microcrack-
ing at G ∼ 6 µm [98] is not consistent with the strength behavior they presented
(Figure 3.25), other TiB2 data, or the general trends of Fig. 2.10, but may be
consistent with decreasing toughness (Fig. 2.16) due to possible stress-induced
microcracking.](https://image.slidesharecdn.com/mechanical-properties-of-ceramics-and-composites-120303143122-phpapp01/85/Mechanical-properties-of-ceramics-and-composites-66-320.jpg)
![66 Chapter 2
FIGURE 2.10 Log–log plot of the grain size for the onset of spontaneous microc-
racking as a function of (∆∈)-2 for transformation (BaTiO3 and PbTiO3) and TEA
derived strains. Note the general, but imperfect, correlation over a broad range
and the use of the maximum minus either the minimum or the average grain
(crystal) strain mismatch, with the latter indicating better correlation, as is dis-
cussed in the text. (Data from Rice and Pohanka [29], and from Yamai and Ota
[96, 97], using respectively ∆T values of 1200 and 1000°C [though the latter may
be somewhat high].)
The first of two related sets of uncertainties in values used in Eq. (2.4) is
its derivation, which, as noted earlier, entails either a two-dimensional approxi-
mation with more precise mechanical analysis or in one case a more appropriate
three-dimensional model but with less precise mechanics analysis for idealized
grains. Neglecting the ideal grain character still leaves uncertainty in the equa-
tion, e.g. in the numerical factor of 9, and adds to the second set of uncertainties
of property values to use. Differing orientations of adjacent grains in quite
anisotropic materials may vary the appropriate local E value, and varying grain
shape may change the numerical factor. Greater uncertainty arises for γ, since](https://image.slidesharecdn.com/mechanical-properties-of-ceramics-and-composites-120303143122-phpapp01/85/Mechanical-properties-of-ceramics-and-composites-67-320.jpg)
![Grain Dependence of Microcracking, Crack Propagation 67
this depends on the nature of the microcrack, e.g. trans- or more commonly in-
tergranular fracture. The latter presents the greatest uncertainty, since γ for grain
boundary fracture, commonly approximated as ∼ 1/2 of the lowest grain cleav-
age energy, is quite dependent on the character of specific boundaries involved
and the resultant microcrack, e g. the number and spatial relation of grain
boundary facets it encompasses. As much or more uncertainty arises for ∆∈,
since it is commonly quite dependent on the specific crystallographic orienta-
tions of the grains involved, whether the strain mismatch arises from TEA or
from phase transformations. For TEA, the ∆T involved is often also uncertain
since the temperature where stresses start to build up (commonly assumed to be
∼1200°C, as used for all TEA-based calculations in Figure 10 except for the
phosphates) depends on material and cooling rates, and the temperatures where
the microcracks occur is often not known. Another uncertainty in ∆∈ is associ-
ated with statistically significant microcracking. The maximum strain mis-
match, e.g. due to the maximum–minimum single crystal thermal expansion
msmatch, is often used, but typically pertains to only ∼1 grain facet of a limited
number of grains. Limited microcracking probably commences when microc-
rack conditions are met with such a maximum grain (crystal) strain mismatch,
but more should occur when conditions are met for a strain mismatch of the
maximum minus the average grain (crystal) strain. Fig. 2.10 indicates better
correlation with the latter, which can vary (∆∈)-2 by a few, to nearly 10, fold, as
well as a deviation at larger grain sizes and related lower anisotropy; but more
evaluation is needed.
Equal or greater uncertainty is associated with reported or implied Gs val-
ues due in part to uncertainty in the measured grain size values, which as noted
earlier can be a factor of 2 (and involve the issue two- versus three- dimensional
G values, the latter appearing more pertinent). Greater uncertainty often accom-
panies direct microscopic observations of microcracks on, or close to, free
(mainly fracture) surfaces. Values from property measurements, e.g. expansion,
elastic moduli (or damping), and thermal or electrical conductivities, and their
temperature dependences and resultant hysteresis, are generally more valuable
and offer important additional information (Chap. 3, Sec. III.D, Chap. 10, Sec.
II.E, and Figure 9.3, Refs. 5,26–35,97,99). In particular, plotting of the tempera-
ture difference between the forming or opening of microcracks and their closing
versus the inverse square root of G, as shown by Case et al. [30], is particularly
effective. However, such information should be accompanied by data on grain
size and shape, their distributions in the body, and the degree and character of
preferred grain orientation. Of two bodies with the same average G, the one with
the wider grain size and shape distributions, or both, is likely to have more mi-
crocracks, provided there is random orientation.
A more comprehensive, but still incomplete, characterization of microcracks
and their effects is Tomaszewski’s [100] study of dense sintered Al2O3 (Fig. 2.11)](https://image.slidesharecdn.com/mechanical-properties-of-ceramics-and-composites-120303143122-phpapp01/85/Mechanical-properties-of-ceramics-and-composites-68-320.jpg)
![68 Chapter 2
FIGURE 2.11 Summary of Tomaszewski’s characterization of microcracks and re-
sultant properties in a dense sintered alumina as a function of grain size [100].
Note general decreases, except for maxima in KIC and microcrack density at G ∼
130 µm, and increasing microcrack length as G increases.
showing that while microcracks in finer G bodies were ∼5 times the grain size,
this reduced to ∼1.2 at G ∼470 µm. (These results for stress generated microc-
racks in alumina are in contrast to the limited data of those from spontaneous mi-
crocracking.) Qualitative data indicates that spontaneously formed microcracks
are more consistently similar in size to the grains. While the question of the ef-
fects of as-fired surfaces on such microcracking were not addressed, he showed
that the general fracture mode decreased from ∼ 85% intergranualar fracture at
the finest G to ∼5% at the largest G (i.e. generally consistent with Fig. 2.5).
However, the ∼95% intergranular microcracking at the finest G initially de-
creased faster, then less rapidly, than the general fracture mode. The net effect
was substantially more intergranular microcracking than for general fracture (i.e.
∼50 versus 5% respectively), but still with substantial transgranular microcrack-
ing over most of the G range. He also showed that microcrack densities reached
a maximum at G ∼ 130 µm. Calculations from his data indicate that the micro-
crack area per unit sample area reaches a maximum at this or larger G, e.g. ∼300 µm.](https://image.slidesharecdn.com/mechanical-properties-of-ceramics-and-composites-120303143122-phpapp01/85/Mechanical-properties-of-ceramics-and-composites-69-320.jpg)
![Grain Dependence of Microcracking, Crack Propagation 69
Quantitative data of Kirchner and Gruver [101] for TiO2 shows microcrack size
to average ∼1.5 to 2 times G, over the G range ∼5 to 150 µm; but much more
documentation is needed.
Two sets of potentially related observations are important. First, as noted
earlier, most observations of the cyclic change of microcrack dependent proper-
ties, while exhibiting hysteresis, are typically repeatable with multiple cycling.
However, while such behavior was shown in evaluations of most HfO2 bodies, it
ceased to be so in larger grain (∼17 µm) bodies, which showed serious progres-
sive degradation of elastic moduli with thermal cycling [35, 36]. This clearly im-
plied that microcracks no longer closed, or healed at such larger HfO2 grain
sizes, since such closure and healing are basic to the observed recovery of the
normal temperature dependence of properties in the absence of microcracking.
The second observation is that while microcracking is commonly intergranular,
some transgranular microcracking is observed, especially as grain size in a par-
ticular material increases sufficiently as found in TiO2 [29,101], and clearly
shown in 2ZrO2 · P2O5 bodies [95], e.g. at G to ∼200 µm in the former and ∼10 to
20 µm in the latter as well as in Al2O3 [99] (Fig. 2.11). Such transgranular micro-
cracking at larger (probably material dependent) grain sizes suggests an explana-
tion for the progressive degradation of larger grain microcracking bodies on
thermal cycling. While intergranular fracture results in well-defined fracture sur-
faces with potential for mating and possible healing due to sintering (especially
with some boundary phase), transgranular fracture often generates more com-
plex fracture surfaces that may be more difficult to close and heal. The occur-
rence of some transgranular microcracking at larger grain sizes may be
consistent with general fracture mode trends, though probably shifted due to the
TEA and other causes of the microcracking.
Another important aspect of microcracking is its occurrence due to the
combination of microstructural stresses from phase transformation or TEA with
applied stresses, either prior to or during measurement of crack propagation be-
havior. Limited investigations indicate that microcracks can be generated, en-
larged, or both in some bodies and tests, e.g. E measured in flexure strength
testing decreasing as G increased while dynamic measurements were indepen-
dent of G at ∼393 GPa [99]. In more anisotropic graphite, Brocklehurst’s review
[102] cited decreases in elastic moduli due to prior application of either a uniax-
ial tensile or compressive stress that varied with the microstructure and stress.
The moduli decreases increased nonlinearly, and sometimes irregularly, as the
stress level increased, e.g. reaching E reductions of > 30%, but could be fully or
partially recovered by subsequent treatments, especially annealing. Greater de-
creases may occur from compressive stressing (possibly in part because of the
greater stress levels achievable in compression) than with tensile stressing.
Other differences occur, e.g. density and thermal expansion reduced from ten-
sile, and increased from compressive, loading, and properties such as electrical](https://image.slidesharecdn.com/mechanical-properties-of-ceramics-and-composites-120303143122-phpapp01/85/Mechanical-properties-of-ceramics-and-composites-70-320.jpg)
![70 Chapter 2
conductivity are also affected, but strengths are often not significantly reduced.
Major sources of these complications in graphite are effects of grain and pore
parameters, e.g. microcracks originating and branching from, or terminating on,
pores have been reported [102, 103].
Consider now the case of introducing, or generating, more microcracks in
conjunction with propagation of a macrocrack. While the originally predicted
occurrence of microcrack formation in two lobes ahead of the crack tip signifi-
cantly above and below the macrocrack plane [44] is contrary to experimental
results, and attention has now been focused on wake region bridging, the issue of
some microcrack formation at or closely ahead of the macrocrack is not settled.
Ultrasonic probing around a stressed macrocrack by Swanson [49, 50] in both
granite and alumina samples showed microcracking being confined mainly in or
near the wake region of the macrocrack, mainly or exclusively associated with
bridging. However, while Hoagland et al.’s [48] results (Figure 4.5 of Ref. 5)
showed much wake microcracking, they also clearly showed considerable mi-
crocracking ahead of and around the macrocrack, much less in spatial extent and
location than first proposed, but more than indicated by Swanson. The extent to
which the sandstone porosity was a factor in this broader spatial distribution of
microcracks is unknown, but Hoagland et al.’s and other results [102–105]
showed that even quite limited porosity can play a significant role in some mi-
crocracking in conjunction with a macrocrack, indicating complex behavior that
is not fully understood. Additionally, even where most toughening occurs via
wake bridging, it appears that microcracks may initiate at or slightly ahead of the
macrocrack tip as precursors for bridges, so bridging evidence is also probable
evidence for microcracking. Acoustic emission, which is probably more sensi-
tive but is not widely used, is an indication of this (Sec. III.G). There may also be
contributions of other mechanisms such as crack deflection, branching, and tor-
tuosity (see Sec. IV.B of Chap. 8), depending on material and microstructural pa-
rameters as discussed for KIC–G dependence of materials such as Al2Ti2O5 with
extensive microcracking [104]. Lawn [106] theoretically considered crack tip
microcracking, concluding that there was a limited opportunity for microcrack-
ing ahead of the crack tip, but noted that this might be expanded by second phase
particles. This may imply some effects of porosity, though he did not address this
or extreme anisotropy, e.g. of graphite.
The first of five additional observations is Peck et al.’s [107] qualitative as-
sessment of crack propagation and fracture energy of rocks in their and other
studies. While they showed that porosity (and weak interface bonding) gave
lower fracture energies, as expected, higher fracture energies and greater dis-
tances of crack propagation for steady state fracture occurred when there was a
preexisting network of interconnecting microcracks (or when rock texture pro-
vided multiple, incipient fracture surfaces); but the highest fracture energies
were found in crystalline rocks without interconnected microcracks. Second, sig-](https://image.slidesharecdn.com/mechanical-properties-of-ceramics-and-composites-120303143122-phpapp01/85/Mechanical-properties-of-ceramics-and-composites-71-320.jpg)
![Grain Dependence of Microcracking, Crack Propagation 71
nificant maxima of fracture toughness versus grain size (Figures 2.16 and 2.17),
initially attributed to microcracking effects from TEA or from crystal structure
transformation (e.g. BaTiO3), have since been implied to be due to bridging.
Third, tests of bodies in which the microstructural stresses arise from phase
transformations that occur close to room temperature, e.g. BaTiO3, offer oppor-
tunities to verify the role of microstructural stresses by testing above and below
the transformation temperature. The fourth and related point is that in piezoelec-
tric and ferroelectric materials, electric fields can increase the grain boundary
stresses and microcracking (Sec. III.I). Fifth, as noted above and later, acoustic
emission can be an important tool for detecting and evaluating microcracking.
D. Grain Size Dependence of Fracture Toughness of
Cubic Ceramics
Though many studies of fracture toughness have been made with little or no
grain size characterization, there is considerable data on the grain size depen-
dence of fracture toughness. While there are uncertainties of test parameters such
as crack size effects, important data trends are seen from four previous reviews
[11, 60, 108, 109], especially the two most recent. This section addresses tough-
ness for cubic materials, particularly overall trends, and notes variations and
some of the known or indicated test differences and limitations. The following
section treats single-crystal toughnesses and the transition between them and
polycrystalline values for both cubic and noncubic ceramics. Section F addresses
the G dependence of noncubic ceramics, Sec. G, crack wake effects such as
bridging (which occur in cubic materials, and more often in noncubic ones) and
Sec. H, effects of preferred grain orientation, again mainly in noncubic ceramics.
The grain size dependence of fracture energy and toughness of cubic mate-
rials is generally simpler and apparently less prone to wide variations in compar-
ison to noncubic materials, but it is still subject to variations. The overall trend
for cubic ceramics is for limited dependence on grain size over the G ranges gen-
erally covered (e.g. a few to ∼100 µm, Figs. 2.12–2.14), but some, typically
modest, deviations from this are common and possibly universal. Thus most
MgO studies do not indicate a G dependence (Fig. 2.12), but this may reflect the
more limited G ranges, and numbers of different grain sizes covered; an earlier
compilation of data from 1 to 200 µm [110] indicated a possible limited maxi-
mum of fracture energy at intermediate G (e.g. 10–40 µm). (The low value at 1
µm reflects in part residual additive effects, since fine-grain MgO as hot pressed
with 1–2 wt% LiF had ∼1/2 the fracture energy as of material with similar grain
sizes annealed to remove residual LiF or MgO hot pressed without LiF; both of
the latter show substantially more transgranular fracture than material as-hot
pressed with LiF [110, l21]). MgO with limited porosity, e.g. < 1 to ∼4% poros-
ity, showed KIC increasing ∼3-fold from values for dense bodies, with much of](https://image.slidesharecdn.com/mechanical-properties-of-ceramics-and-composites-120303143122-phpapp01/85/Mechanical-properties-of-ceramics-and-composites-72-320.jpg)
![72 Chapter 2
FIGURE 2.12 Fracture toughness (KIC) versus average grain size (G) at 22°C for
various investigations of MgO (upper portion), Y2O3 (middle), and ZnS (lower por-
tion). Note (1) no clear G dependence of KIC for MgO with ∼ 0% porosity (P), but
for MgO with <0.1 to >1% porosity (solid circles), KIC clearly increased above P =
0 levels with increasing G as P decreases, shifting to a more intragranular poros-
ity [110, 111]; (2) some increases in toughness levels of MgO for 10% additions of
different (partly to fully soluble) oxides in MgO [112–115]; (3) similar maxima
trends, but different values for them for two of the three Y2O3 studies [116–118];
(4) the lower value (from indentation tests) for single crystals of Y2O3 [115]; values
for {100} fracture of MgO crystals are typically ∼ 1 MPa·m1/2 [118]; and (5) a clear
maximum for the CVD ZnS [120]. (After Rice [11], published with the permission
of the Journal of Materials Science.)
this limited porosity transitioning from inter- to intragranular locations as G in-
creased from ∼10 to 100 µm, which may reflect possible general effects either of
pore location or of slip associated with pores [11], consistent with dislocation ac-
tivity accompanying MgO fracture at modest temperatures (Sec. III.B). Simi-
larly, at first glance, no grain size dependence is shown for the fracture energy of
dense FeO being ∼ 7.5 J/m2 over the G range ∼10–90 µm [122], but there is a
probable 4–8% decrease as G increases. Two data points of Evans and Davidge
[123] for UO2 with G ∼8 and ∼ 30 µm had fracture energies of respectively ∼8 ±1](https://image.slidesharecdn.com/mechanical-properties-of-ceramics-and-composites-120303143122-phpapp01/85/Mechanical-properties-of-ceramics-and-composites-73-320.jpg)
![Grain Dependence of Microcracking, Crack Propagation 73
FIGURE 2.13 Fracture toughness versus average grain size at 22°C for various
indicated investigators for spinel and a ferrite. Upper portion: MgAl2O4 data of
Stuart et al. [124] and Rice et al. [109], all made without additives, except for a
low value at G = 100 µm for a body made with LiF additions. Note (1) the good
agreement of the two studies showing no clear intrinsic dependence on grain size
and (2) the value for fracture on either {100} or {110} single crystal planes G = ∞.
Lower portion: a soft (cubic) NiZn ferrite [125] showing some decrease in tough-
ness as G increases. (After Rice [11], published with the permission of the Jour-
nal of Materials Science.)
and ∼ 6 ±1 J/m2. Though some of this decrease may reflect differences in the lim-
ited porosity in the two bodies, some of it may be intrinsic.
Several data sets for cubic materials, commonly with no measurable
porosity and no densification aids, showed modest, but probably statistically sig-
nificant, toughness maxima at intermediate grain sizes. Thus all data sets for
Y2O3 [116–118] (though at substantially different grain sizes of ∼1 and ∼20 µm)
showed higher toughness at intermediate G as did CVD ZnS [120] at ∼1 µm, and
various BaTiO3 bodies indicate ∼ twice the finer and larger grain fracture energy
of ∼2.4 J/m2 at ∼40 µm [126–128] at 150°C where they are cubic. (A more defin-
itive maximum is shown in the noncubic state at this same G and corroborated](https://image.slidesharecdn.com/mechanical-properties-of-ceramics-and-composites-120303143122-phpapp01/85/Mechanical-properties-of-ceramics-and-composites-74-320.jpg)
![74 Chapter 2
by strength trends [129]. Data over a more limited G range (∼ 2–40 µm) for a
NiZn ferrite showed a decrease as G increased [125]. A significantly lower value
for large G MgAl2O4 made with LiF addition (which is apparently more difficult
to remove from MgAl2O4 than MgO) is reflected in the ∼100% intergranular
fracture versus the ∼100% transgranular fracture of material without LiF addi-
tions [11, 110]). Equally or more definitive is Niihara’s data for CVD β SiC giv-
ing a maximum at ∼1–2 µm [130], and Kodama and Miyoshi’s data for HIPed
polycarbosilane-derived ultrafine grain powder showed a pronounced maximum
at G ∼0.6 µm [131] (Fig. 2.14). An earlier compilation of SiC data [109], though
complicated by reflecting more noncubic, α, SiC (discussed below), also indi-
cated a possible decrease at larger grain sizes.
Thus, in summary, cubic, in contrast to noncubic, materials generally show
no G dependence of fracture energy and toughness, or modest decreases at finer,
or larger grain sizes, or both. These trends are indicated despite the variations in
test methods, especially between different investigators (e.g. for indentation
techniques). Extreme results reported for the fine grain SiC from HIPed polycar-
bosilane powder are unexplained. More broadly, the mechanism(s) for the com-
FIGURE 2.14 Fracture toughness (KIC) (and some corresponding flexure
strength) versus average grain size (G) at 22°C for α and β SiC from a previous
survey [60]. The data of Kodama and Miyoshi [131] is for polycarbosilane derived
SiC, Niihara [130] for CVD SiC, and Seshardi et al. [132] for sintered alpha SiC.
(After Rice [11], published with the permission of the Journal of Materials Sci-
ence.)](https://image.slidesharecdn.com/mechanical-properties-of-ceramics-and-composites-120303143122-phpapp01/85/Mechanical-properties-of-ceramics-and-composites-75-320.jpg)
![Grain Dependence of Microcracking, Crack Propagation 75
monly indicated KIC decrease at finer G are uncertain, but extrinsic effects com-
mon to preparing many fine-grain bodies may be a factor in some, possibly
many, of these results (Chap. 3, Sec. IV.A). Though also uncertain, the first of
two possible, not mutually exclusive, intrinsic mechanisms for decreasing tough-
ness at larger G is elastic anisotropy, which has similar effects to TEA in noncu-
bic materials [65]. Unfortunately EA data is often either uncertain or
nonexistent, so quantitatively testing is limited. The second intrinsic reason for
decreased toughness at larger grain sizes is the transition to single crystal or
grain boundary toughness, as is discussed in the next section.
E. Single Crystal/Grain Boundary-Polycrystalline
Fracture Toughness Transition
This section addresses single crystal and grain boundary toughnesses for cubic,
then noncubic, materials and their relation to typical polycrystalline values. Sin-
gle crystal fracture toughnesses are important to understanding mechanical fail-
ure of not only single crystal but also polycrystalline bodies, e.g. for
transgranular grain microcracking. Generally toughness of polycrystalline bod-
ies with normal, e.g. machining, flaw populations must transition to those of the
corresponding single crystal or grain boundary values as G increases to larger
sizes, as is noted above and discussed below and in Chap. 3. Further, polycrys-
talline toughnesses for any grain size with increasing preferred grain orientation
often begins to approach that of the corresponding single crystal orientation, pro-
vided bridging and other polycrystalline toughening mechanisms are not signifi-
cant. Grain boundary fracture toughnesses are pertinent to the broader case of
intergranular microcracking and are expected to be the toughness values that
large grain polycrystalline bodies will approach where intergranular failure is
dominant (Chap. 3, Sec. I.B).
Single crystal fracture toughnesses of greatest pertinence are those for
lower toughness cleavage or preferred fracture planes, since these control most
failure of single crystals and are dominant in most transgranular fracture; the
latter usually with varying degrees of mixed mode failure for the one or more
lower toughness crystal planes involved. Such single crystal values are invari-
ably substantially below those of polycrystalline bodies of the same material
and crystal structure and hence provide a general check on the probable validity
of limited data for single- or polycrystal values, especially where one or both
sets of data are limited. Table 2.1 summarizes much single crystal data and cor-
responding typical, usually finer grain, polycrystalline values. Again, note that
single crystal values approaching or exceeding lower polycrystalline values, or
lower polycrystalline values falling below single crystal values for preferred
fracture surfaces, should raise suspicion about the validity of one or both val-
ues. Thus, for example, values for YAG single crystals seem high, e.g. in view](https://image.slidesharecdn.com/mechanical-properties-of-ceramics-and-composites-120303143122-phpapp01/85/Mechanical-properties-of-ceramics-and-composites-76-320.jpg)
![76 Chapter 2
TABLE 2.1 Comparison of Ceramic Single Crystal and Polycrystalline Fracture
Toughnessesa
Material Typical Sxl Sxl KIC Pxl KIC
fracture (MPa·m1/2) (MPa·m1/2) Pxl fractureb
(A) Cubic Ceramics
MgO {100} cleavage 1 2 Mainly TGF
ThO2 {111} cleavage 0.6–1 1.1 Mainly TGF
Y2O3 {111} cleavage <0.9 1.3 Mainly TGF
ZrO2 Possibly {110} cleavagec 1.1–2.4 2.6 Mainly TGF
MgAl2O4 {100} and {110} cleavage 1 2 Mainly TGF
Y3Al5O12 {111} cleavage 2.2 1.7–3.1 Mainly TGF?
TiC {100} cleavage 1.2 3–4 Mainly TGF
CaF2 {111} cleavage 0.4 1.1 Mainly TGF
ZnSe {110} 0.3 0.9 Mainly TGF
Diamond {111} cleavage 2.9–4.1 5.3–13d Mainly TGF
(B) Noncubic Ceramics
Al2O3 Rhomb. & other nonbasal
fract. 1.5–2 3.5–4 Mixed IGF & TGF
β-Al2O3e Basal, (0001) 0.16 2.7–3.3 Mainly TGF
TiO2 {110} 0.8 2.5 Mainly TGF
SiC Probably (1010)or (1120)f 2 3–4 Mixed IGF & TGF
Si3N4g ? ∼1–1.5 4 Mainly TGF
Calcite ¯
{1011} 0.23 1 Mainly IGF?
a
Sxl = single crystal, Pxl = polycrystalline, KIC = fracture toughness (polycrystalline fracture
toughness generally in the absence of significant microcracking, wake, etc. effects)
b
Pxl fracture: typical or representative fracture mode, with TGF = transgranular fracture and
IGF = intergranular fracture.
c
While {111} cleavage may be expected due to the fluorite structure, cleavage is often on
{110} but may be variable, depending on stabilization, composition, and stoichiometry, e.g.
as indicated by indent crack complexities as reported by Pajares et al. [134].
d
Higher polycrystalline toughness is for metal bonded, sintered diamond [142].
e
In such extreme cases of a single very low toughness plane, other fracture planes are
more important, fracture normal to the basal plane gives KIC of 2 MPa·m1/2 [144].
f
Respectively first- and second-order prismatic cleavage (per private communication with P.
T. B. Shaffer).
g
CVD Si3N4, i.e. without densification aids and resultant grain boundary phases.
Source: Refs. 4, 11, 39, 40, 60, 76, 124, 133–150. See also Chap. 6, Figs. 1, 5, and 6.
of Pardavi-Horváth’s [151] values of two other garnets (GGG and CaGeGG) re-
spectively of 1.2 and 0.8 MPa·m1/2 for (111) fracture.
There is typically substantial anisotropy of fracture toughness in single
crystals of various crystal structures. However, except for materials of extreme
crystal anisotropy, i.e. noncubic materials with very platy structures such as mi-](https://image.slidesharecdn.com/mechanical-properties-of-ceramics-and-composites-120303143122-phpapp01/85/Mechanical-properties-of-ceramics-and-composites-77-320.jpg)
![Grain Dependence of Microcracking, Crack Propagation 77
cas, beta-aluminas, graphite, and hexagonal BN, there is no clear difference in
the anisotropy of single crystal toughnesses between cubic and noncubic materi-
als. Many crystals, whether of cubic or noncubic structures, have one signifi-
cantly preferred fracture surface, usually a cleavage plane, with {100} cleavage
in many NaCl structure materials being an example, e.g. in CaO and MgO, while
showing very limited cleavage on {110} planes, does cleave on {110} planes
only under conditions that are not fully understood. This is not surprising in view
of the elastic anisotropy of crystals and the relation of elastic moduli and tough-
ness. (Thus the comment by some that cubic ZrO2 has unusually anisotropic
toughness is partly true as well as misleading, since like its elastic moduli, it is
fairly anisotropic.) A good test for the primacy of a cleavage or fracture surface
is that cracks propagating on other planes will often branch onto the primary, i.e.
the lowest toughness, plane, but the reverse crack branching, i.e. from the pri-
mary to other planes, occurs only occasionally, if at all. Stoichiometric MgAl2O4
is unusual in having two cleavage planes of very similar toughnesses [73–76,
124] (Table 2.1). (MnZn ferrite approaches this similarity; see the note at the end
of this chapter.) Table 2.2 lists a few other crystals with two or three sets of
cleavage planes with similar toughnesses. See also Chap. 6, Sec. IV for addi-
tional single crystal toughness data.
Turning to the transition from single- to polycrystal fracture toughnesses,
this is seen as a natural consequence of grain sizes increasing to approach and
subsequently become larger than the strength controlling flaw. Thus fracture (en-
ergy and) toughness must decrease toward single crystal values for transgranular
fracture origins given the commonly significantly lower single crystal fracture
toughness for preferred single crystals fracture planes, e.g. by factors of 2–3
(Table 2.1, Fig. 2.15). Some mapping of such polycrystalline–single crystal tran-
sitions has been by DCB tests of bodies of increasing G and especially from frac-
tographic evaluations of larger grain, transgranular, polycrystalline fracture
origins [15, 70] (Fig. 2.15). For example, lower than expected DCB toughness
TABLE 2.2 Fracture Toughnesses for Different Preferred Fracture/Cleavage
Planes of Some Crystals with More Than One Such Planea
Crystal Structure Fracture/cleavage plane- KIC (MPa·m1/2)
Si Cubica (111) 0.8 (110), (100) 0.9–0.95
SiO2 Quartz ¯
{1120} 0.85–0.95 ¯
{1011} 0.85–1.0
KalSi3O8b Triclinic {110} 0.31 {001}, {010} 0.39
Be3Al2(SiO3)6c Hexagonal ¯
{1010} 0.2 ¯
{1120} 0.25
a
Diamond structure.
b
Microline feldspar.
c
beryl, which with green coloration, e.g. from Cr doping, is the precious gem emerald.
Source: Refs. 149, 151–155.](https://image.slidesharecdn.com/mechanical-properties-of-ceramics-and-composites-120303143122-phpapp01/85/Mechanical-properties-of-ceramics-and-composites-78-320.jpg)
![78 Chapter 2
FIGURE 2.15 Data on the single crystal to polycrystalline fracture toughnesses
transition as a function of flaw to grain size ratio [15, 62, 70]. Note different scales
for CVD Si3N4.
values were found to be associated with larger grains at the crack tip [15], show-
ing the utility of fractographic examination of toughness test specimens, not just
strength specimens or components. Indentation MgAl2O4 data of Sakai et al.
[156] is consistent with such a transition, as is single crystal data of Chen and
colleagues [152, 153] for two polycrystalline bodies, but with flaw sizes slightly
smaller than G. More recent evaluation of crack tip stresses [157] may be an al-
ternative approach to such evaluation. The level of polycrystalline fracture
toughnesses versus corresponding lower single crystal values must reflect the
range of single crystal values, especially the lower ones, but is impacted by two
factors. The first is the multiplicity of the sets of planes with low toughnesses. A
single, e.g. noncubic basal, fracture plane having only one member, while limit-
ing polycrystalline toughness, must have less effect in limiting polycrystalline
toughnesses since it allows more effect of other, higher toughness, crystal frac-
ture planes. Increased multiplicity of lower toughness fracture planes, e.g. {100}
cleavage in a cubic material such as CaO or MgO which reflects three planes
probably limits polycrystalline toughness [15, 62]. Second is the resultant mixed
mode combinations of different crystal planes making up transgranular polycrys-
talline fracture, which is probably a major factor in the greater polycrystalline
versus single crystal fracture toughness.
A similar transition must occur from polycrystalline to grain boundary](https://image.slidesharecdn.com/mechanical-properties-of-ceramics-and-composites-120303143122-phpapp01/85/Mechanical-properties-of-ceramics-and-composites-79-320.jpg)
![Grain Dependence of Microcracking, Crack Propagation 79
toughness values for intergranular fracture origins. Such boundary values should
typically be lower than the lowest single crystal values, often substantially so,
especially for the extreme case of fracture of a single grain boundary facet, as
represented in fracture of bicrystals. It is commonly estimated that fracture sur-
face energies of grain boundaries relative to crystal fracture, e.g. cleavage, ener-
gies would parallel those of surface energies, where boundary energies are often
∼ 1/2 those of lower crystal surface energies for a given material. Such estimated
trends are reasonably supported by the limited measurements. A classic study is
the DCB fracture energy measurements of Class and Machlin [158] of KCl
bicrystals grown from the melt with grain boundaries parallel with (100) sur-
faces, but with controlled twist angles between the two “grains.” Their results
showed fracture energies decreasing rapidly as the twist angle increased from
zero to ∼ 0.08 J/m2 at ∼ 5° twist, then bottoming out at 0.04–0.05 J/m2 at twist
angles of 15–45°, in contrast to (100) values of ∼ 0.11 J/m2 (independent of angle
of propagation on the (100) plane). This reflects an average boundary fracture
energy ∼ 1/2 that of the cleavage energy as suggested by surface energy differ-
ences and translates to a decrease to a minimum boundary toughness versus that
for cleavage of respectively 0.06 and 0.09 MPa·m1/2.
More recently, Tatami et al. [159] reported similar NB measurements of
sapphire bicrystals made by pressure sintering crystals with a common c-axis,
i.e. <1000>, normal to the boundary, which was parallel with the (0001) plane,
and typically contained 0–10% porosity. (Such purely twist boundaries avoid
significant boundary stresses from thermal expansion anisotropy, as shown by
Mar and Scott [160] for sapphire bicrystals with twist angles about other axes.)
Fracture energies at 0° twist varied from ∼ 6 to ∼ 15 J/m2 (for toughnesses of ∼
2.7–4.3 MPa·m1/2) with higher values consistent with values for basal fracture
(Fig. 6.1) and lower values with increasing residual porosity. The overall trend
for fracture energies with increasing twist angle was for substantial decrease,
with a few higher spikes of fracture energy at boundary angles where adjacent
“grains” had coincident lattices, but the maximum of these spikes also decreased
as the twist angle increased. Minimum fracture energies of ≤ 1 J/m2 occurred
over most twist angles over the range of ∼ 25–45°, which corresponds to a frac-
ture toughness of ∼ 1 MPa·m1/2. Such decreases were greater than expected from
surface energies, e.g. by a factor of 2 or more.
F. Grain Size Dependence of Fracture Toughness of
Noncubic Ceramics
The previous two sections have addressed the G dependence of toughness in cu-
bic ceramics, then single crystal toughnesses, their anisotropy, and relation to
typical polycrystalline values. This section addresses the G dependence of
toughness of noncubic polycrystalline ceramics in the order: Al2O3 (the most](https://image.slidesharecdn.com/mechanical-properties-of-ceramics-and-composites-120303143122-phpapp01/85/Mechanical-properties-of-ceramics-and-composites-80-320.jpg)
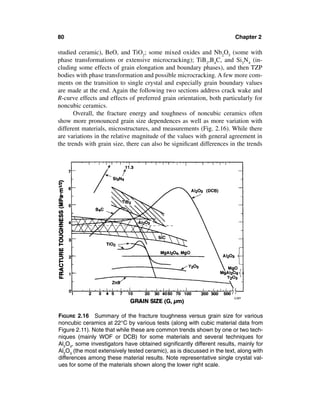
![Grain Dependence of Microcracking, Crack Propagation 81
with G. These differences reflect incompletely documented and understood
changes in mechanisms and their dependence on test effects. Thus per Fig. 2.16
and previous reviews [11, 60, 108] DCB and DT, and sometimes NB, tests show
pronounced Al2O3 toughness maxima, e.g. at G between 50 and 150 µm, which
as noted earlier correlates with stress-induced microcracking (Figs. 2.11 and
2.16). Such trends appear consistent with a transition from mainly or exclusively
stress-induced microcracking at lower G and spontaneous microcracking at
larger G. However, other studies, especially with NB tests, show toughness con-
stant or decreasing slightly as G increases over the typical G range of ∼ 3–30 µm,
with the more limited NB (and IF) data at G ∼ 40–50 µm showing further, often
more pronounced, toughness decrease. Some NB tests also show marked in-
creases below G ∼ 10 µm (which may reflect inadequate notch-crack effects),
while other NB data shows toughness independent of G or slightly decreasing as
G increases to the limits of much testing at ∼ 30 µm. Note that the overall
NBAl2O3 data shows the typical toughness for it of ∼ 3–4 MPa·m1/2. Also, even
tests designed to give toughness values without bridging done in Al2O3 (e.g. G
1–16 µm) give K0 (i.e. “crack tip”) values of 1.8–2.7 and values controlling
strength failurenearer 3 MPa·m1/2 [157], but there are various uncertainties in
such measurements. Further, much more limited data for BeO (Fig. 2.17) indi-
cates a similar trend as for DCB Al2O3 data, consistent with the two materials
having very similar Young’s moduli and TEA (hence microcracking).
FIGURE 2.17 Fracture energy versus grain size for several noncubic oxides, in-
cluding DCB data for Al2O3 and TiO2 data in Figure 2.16 and for three titanates
and Nb2O5 with higher TEA and thus more microcracking at finer G. (After Rice
[60] published with the permission of the Journal of Materials Science.)](https://image.slidesharecdn.com/mechanical-properties-of-ceramics-and-composites-120303143122-phpapp01/85/Mechanical-properties-of-ceramics-and-composites-82-320.jpg)
![82 Chapter 2
More limited TiO2 DCB and WOF data (Figs. 2.16, and 2.17) shows some
differences, but reasonable overall consistency. More recent data [60, 161, 162]
also showed marked toughness decreases between G = 20–30 µm from higher
values (e.g. 6+ down to 3–4 MPa·m1/2), and probable effects of stoichiometry.
The TiO2 data thus also appears to reflect effects of microcracking, e.g. probably
much of it stress induced, but also spontaneous cracking at the lower tough-
nesses at larger G (Fig. 2.10).
Consider now noncubic ceramics of more extreme TEA, e.g. titanates of
MgO, Fe2O3, and Al2O3 along with Nb2O5, which have extensive microcracking
at modest to fine G (Fig. 2.10). These also generally show, often pronounced,
maxima of fracture energy and toughness versus G (Fig. 2.17), with overall
trends generally consistent with those expected from Eq. (2.5), and the previ-
ously outlined microcracking model [43]. However, comparison of two groups
of materials: (1) Al2O3 and TiO2 (as well as presumably BeO and BaTiO3), and
(2) MgTi2O5, Fe2TiO5, and Nb2O5 (and presumably also Al2TiO5) shows that
fracture energy peaks of group 1 are narrower and occur at finer G, typically sub-
stantially so, than predicted for spontaneous fracture per Eq. (2.4) than those of
group 2; the peaks of group 2 occur at G values at or beyond those predicted for
spontaneous fracture. The former is consistent with the microcracking model,
the latter is not. Second, the fracture mode of group 1 typically involves some to
substantial transgranular fracture, while that of group 2 entails mainly intergran-
ular fracture, e.g. for G above half the peak toughness value. Third, and particu-
larly important, while the tensile (flexural) strengths of both groups decrease
with increasing grain size (Chap. 3), those of group 2 do so at a faster initial rate
as compared to group 1, as well as most ceramics of cubic or noncubic crystal
structure (Figures 3.1 and 3.23). Fourth, dynamic E values are independent of G
for group 1 but decrease with increasing G for group 2, and for the latter, along
with tensile strength, increase with temperature [164] Hamano et al. [105]
showed that as microcracking increased as G increased, the work of fracture
more than doubled as E, flexure strength, and crack velocity decreased substan-
tially. They attributed these effects to crack deflection and blunting due to the
microcracks.
Noncubic (i.e. piezoelectric) BaTiO3 shows a more definite and pro-
nounced fracture energy maximum, 2–3 times that found at the same G as cubic
BaTiO3 (above the Curie temperature, 126–129). More limited data of Freiman
et al. [163] on PZT as-fired or poled showed toughness increased from ∼ 1.3 to ∼
1.55 MPa·m1/2 as G increased from ∼ 2 to ∼ 14 µm and was ∼ 1.7 MPa·m1/2 at G ∼
100 µm. A toughness maximum was assumed between the finer and large G val-
ues, i.e. similar to BaTiO3, but much broader. Their data for pressure depoled
samples indicated a similar trend but shifted upward to ∼ 2.2 to 2.5 MPa·m1/2 at
the lower and large G values respectively, again consistent with a maximum at
intermediated G. At least some of these toughness changes in the noncubic state](https://image.slidesharecdn.com/mechanical-properties-of-ceramics-and-composites-120303143122-phpapp01/85/Mechanical-properties-of-ceramics-and-composites-83-320.jpg)
![Grain Dependence of Microcracking, Crack Propagation 83
are related to stresses from the transformation (and possible microcracking Fig.
2.10) and from poling (Sec. III.I).
Consider next nonoxides. The fairly definitive toughness decrease for TiB2
(Fig. 2.16) [60] as G increases from ∼ 5 to 25 µm may be in part due to stress-in-
duced microcracking, consistent with strength changes, prompting Telle and Pet-
zow [98] to suggest, probably incorrectly as noted in Sec. III.C, spontaneous
microcracking. The general trend for KIC of TiB2 to decrease above G ∼ 5 µm and
a maximum for B4C at G ∼ 8 µm is generally consistent with Eq. 2.4 and possi-
bly also with the microcracking model for fracture energy and toughness versus
G. Thus Skaar and Croft [165] give the maximum single crystal ∆α of ∼ 3 × 10⁻⁶
C-1, and the maximum single crystal–polycrystal ∆α of ∼ 2 × 10⁻⁶ C-1, giving
grain sizes for microcracking of the order of those in Fig. 2.4.
Turning to hot pressed B4C, DCB data of Rice [60] is generally consistent
with more extensive and definitive NB data of Korneev et al. [166] and agrees
well with DCB data of Niihara et al. [167] on CVD material. All of these showed
toughness rising from 2.5–4 MPa·m-1/2 at G ∼ 3 µm through a maximum of ∼ 5.5
MPa·m-1/2 at G ∼ 10 µm, then decreasing, to ∼ 2.5 MPa·m-1/2 at G ∼ 30 µm. This
trend is consistent with data of Schwetz et al. [168] for sintered-HIPed B4C + 2,
3, 4, or 5 w/o carbon, which rose, rapidly initially, then at a diminishing rate,
from ∼ 2.5 to ∼ 4 MPa·m1/2 as G increased from 1–2 to 10 µm. The only notice-
able effect of the excess carbon was generally to give somewhat finer G. Thus,
except for one data point of Rice at G ∼ 80 µm and ∼ 4 MPa·m1/2, the data sets are
generally consistent. The occurrence and scale of the B4C toughness maxima is
also consistent with it having nearly identical TEA and Young’s modulus as
Al2O3 [60], thus also suggesting a microcracking effect. This would suggest that
the G value for its KIC maximum would be similar to that of Al2O3. However, it
clearly deviates significantly from this expectation and hence from Eq. 2.4 and
the microcracking model for the grain size dependence of fracture energy and
toughness, being about an order of magnitude too low. Two other deviations are
the essentially 100% transgranular fracture and extensive twinning on the frac-
ture surfaces of larger B4C grains in contrast to mixed to intergranular fracture
mode of Al2O3 with little or no obvious twinning. Twinning in B4C may provide
a mechanism of microstructural stress relief or redistributin to avoid microcrack-
ing at large G, but it leaves uncertain the reason for the toughness maxima at G ∼
10 µm, where transgranular fracture still dominates, but twinning appears to be
much less.
The substantial fracture energy and toughness data for various Si3N4 bod-
ies is complicated by limited characterization, as well as microstructural com-
plexities similar to and beyond those for most other ceramics. Complexities
include the α versus β phase contents and residual additive-boundary phases and
contents, a limited range of grain diameters achievable (commonly < 10 µm, but
often with substantial grain elongation, e.g. aspect ratios to ∼ 10), often with](https://image.slidesharecdn.com/mechanical-properties-of-ceramics-and-composites-120303143122-phpapp01/85/Mechanical-properties-of-ceramics-and-composites-84-320.jpg)
![84 Chapter 2
considerable heterogeneity of grain structure, along with varying degrees of
grain orientation. However, overall trends are indicated by individual and some
collections of tests as follows, with effects of bridging and grain shape and orien-
tation in Secs. III.G and H.
First, the absence or presence, amount, and character of residual boundary
phases play a key role, since, while varying with the additive chemistry, fracture
energy and toughness generally increase with oxide additive content, as shown
for a variety of types and amounts of additive contents by Rice et al. [169], and
more recently in a narrower study by Choi et al. [170]. Extrapolation of such
trends to zero additive levels gives KIC ∼ 4 MPa·m1/2, i.e. below levels with oxide
additives, which is consistent with extrapolation of fracture toughness data of
RSSN (i.e without additives) to P = 0 [169]. It is also consistent with data for
Si3N4 bodies: (1) hot pressed with nonoxide additives (BeSiN2) by Palm and
Greskovitch [171], giving no significant residual boundary phases, (2) hot
pressed or HIPed at high pressures without additives of Shimada et al. [172] and
Tanaka et al. [173], and (3) from CVD Si3N4, as shown by Rice et al. [169] and
Niihara [130, 174]. The latter CVD bodies (G ∼ 1, 4, and 10 µm) give KIC respec-
tively of ∼ 5, 4, and 3.5 MPa·m1/2 (indentation), while the former CVD body with
G ∼ 100 µm also gives KIC ∼ 4 MPa·m1/2. Bodies made without additives com-
monly have G of the order of 1 µm, as did those made with BeSiN2. Thus these
results show little or no G dependence of KIC, or it is decreasing some with in-
creasing G (e.g. from Niihara’s data), either of which is in contrast to results for
bodies made with oxide additives (discussed below). Another important aspect
of the above bodies is their predominately transgranular fracture mode (and in
those tested, no SCG, Sec. III.B) across the complete range of G values, even
with substantial to complete β phase content and grain elongation. This is in on-
trast to substantial intergranular fracture in Si3N4 bodies made with oxide addi-
tives. The frequent absence of significant, if any, effects of β phase content in
RSSN [175] is attributed to their smaller grain size, less elongation, and espe-
cially common transgranular fracture.
The toughness of Si3N4 bodies made with oxide additives, while generally
increasing with additive content, also generally increases with grain size and
grain elongation, the latter typically arising from α to β transformation with in-
creased temperature exposure (mainly in processing). Studies show KIC increas-
ing over part or all of the limited practical G range, e.g. Tani et al. [176],
Matsuhiro and Takahashi [177], and especially Kawashima et al. [178]. The lat-
ter data (Fig. 2.16) implies a probable KIC maximum at G of the order of 10+ µm
based on the high KIC level, as well as on strengths (Chap. 3), but such a maxi-
mum is at an order of magnitude or more lower G than expected from the TEA of
Si3N4, i.e. for α Si3N4, αa = 3.7, and αc = 3.8 × 10⁻⁶ C-1 and for β Si3N4 (i.e. the
larger, elongated grains in most sintered bodies) αa = 3.3 and αc = 3.8 × 10⁻⁶ °C-1
[179] are both too small for microcracking in the grain size of such a KIC maxi-](https://image.slidesharecdn.com/mechanical-properties-of-ceramics-and-composites-120303143122-phpapp01/85/Mechanical-properties-of-ceramics-and-composites-85-320.jpg)
![Grain Dependence of Microcracking, Crack Propagation 85
mum. On the other hand, Si2ON2 [179] and most oxide boundary phases would
have expansion differences that could give microcracking closer to the indicated
G range for the probable KIC maximum. Though specific grain sizes were not
given, Himsolt et al. [180] showed a toughness maximum of ∼ 8 MPa·m1/2 at
similar G values, correlating with nearly complete α to β conversion and in-
creased grain growth (e.g. due to less inhibition by diminishing α content). This
evaluation is consistent with that of others as summarized in the review of Pyzik
and Carroll [181] showing projected toughness mxima at G ∼ 14 and ∼ 20 µm re-
spectively for Y2O3-MgO and Y2O3-Al2O3 additives. Such additive effects are
consistent with Peterson and Tien [182] correlating increased toughness and re-
lated crack tortuosity (and bridging) with increasing thermal expansion of the
oxynitride boundary phase. Correlation of KIC with G is complicated by the ex-
tent of grain elongation, the volume fraction of such grains, and their orientation,
but reasonable overall understanding and corroboration of the expected trends
has been established. Sajgalik et al. [183] showed toughness increasing as the
volume fraction of grains with larger aspect ratios increases (e.g. 4), and Ohji et
al. [184] (Sec. III.E) showed substantially higher toughness (and bridging) with
crack propagation normal to aligned tabular β grains, and much less for crack
propagation parallel with such elongated grains.
Fine-grain tetragonal ZrO2, i.e. TZP, bodies also show high maximum
toughnesses at fine G (Fig. 2.18) with transformation toughening a major factor.
Thus Wang et al. [185] showed a definite (NB) toughness maximum at G ∼ 1.2
µm for compositions with 2, 2.5, or 3 m/o Y2O3, and a similar result, but more
differentiation of compositions and some differences in details of the G depen-
dence, by indent methods (and overall similarity, but some variations in the G
dependence of strength). Indent toughness of Cottom and Mayo [186] for 3 m/o
Y2O3 (∼ 4 MPa·m1/2 at G ∼ 0.25 µm and ∼ 8 MPa·m1/2 at G ∼ 1.4 µm), while not
inconsistent with the G dependence of Wang et al., are substantially lower in val-
ues, which are more consistent with indent values of Swain [187], which suggest
a maximum at larger G. Data of Ruiz and Readey [188] on 2 m/o Y2O3 using the
average of their four different calculations of indent toughness imply a possible
toughness maximum at > 5 µm, but one set of calculations was reasonably con-
sistent with a maximum at G ∼ 1–1.5 µm (respectively solid and dashed lines in
Fig. 2.18). The three data points of Theunissen et al. [189] are in the same range,
except shifted to finer G values than those of Ruiz and Readey. Indent results of
Duran et al. [190] for two compositions of ∼ 3 m/o Y2O3 (with some Er2O3)
showed modest toughness maxima of ∼ 5 and nearly 8 MPa·m1/2 at G ∼ 0.3 µm,
which is clearly both different from, and similar to, data of Masaki [191] for 2,
2.5, 3, and 4 m/o Y2O3 for G = 0.2–0.6 µm showing no G dependence (but tough-
ness of 15+ and ∼ 5 MPa·m1/2 for respectively 2 and 2.5–4 m/o Y2O3), consistent
with some to substantially greater toughness with 2 m/o Y2O3. Combined indent
data of Duh et al. [192] for 1 m/o YO1.5 + 11 mol% CeO2 and SENB data of](https://image.slidesharecdn.com/mechanical-properties-of-ceramics-and-composites-120303143122-phpapp01/85/Mechanical-properties-of-ceramics-and-composites-86-320.jpg)
![86 Chapter 2
FIGURE 2.18 Indent and SENB fracture toughness versus grain size for various
TZP bodies, investigators, and tests [185–194]. Note clear or implied, pro-
nounced toughness maxima, some similar and different, and a possible maxi-
mum for one of four indent calculations of Ruiz and Readey [188], respectively
dashed and solid lines.
Wang et al. [193] for 12 m/o CeO2 indicate a pronounced maximum at G ∼.
2–2.5 µm. While there are uncertainties in such combination, later indent results
of Duh and Wan [194] for bodies with 5.2 m/o CeO2 and 2 m/o Y2O3 indicated a
fairly broad toughness maximum of ∼ 19 MPa·m1/2 at G ∼ 1.5 µm. Thus, while
there are considerable variation and differences, there is substantial evidence for
often pronounced toughness maxima as a function of G. The indicated G values
are approximately consistent with Eq. (2.4), and possibly (2.5), but other related
effects of the transformation process and its effects need to be considered, e.g. as
reviewed by Becher et al. [195].
Note the range of KIC values for some noncubic single- and polycrystals
(Fig. 2.16, Table 2.1), mostly showing ratios of polycrystalline to single crystal
KIC values of 2–3, as for cubic materials. This is not surprising, since cubic mate-
rials often have similar, sometimes more, anisotropy of elastic moduli [65] and
cleavage and fracture as noncubic materials. Thus, except where TEA and other
microstructural stresses are dominant, noncubic materials should show similar](https://image.slidesharecdn.com/mechanical-properties-of-ceramics-and-composites-120303143122-phpapp01/85/Mechanical-properties-of-ceramics-and-composites-87-320.jpg)
![Grain Dependence of Microcracking, Crack Propagation 87
FIGURE 2.19 Schematic of local fracture modes (I, II, or III) of grain boundary
facets for local microcracking (or crack propagation). (After Rice [39], published
with the permission of the ASTM.)
transitions between polycrystalline and single crystal or grain boundary fracture
energies or toughnesses as cubic materials do, e.g. as indicated for Si3N4 (Fig.
2.15). This is also indicated by indent tests of Liang et al. [80] of larger Al2O3
grains showing toughness decreasing from ∼ 2–4 MPa·m1/2 (G ∼ 50 µm) and
1.5–2.5 MPa·m1/2 (G ∼ 100 µm) (respectively for 5 and 10 N loads). Such a tran-
sition has also been outlined for CVD Si3N4 (Fig. 2.15), which has limited
anisotropy and all transgranular fracture. However, it should again be noted that
the combination of TEA and increasing G of many noncubic ceramics should re-
sult in increased intergranular fracture, which would shift the transition to grain
boundary rather than single crystal values. While such grain boundary values
will often be lower, they will often probably be more complex due to the local
mixed mode fracture entailed when more than one grain boundary facet is in-
volved (Fig. 2.19).
G. Grain Dependence of Crack Wake Bridging and Its Relation
to Fracture Toughness
Crack bridging in the wake region is an established phenomenon based on di-
rect observation in this region and is the source of increased toughness in R-
curve effects. The latter was clearly shown by Knehans and Steinbrech [51]
who first showed R-curve effects in NB tests of alumina. Then they extended
the original sawn notch, removing the wake region generated from the initial](https://image.slidesharecdn.com/mechanical-properties-of-ceramics-and-composites-120303143122-phpapp01/85/Mechanical-properties-of-ceramics-and-composites-88-320.jpg)
![88 Chapter 2
crack propagation from the original notch. Upon retesting the specimen with
the wake region from the original test removed, toughness returned to the ini-
tial level at the beginning of the first test but again increased in the same fash-
ion as in the original test with subsequent crack propagation and new wake
development.
Crack wake bridging observations are substantial, especially in Al2O3 and
Si3N4 bodies, but have not been extensively reviewed. However, a review by
Sakai and Bradt [196] is summarized and followed by a broader review, gener-
ally corroborating and extending key points in their review. These include bridg-
ing and resultant R-curve effects widely occurring and generally being more
pronounced with increasing crystalline (grain) anisotropy. Thus R-curve effects
are substantial in materials such as graphite (and especially in fiber reinforced
ceramic composites), but results are probably not unique to a given material and
microstructure. Further, while Weibull modulus may increase, the highest tough-
ness does not necessarily yield the highest strength (Chap. 3), and there probably
are crack geometry effects (e.g. along the lines depicted in Fig. 2.1).
Earlier observations of Wu et al. [6] using DCB tests in an SEM as well as
microradiographic and some optical observations of crack character in ceramics
were made before wake bridging was recognized. Though their purpose was to
demonstrate that the then common idealization of cracks in polycrystalline bodies
as simple ∼ planar cracks as commonly found in glass was often not true, their re-
sults also clearly showed what is now recognized as crack wake bridging in both
similar and different bodies (Fig. 2.4) from those subsequently investigated. Thus
they showed via in situ SEM examination of Al2O3 of larger than normally inves-
tigated grain size (e.g. 30–50 µm) limited occurrence of bridges, which often con-
sisted of several grains, and that some bridging in such bodies resulted in
considerable local microcracking within bridges. Whether these reflect effects of
larger grain sizes, as-fired, rather than the normal polished, surfaces, or both is not
known, but they are one of many indicators of the need for wider study of surface
and grain size effects on bridging. They also conducted microradiography of a
commercial fused-cast alumina refractory sample (with machined surfaces, an av-
erage G ∼ 200 µm, with grains ∼ 50 to 2000 µm, and preexisting microcracks a
few hundred µm in size). These microcracks, especially larger ones or clusters of
them, interacted with the propagating macrocrack, e.g. each deflecting to join
with each other (but not with isolated spherical pores, Fig. 2.4).
Other representative and important alumina observations for finer grain
bodies with machined surfaces are outlined as follows. Swanson et al. [49, 50]
showed a bridging zone length of ∼ 100 grains in a body with G ∼ 20 µm. Rodel
et al. [55] also showed multigrain bridges, and their fracturing, i.e. microcrack-
ing along grain boundaries (G ∼ 11 µm). Vekins et al. [197] using DT tests of a
commercial 96% alumina, some heat treated to extend the starting G from ∼ 4 to
∼ 10 µm in several steps, showed progressively faster rises in toughnesses](https://image.slidesharecdn.com/mechanical-properties-of-ceramics-and-composites-120303143122-phpapp01/85/Mechanical-properties-of-ceramics-and-composites-89-320.jpg)
![Grain Dependence of Microcracking, Crack Propagation 89
plateauing at higher values as grain size increased, distinguishing bodies of < 1
µm difference in G. They showed increasing reloading hysteresis as G increased
in the R-curve region, and the ultimate fracture energy rose slightly faster than
linearly with increasing G, while the length of the bridging zone behind the
crack decreased nonlinearly with G from ∼ 11 to ∼ 6 mm, i.e. respectively ∼
3000 and ∼ 600 grain diameters. Predominate transgranular fracture was ob-
served, sometimes forming bridges a fraction of a grain in width and a substan-
tial fraction to over a grain in length, i.e. similar to yttria and the ferrite noted
above. However, the most significant bridging was attributed to intergranular
fracture forming bridges of complete, often larger, grains or grain clusters. These
were verified by locating the bridging grain on one half of the resultant fracture
surface and the mating hole for it on the other fracture half along with wear
markings from the pullout of the grain [197]. These observations are directly
contrary to later claims that fractography can provide virtually no information on
bridging [198]. Vekins et al. found no evidence of microcracking ahead of the
crack or in its wake, other than that involved in forming the bridges. They con-
cluded that, rather than bending of elastic ligaments, work expended in rotating
and pulling bridged grains out of the mating fracture surface against friction was
the main source of toughening, which they estimated entailed ∼ 10% of the
grains in their case, but could be less if larger grains dominate the bridging
process. They had no explanation for the large decrease, by ∼ 2, in the bridging
zone length as grain size approximately doubled. Steinbrech et al. [199] showed
a similar trend for greater toughness increases (but starting from lower initial
values) for a 2 versus a 10 µm body. They also concluded that frictional effects
were probably an important factor, that microcracks in the wake zone were
mainly associated with debris, and that R-curves were not unique for a given
body but depend on test parameters and microstructural variations. Thus crack
wake bridging, extensively observed in Al2O3, may be an alternate explanation to
microcracking for toughness maxima versus G (Fig. 2.16), but bridging-R-curve
effects have been observed only over part of the G range (mostly G ∼ 1 to 10–20
µm) and may involve some microcracking and thus correlate with microcracking
models.
Bridging and R-curve effects clearly occur in many Si3N4 bodies but are
quite dependent on microstructural parameters, apparently occurring only in
bodies with sufficient grain size, elongation, and amount and character of grain
boundary phase. Such effects have not been observed in bodies without oxide
additives due to resultant transgranular fracture (and no slow crack growth,
Secs. III.A and B) in the absence of resultant grain boundary phases. Even with
oxide additives, such effects are observed not to occur, or to occur only in very
modest amounts, in finer grain, equiaxed bodies, e.g. as reported by Mizuno and
Okuda in their evaluation of round robin KIC tests [13]. All observations of sig-
nificant bridging in Si3N4 are with substantial amounts of oxide additives,](https://image.slidesharecdn.com/mechanical-properties-of-ceramics-and-composites-120303143122-phpapp01/85/Mechanical-properties-of-ceramics-and-composites-90-320.jpg)
![90 Chapter 2
larger, especially elongated (β) grains with substantial intergranular fracture,
e.g. as shown by Li et al. [200], Peterson and Tien [182], Sajgalik et al. [183],
and Okada and Hiroshi [201], with the latter also showing the expected accom-
paniment of environment-driven SCG (Sec. III.B). However, it is also generally
observed that effects of grain elongation become limited due to increasing frac-
ture of more elongated grains. It is widely accepted that bridging is the domi-
nant or exclusive source of the substantially higher KIC values, e.g. above 4–5,
to values of ∼ 10+ MPa·m1/2. However, other observations indicate that bridging
is not the whole story. Thus Hirosaki et al. [202] concluded that crack bridging
by elongated beta grains was the main source of their high toughness (10.3
MPa·m1/2, 600 MPa strength and Weibull modulus m of 25) and in their lowest
toughness (8.5 MPa·m1/2, 690 MPa strength and m = 53) bodies. However, they
attributed toughness in their intermediate toughness bodies (8.8 MPa·m1/2, 515
MPa strength and m = 19) to microcracking from excessively large grains.
(Also, Salem et al. [203] reported that large grain fracture initiation limited
strengths in their Si3N4.)
Turning to limited data for a very anisotropic material, graphite, Sakai et
al. [204, 205] reported both microcracking and bridging in the crack wake region
of an isotropic graphite (coke grain size ∼ 15 µm, 15% porosity, mean pore dia. ∼
5 µm) using CT and in situ SEM tests. The latter were reported to show microc-
racks in both the wake region and ahead of the main crack within ± 60° of the
crack plane at about 60% of the failure load that were about 1–20 µm long, with
some of them joining and growing to > 100 µm long. These microcracks under-
went partial closure around (often quite elongated, multigrain) bridges in the
wake region. That microcracks formed considerably ahead of the main crack was
indicated by reductions in crack resistance as the main crack tip approached but
was still some distance from the specimen edge. They corroborated that the
crack resistance/toughness effects arose primarily from the wake region via
renotching à la Knehans and Steinbrech [51]. These observations are supported
by those on microcracking in graphites (102, 103, and Secs. 3.3.4, 9.3.1D. of
Ref. 5).
Graphite results, while more extreme in some aspects, are similar overall
to other ceramic bridging results, adding to the correlation of bridging, microc-
racking, and TEA. Microcracks as a factor in forming bridges are logical, as
noted earlier, but their observed formation at or ahead of the main crack tip is
still inconsistent with the earlier, abandoned, concept of microcrack zones ahead
of, but well above and below, the main crack being the primary source of tough-
ening. However, the extent of the microcrack occurrence, e.g. in terms of their
size and distance ahead of the main crack in graphite, appear more extreme, rais-
ing the question of the relative roles of the extreme anisotropy and of pores in
graphites that are not adequately understood. Despite the common assumption
and observations that pores and microcracks have independent effects on behav-](https://image.slidesharecdn.com/mechanical-properties-of-ceramics-and-composites-120303143122-phpapp01/85/Mechanical-properties-of-ceramics-and-composites-91-320.jpg)
![Grain Dependence of Microcracking, Crack Propagation 91
ior, pores and microcracks have been observed to interact not only in graphites
but also in a porous sandstone (46, and Figure 4.5 of Ref. 5) and some ceramic
composites (Chap. 8. Sec. V). The high graphite EA may also play a role as indi-
cated by the following results for cubic materials.
While much of the attention on wake effects from bridging focused on
noncubic Al2O3 and Si3N4 with TEA as a cause of their increased toughness, both
earlier and subsequent results clearly show that bridging also occurs in cubic ma-
terials. Thus Wu et al. [6] showed in dense MgO bodies (Fig. 2.4) by microradi-
ography that (1) crack twisting, tortuosity, and branching-bridging occurred with
G ∼ 50 and ∼ 200 µm, with the latter showing more extreme deviations, and via
both microradiography and in situ SEM observations that (2) heterogeneous
grain sizes resulted in more complex-tortious crack character, e.g. due to multi-
ple microcracks formed in larger grain clusters. They also showed by in situ
SEM observations that dense, large (∼ 100 µm) grain Y2O3 samples with as-fired
surfaces had long, narrow bridging ligaments formed from the essentially uni-
versal transgranular fracture (i.e. cracks apparently avoiding grain boundaries)
that were sometimes a grain or more long, but a fraction of a grain thick.
Beauchamp and Monroe showed that bridging occurred in the crack wake
zone of Mn Zn ferrites undergoing slow crack growth in DCB [52] or indent-
flexure tests [53]. DCB tests showed crack wake bridges similar to those in the
Y2O3 noted above, reflecting the predominant SCG transgranular fracture (and
more intergranular fast fracture) in their ferrites. This atypical reversal of the
SCG to fast fracture mode transition (Sec. III.B) was associated with a general
increase of intergranular fracture as the crack stress intensity increased, and
more intergranular fracture for any given condition in the finer grain (∼ 24 µm by
DCB tests) ferrite with more Ca at grain boundaries than for the larger grain
(∼35 µm) body. Their indentation tests showed that cracks with numerous
bridges were formed with indentation under oil, while indentation under water
produced cracks with essentially no bridges, i.e. again different from most other
observations. (See the note at the end of this chapter for corroborating data.)
White and colleagues investigated crack bridging by DCB tests [206, 207]
in two dense, transparent MgAl2O4 bodies made with LiF additions, with bi-
modal grain distributions of (1) 10–40 and 50–100 µm ranges (average G ∼ 35
µm) and (2) 50–200 (average ∼ 150 µm) and 200–500 µm ranges. The smaller
grain body had higher toughness over the ranges of crack propagation (1 to ∼ 10
mm), i.e. starting at ∼ 1.7 and going to ∼ 3.4 MPa·m1/2, versus ∼ 1.4 to 2.9
MPa·m1/2, with grains > 80–100 µm generally fracturing transgranularly and the
rest intergranularly. This toughness behavior was repeated when specimens of
either grain size had the original wake area removed by sawing a fresh notch à la
Knehans and Steinbrech [51]. In contrast to tests of finer grain aluminas, the R-
curve increase in toughnesses were ∼ linear and had not saturated in their tests
since full development would have required larger specimens because of the](https://image.slidesharecdn.com/mechanical-properties-of-ceramics-and-composites-120303143122-phpapp01/85/Mechanical-properties-of-ceramics-and-composites-92-320.jpg)
![92 Chapter 2
larger grain sizes. They did not comment on the larger grain body starting from,
and remaining at, lower K values than the finer grain body, which is opposite to
grain size effects found with finer grain alumina bodies (discussed below). How-
ever, this may reflect part of the transition from polycrystalline to single crystal
or grain boundary toughnesses. In a subsequent evaluation they concluded that
models for bridging effects in alumina did not fit their MgAl2O4 results well, im-
plying that the assumed grain interlocking mechanism was less effective for the
MgAl2O4 [208].
Noncubic (i.e. α) SiC behaves quite similar to cubic (β) SiC (e.g. Figures
2.14 and 2.16) provided there is no significant grain boundary phase to promote
grain elongation, intergranular fracture, and frequently associated crack deflec-
tion, branching, and bridging. Lee et al. [209] sintered β (cubic) powders with ei-
ther Al2O3 + Y2O3 or B + C additions yielding various admixtures of α
(noncubic) SiC, giving mostly elongated, platelet grains. R-curve effects and re-
lated crack wake bridging occurred in bodies made with oxide additives having
equiaxed grains or tabular grains (e.g. aspect ratios of ∼ 3) and toughnesses for
crack extensions of 0.1 to 1 mm respectively of 5.5–6 and 5–7 MPa·m1/2, all with
mixed trans- and intergranular fracture. In contrast, the body sintered with B +C
additions, with similar grain sizes and shapes as those made with oxide addi-
tions, had low fracture toughness ∼ 3 MPa·m1/2, independent of crack extension,
i.e. no R-curve effect. These bodies had essentially complete transgranular frac-
ture (consistent with earlier discussion of the effects of such B + C additives giv-
ing transgranular fracture and no slow crack growth, Sec. III B) and hence no
significant grain bridging. Gilbert et al. [18] similarly showed that commercially
sintered α-SiC (with B + C and equiaxed grains, G ∼ 5 µm, and ∼ 3% porosity)
had low toughness (IF, ∼ 2.5 MPa·m1/2), no R-curve behavior (i.e. was indepen-
dent of crack size) and transgranular fracture. However, SiC hot pressed to simi-
lar G, but with Al, B, and C additions yielding elongated grains and an
amorphous grain boundary phase ∼ 1 nm thick with predominantly intergranular
fracture, showed significant R-curve effects. IF tests with smaller craks extrapo-
lated to a zero crack size toughness the same as the α-SiC, and increased to ∼ 9
MPa·m1/2 at crack extensions of > 400 µm, while large crack, CT tests started at
nearly 6 MPa·m1/2 at zero crack length, rising to an ∼ plateau of > 9 MPa·m1/2 at
crack extensions of 600 µm.
It is clear from the above that crack wake bridging plays an important role
in large crack fracture toughness for many noncubic, and some cubic, bodies.
However, there are critical issues of the nature and mechanisms of such crack-
dependent toughness and its role in controlling strength. With regard to the for-
mer, issues of starting crack character, size, and its distance and conditions of
propagation have been noted, including multiple cracks from notches, crack
branching, or both [210] and the extent to which they are precluded by side
grooves in tests (e.g. DCB and DT). As noted earlier, comparison of Wu et al.’s](https://image.slidesharecdn.com/mechanical-properties-of-ceramics-and-composites-120303143122-phpapp01/85/Mechanical-properties-of-ceramics-and-composites-93-320.jpg)
![Grain Dependence of Microcracking, Crack Propagation 93
[6] observations on specimens with as-fired surfaces versus other studies, with
machined surfaces, indicates substantially less bridging on as-fired surfaces.
Also, Ewart and Suresh [211] noted that crack propagation from notches in ma-
chined alumina NB specimens subjected to cyclical compressive loading showed
∼ 50% greater extent of crack growth from the notch at and near the machined
surfaces as opposed to the center of the specimen.
Much more attention is needed on environmental and grain boundary
phase effects, since these play a possibly critical role that has been only partly
addressed as shown earlier (and by Choi and Horibe [212] and more recently
[213] and is probably significant in limited attempts to determine R-curve effects
at nearly normal strength controlling flaw sizes [214]. Recent studies of Becher
and colleagues provide more insight into effects of grain boundary phases in
Si3N4 bodies, and a potentially valuable experimental tool of evaluating behavior
of a specific boundary by observing the stopping of a crack from a nearby indent
at the boundary and the occurrence and extent of deflection of the crack along
the boundary as a function of the angle between the crack and the boundary
[215, 216].
The above issues are partly related to the limited observations of some
crack velocity decreases with bridging, microcracking, or both [52, 213], envi-
ronmental [217] and strain rate effects [56] and their making resultant toughness
being nonunique, not only between different tests supposedly measuring the
same property but even for the same material and test, which raises large issues.
Another, probably related, issue is the role of microcracking not only in generat-
ing bridges but also as a competitive or accompanying mechanism [e.g. 218].
These issues are interrelated to those of the size, extent, and nature of propaga-
tion of large cracks versus those factors for flaws causing normal strength fail-
ure, which is particularly critical. While bridging observations are valuable for
understanding large crack behavior, e.g. in serious thermal shock or impact dam-
age, they often have, at best, limited effect on normal strengths unless sufficient
bridging occurs at finer grain sizes. All of these issues are factors in the
nonuniqueness of R-curve results, e.g. Cox [219] reported NB testing that
showed “the profound influence of the extrinsic factors of specimen shape and
load distribution on the propagation of bridged cracks when the bridging zone
length is comparable to any dimensions of the crack or specimen.”
All the above issues are factors in the second and larger issue of the rela-
tion of these large crack effects to normal strengths controlled by small cracks.
Thus comparison of bridging and crack deflection [220] showed that deflection
is not significant at large crack sizes, but comparison at smaller crack sizes was
not considered, and possible mechanisms operative at smaller crack sizes have
been widely neglected. That these are critical issues is shown by the fact that
there are extensive and basic inconsistencies between much toughness data, pri-
marily that with larger crack, e.g. R-curve, effects and normal strength data as](https://image.slidesharecdn.com/mechanical-properties-of-ceramics-and-composites-120303143122-phpapp01/85/Mechanical-properties-of-ceramics-and-composites-94-320.jpg)
![94 Chapter 2
extensively discussed further below and especially in Chap. 3. The key to these
critical differences is the difference in the microstructural dependence of tough-
ness and strength, especially the grain size dependence in monolithic ceramics
(Chaps. 3 and 6) and the particle size dependence in ceramic composites(Chaps.
8, 9, and 11).
H. Grain Shape and Orientation Dependence of Crack Propagation
Grain shape, especially elongation, often plays an important role in crack propa-
gation behavior via effects on microcracking, crack deflection and roughness,
and especially crack wake bridging. Such effects are most pronounced with in-
tergranular fracture, often due to weaker grain boundaries from residual additive
phases, e.g. oxides in Si3N4 and SiC, and LiF in MgO and especially MgAl2O4,
as was discussed earlier. Thus when such boundary phases are not present, elon-
gated grains are generally ineffective in increasing toughness due to their com-
mon transgranular fracture. Larger, equiaxed or elongated grains, or grain
clusters, can also be strength limiting by acting as failure sources in conjunction
with pores, or cracks from machining, handling, or TEA or other microstructural
stresses, e.g. Figs. 1.7B, and 3.35. Grain boundary phases or impurities to en-
hance intergranular fracture may exacerbate such weakening, as is discussed in
Chap. 3, Sec. III.G.
Koyama et al. [221] directly observed effects of progressive, generally
uniform, increases in grain size (∼ 1–50 µm) and elongation in dense Al2O3, sep-
arately controlled respectively by sintering temperature and limited, increasing
CaO and SiO2 additive (e.g. to 0.25 m/o) levels to transition from equiaxed to
blocky, platelet grains. They showed both increased R-curve and resultant
(SENB) toughness with both the size of equiaxed grains (from ∼ 3.5 to 4.5
MPa·m1/2) and the length and thickness of the platelet grains (from ∼ 4 to 6.6
MPa·m1/2). While all bodies had predominant to exclusive intergranular fracture,
the platelet grains, though showing some transgranular fracture, had progres-
sively wider crack deflections correlating with their greater crack resistance.
However, flexure strengths varied inversely with toughness, following conven-
tional grain dependence (Sect. III.A of Chap. 3). Some similar effects have been
reported in alumina bodies doped with Na2O + 4 MgO [222] or SiO2 + LaAl11O18
[223], producing composites with platy second-phase grains (particles), hence
discussed in Chap. 8, Sec. V.D.
Much broader effects of grain elongation occur when it is coupled with
grain orientation locally, and especially globally (the latter often is in part a re-
sult of starting grain shape, as is discussed below, while the former commonly
results from in situ elongated grain development, e.g. as in most bridging ef-
fects). Global grain orientation commonly occurs since, for a given shape-crys-
tallographic particle morphology, it tends to increase in the approximate order:](https://image.slidesharecdn.com/mechanical-properties-of-ceramics-and-composites-120303143122-phpapp01/85/Mechanical-properties-of-ceramics-and-composites-95-320.jpg)
![Grain Dependence of Microcracking, Crack Propagation 95
die pressing, tape casting, and extrusion of green bodies. Orientation of particles
in fields (e.g. magnetic) or in various hot working and deposition processes (in-
cluding a number of rocks and minerals) often produces substantial preferred
orientation, as is discussed further later. Key examples of limited studies of ef-
fects of preferred grain orientation on crack propagation behavior of ceramics
are summarized below and in Table 2.3. While many cubic ceramics have similar
anisotropy of mechanical properties to those of noncubic ceramics, the latter are
anisotropic in other properties, that aid in giving noncubic bodies more preferred
orientation. Thus the primary examples of effects of preferred grain orientation
are in noncubic ceramics.
Fryxell, Chandler and colleagues [224, 225] sintered BeO made by either
green body extrusion or isopressing of powders designated as either AOX (from
Be(OH)2) or UOX (from BeSO4), often with annealing after sintering to increase
grain size. While their results were obtained before fracture toughness measure-
ments had been established, they are still quite useful, since they observed that
extrusion aligned the considerable population of acicular UOX particles (c-axis
parallel with particle lengths) to give a substantial c-axis texture parallel with the
extrusion axis. This basal texture normal to the extrusion axis, and its increases
with grain growth, was observed to give x-ray intensities of preferred peaks of as
much as 100 times that of a random body. However, no preferred orientation was
found in either extruded or isopressed bodies from equiaxed AOX powders, or
from isopressed UOX powders, i.e. such bodies were isotropic. The axial ther-
mal expansion of extruded rods from AOX powder was independent of grain
size at the normal value, while that of extruded UOX rods decreased as grain
size (and preferred orientation) increased, consistent with a lower expansion in
the c direction, saturating at G ∼ 100 µm with ∼ 6% decrease. Extrapolation of
axial Young’s and shear moduli of oriented and unoriented bodies to zero poros-
ity gave values respectively of 416 and 389 GPa, i.e. an increase of ∼ 7% in the
oriented material. While exact flexural strength comparisons are complicated by
differing grain sizes and less data for a given grain size, limited or no difference
was indicated at 22°C between oriented and unoriented bodies over most of the
grain size range 5–50 µm, but oriented bodies with larger grains, G ∼ 80 and 100
µm, were ∼ 30% stronger than bodies without oriented grains. As test tempera-
tures increased, strengths of finer grain (–20 µm) bodies did not decrease signifi-
cantly till 1000, and especially 1200°C (possibly first increasing a few percent,
peaking at 500–800°C). However, strengths of larger grain bodies increased as
test temperature increased, especially in the 500–800°C range, commonly equal-
ing or exceeding those of the finer grain bodies at 1200°C, with oriented bodies
typically maintaining their strength advantages.
Virkar and Gordon [146] found considerable preferred orientation of
basal planes in the pressing plane of hot pressed beta alumina bodies (1–2%
porosity). Average toughness values at 22°C were of the order of 20% lower for](https://image.slidesharecdn.com/mechanical-properties-of-ceramics-and-composites-120303143122-phpapp01/85/Mechanical-properties-of-ceramics-and-composites-96-320.jpg)
![96
TABLE 2.3 Summary of Grain Orientation Effects on Mechanical Propertiesa
Material Orientation G|/G⊥ (G in E|/E⊥ (E in KIC|/KIC⊥(KIC σ|/σ⊥ (σ
methodb µm)c GPa)d in MPa·m1/2)e in MPa)f Investigator
Al2O3 GB Ex. 5.2/4.2 ∼ 1.2 392/376 ∼ 1.04 2.5/4.1 ∼ 0.61 — Salem et al. [226]
BaO·6Fe2O3 Mag. field — 317/154 ∼ 2.1 2.8/0.96 ∼ 2.9 — Iwasa et al. [227]
SrO·∼5Fe2O3 Mag. field 1.5/2.5 ∼ 0.6 169/179 ∼ 0.94 2.5/1.7 ∼ 1.5 265/162 ∼ de With and
1.6 Hattu [228]
Jadite Natural 40/20 ∼ 2 — 2.6–3.1/3.6g —/107g
Hornblend Natural 40/5 ∼ 8 — 3.7–3.9/3.5g —/93g Wu et al. [229]
Hornblend Natural 100/1 ∼ 100 — 7.2–8.2/16.6h 40/288h
a
For measurements with stress parallel (|) and perpendicular (⊥) with the axial orientation, all at ∼ 22°C.
b
GB Ex = green body extrusion. Mag. field refers to die pressing with a magnetic field applied along the axis of the die and resultant part.
c
G = grain size.
d
E = Young’s modulus.
e
KIC = fracture toughness (values for Al2O3 are extrapolated to zero crack extension in R-curve tests, as discussed in the text).
f
σ = tensile (flexure) strength.
g
Transgranular fracture.
h
Intergranular fracture. Note some variation in KIC values for jade from tests on two orthogonal planes parallel to the fiber axis indicating ef-
fects of variable fiber orientation.
Chapter 2](https://image.slidesharecdn.com/mechanical-properties-of-ceramics-and-composites-120303143122-phpapp01/85/Mechanical-properties-of-ceramics-and-composites-97-320.jpg)
![Grain Dependence of Microcracking, Crack Propagation 97
crack propagation normal versus parallel to the basal texture, i.e. respectively
2.7–3.0 versus 3.5–3.7 MPa·m1/2, with the higher values of the preceding ranges
being for large grain (200–300 µm) and lower values for finer grain (2–10 µm)
bodies, with both orientations showing nominally 100% transgranular fracture.
Values for an isopressed and sintered body (∼ 3% porosity, G ∼ 100 µm) with no
significant preferred orientation were ∼ 3.2 MPa·m1/2, i.e. in between those for
the two orientations of the hot pressed bodies. The hot pressed toughness
anisotropy is opposite of what would be expected from Hitchcock and De-
Jonghes’ [144] single crystal results (Table 2.1). However, the flexure strength
anisotropy for the same crack propagation orientations was nearly 40%, but op-
posite to that for toughness, i.e. lower strengths for crack propagation parallel
with the basal texture, while the limited strengths of the isopressed and sintered
bars were approximately in between the two sets of hot pressed values, as for
toughness. While compositional differences between these polycrystalline and
crystal specimens (Table 2.1) may be a factor, Virkar and Gordon’s suggestion
that the toughness for crack propagation parallel with the basal texture was
higher due to possible multiple basal cracking, e.g. due to imperfect alignment,
is a reasonable possibility. The opposite and greater anisotropy in strength from
toughness indicates that large scale toughness values are not fully consistent
with strengths. Alternatively or additionally the strength anisotropy may reflect
oriented pores, larger grains, or clusters of them acting as fracture origins of
lower strenth for stressing normal (and fracture parallel) to the basal texture, as
also indicated in other studies below.
Salem et al. [226] showed a c-axis texture along the green body extrusion
axis of alumina (i.e. a basal texture normal to it), versus isotropic isopressed
bodies. The latter gave isotropic Young’s modulus (E, 368 GPa) and KIC (∼ 3.7
versus 4.9 and 3.6 MPa·m1/2 for the extruded bodies, the latter being the plateau
values from R-curve tests, and hence different from values in Table 2.3). The
isotropic E value was slightly below that for the lowest value for oriented bodies
and the isotropic KIC at the low end of the range of oriented values, probably re-
flecting differences in the amount and especially character of porosity, as is dis-
cussed below. All three crack propagation orientations in extruded specimens
showed some R-curve effect. Fractographic examination of samples showed
clear differences in overall appearance of fractures perpendicular versus parallel
with the extrusion axis. Differences reflect in part definite effects of pore elonga-
tion in the extrusion direction along with heterogeneous distribution of grains of
varying size that complicate normal effects of just the grain orientation.
Two related sintered, hard (hexa-)ferrites oriented using a magnetic field
axial with the die ram both gave a c-axis texture parallel with the field-pressing
direction, i.e. a basal plane texture normal to the pressing direction (Table 2.3).
Resultant sintered grains were somewhat elongated normal to the c-axis and
typically failed intergranularly for fracture parallel with the basal texture and](https://image.slidesharecdn.com/mechanical-properties-of-ceramics-and-composites-120303143122-phpapp01/85/Mechanical-properties-of-ceramics-and-composites-98-320.jpg)
![98 Chapter 2
transgranularly for fracture normal to the basal texture at 22°C. Iwasa et al.
[227] also reported that samples pressed without an applied magnetic field were
isotropic and showed parallel decreases of Young’s moduli in the isotropic body
and perpendicular and parallel to the axial texture in the oriented samples as
temperature increased to 900°C (the limit of testing). KIC values similarly de-
creased for the isotropic body and for fracture parallel to the basal (i.e. perpen-
dicular to the c-axis) texture, but no decrease in toughness occurred for crack
propagation normal to the basal (i.e. parallel with the c-axis) texture till
1000°C. (From 1000 to 1200°C, the limits of testing, all toughnesses decreased
drastically.)
De With and Hattu [228] showed lower E, but substantial toughness and
strength, anisotropy in similar, but less orientated, related hard ferrite at 22°C.
They also showed an average decrease in both toughness and strength from
“dry” versus “wet” tests averaging ∼ 20%, i.e. with no clear differentiation as a
function orientation of the stress relative to the texture. However, they showed
that there was a marked effect of orientation on the crack growth exponent, n, of
Eq. (2.3), i.e. values of 39 and 320 respectively for fracture perpendicular and
parallel with the c-axis texture. Byrne et al. [85] noted some anisotropy in SCG n
values, i.e. respectively 160 and 200 for crack propagation parallel and normal to
the green body extrusion axis for fired porcelain samples, which presumably in-
troduced some preferred orientation of the SiO2 and other particulate phases in
the glass matrix.
The first of two other sets of tests further showing effects of preferred ori-
entation on fracture toughness and related properties of rock materials is the
study by Wu et al. [229] of toughness and flexural strength of jade, a natural gem
material known for its toughness, attributed to its common fibrous structure. Ac-
tually jadite and hornblend, two naturally occurring minerals that are common
sources of “jade” with very similar structure and common [110] cleavage with
varying fibrous grain structures, were studied [Table 2.3]. DCB toughness results
for propagation parallel versus perpendicular to the fiber orientation showed
modest to no significant anisotropy with lower grain aspect ratios, and especially
larger grain (fiber) diameters and associated transgranular fiber (grain) fracture
(Fig. 2.20). Toughness values for crack propagation parallel with the fiber axis,
but on orthogonal planes to each other, differed some, i.e. similar to variations
found in the extruded alumina (Table 2.3). Hoagland and Embury [45, Fig. 4 of
Ref. 5] also showed significant anisotropy, i.e. fracture toughness as much as 2–5
times higher for crack propagation normal to the bedding planes versus parallel
to the bedding planes and differences of 1.2–2.2-fold for the two planes normal
to each other and the bedding planes, as well as differences in both magnitude
and direction between the limestone and sandstone used.
Pertinent to earlier bridging effects is the work of Ohji et al. [184]. They
incorporated 2 v/o of fine ∼ 1.3 µm dia. β Si3N4 rod grains (i.e. whiskers with as-](https://image.slidesharecdn.com/mechanical-properties-of-ceramics-and-composites-120303143122-phpapp01/85/Mechanical-properties-of-ceramics-and-composites-99-320.jpg)
![Grain Dependence of Microcracking, Crack Propagation 99
FIGURE 2.20 Examples of jade fractures and microstructures. Note the coarser,
blocky, transgranularly fractured, grain structure with no clear preferred orienta-
tion in jadite (A) and the clear horizontal orientation of fine, very elongated grains
of a fine intergranularly fractured, grain hornblend body (B). (After Wu et al. [229],
published with the permission of the Journal of Materials Science.)
pect ratios of ∼ 4) into an α Si3N4 matrix by tape casting to orient the elongated β
grains in the casting direction and stacking of cast sheets to maintain the orienta-
tion between the sheets. This resulted in highly oriented elongated grains giving
very anisotropic toughness, i.e. ∼ 7 and 11 MPa·m1/2 for crack propagation re-
spectively parallel and perpendicular to the oriented grains. However, neither
crack propagation direction showed much R-curve effect. This was attributed to
the close spacing (e.g. ∼ 5 µm) of the elongated grains causing near or complete
saturation of R-curve effects at much smaller crack sizes–propagation distances
than normally required in microstructures with lower densities and larger spac-
ing of the elongated grains for bridging. Comparative tests of a similar Si3N4
with randomly oriented rod grains showed substantial R-curve effects starting at
toughness for cracks parallel with the elongated grains and ending at levels for
crack propagation normal to the elongated grains in bodies with the highly ori-
ented, elongated grains. They reported almost twice the strength (∼ 1100 MPa)
and Weibull moduli (∼ 46) in bars with elongated grains aligned normal to the
crack propagation of failure versus bars with randomly oriented elongated
grains.
Several studies have addressed anisotropy in hot pressed and especially
hot forged S3N4, e.g. an earlier study of Lange [230] showed that flexure bars ori-
ented for fracture parallel to hot pressing direction had strengths ∼ 35% higher
than bars oriented for fracture perpendicular to that direction. This was attributed
to greater difficulty of fracture around the elongated grains (due to the grain
boundary phase) resulting from the transformation of the starting α powder that
had a preferred orientation normal to the hot pressing direction. DCB fracture](https://image.slidesharecdn.com/mechanical-properties-of-ceramics-and-composites-120303143122-phpapp01/85/Mechanical-properties-of-ceramics-and-composites-100-320.jpg)
![100 Chapter 2
energy/toughness tests partially supported this, showing an anisotropy of 18% in
fracture energy (thus probably less for toughness), i.e. accounting for about half
or less of the strength difference (while he subsequently corroborated increased
toughness with increased β grain content and elongation [231]). Weston [232]
corroborated the type of texture found by Lange, as well as similar strength
anisotropy (26–38% higher for fracture parallel versus perpendicular to the hot
pressing direction) of hot pressed S3N4. However, he also did a fractographic
study, showing flaws initiating fracture parallel to the hot pressing direction av-
eraged ∼ 2.7 times the size of flaws initiating fracture normal to the hot pressing
direction, which leads to a strength anisotropy of ∼ 65%, i.e. nearly twice that
observed. However, this difference was generally accounted for by the
anisotropy in KIC calculated from his fractographic results, which was ∼ 23%,
but opposite that of Lange, i.e. higher for fracture normal versus parallel to the
hot pressing direction. He also reported that fracture parallel to the hot pressing
direction was predominately intergranular, while that for fracture perpendicular
to the hot pressing direction was mixed inter- and transgranular. Ito et al. [233]
also showed anisotropy in hot pressed Si->3N4, i.e. for fracture parallel versus
perpendicular to the hot pressing axis the strengths were ∼ 20% and the Weibull
modulus ∼ 40% higher. They correlated this with larger average size and broader
spatial distribution (i.e. depth from the tensile surface) of fracture origins in the
pressing plane.
More recently Lee and Bowman [234] corroborated the c-axis texture nor-
mal to the hot pressing direction and showed strong increases in this by press
forging (e.g. to 6 times random and hence also of sintered bodies they exam-
ined). Indentation tests of KIC for fracture parallel versus normal to the pressing
axis varied from 23–46% higher for hot pressed and 43–106% higher for press
forged bodies, i.e. higher values for fracture normal versus parallel with the c-
axis texture (and intermediate KIC values for fractures at 45° in between these
two tests). These three more comprehensive examples of S3N4 studies clearly
showed common textures and resultant significant anisotropy of strength and
fracture toughness that occur with hot densification or forming, but clearly some
important differences, some of which are addressed in Chap. 3, Sec. V.D. It is
clear that fractography, which has not been adequately used, is an important tool
and that flaw character, especially orientation and size, is probably an important
factor in the strength anisotropy, with probable contributions from toughness
anisotropy. While less extreme and more dependent on fabrication parameters,
preferred orientation also results from other forming operations, e.g. die press-
ing, as is shown by Goto et al. [235].
Recently Kim et al. [236] showed that hot pressing of 80 w/o β-SiC with
12 w/o Al2O3 and 8 w/o Y2O3 resulted in substantial {111} orientation parallel
with the pressing plane and that annealing converted the body to mostly α-SiC
with substantial (004) orientation parallel with the pressing plane. I toughness](https://image.slidesharecdn.com/mechanical-properties-of-ceramics-and-composites-120303143122-phpapp01/85/Mechanical-properties-of-ceramics-and-composites-101-320.jpg)
![Grain Dependence of Microcracking, Crack Propagation 101
for crack propagation normal and parallel with the pressing plane were respec-
tively 5.7 and 4.4 MPa·m1/2.
Graphite materials frequently have varying, often substantial, degrees of
local or global orientation, or both, depending on a variety of factors, especially
their fabrication. However, evaluating grain orientation effects on properties is
often challenging due to the generally substantial porosity present, and espe-
cially since varying amounts of the aniosotropy of properties also occur due to
varying degrees of orientation of anisotropically shaped porosity, which is a
function of both fabrication and microstructure. However, CVD graphite (also
referred to as PG, pyrolytic graphite), while generally being complicated some
by varying colony structures and their impact on local and global orientation and
mechanical behavior, has no significant porosity and thus offers a clear indica-
tion of the anisotropy of graphite properties due solely to grain orientation.
(CVD graphite results should also be indicative of such trends for CVD BN,
since both have very similar properties and anisotropy as well as CVD struc-
tures. However, bodies of the two materials made by consolidation of particles
may differ considerably, since liquid phase densification aids are typically used
for BN and not for graphite, which can result in important differences in the be-
havior of the two materials processed from particulates.)
Sakai et al. [237] reported substantial anisotropy of toughness as well as
Young’s modulus and flexure strength in CVD graphite, which has a high degree
of preferred orientation of the basal plane parallel with the deposition plane (Table
2.4). Their results on the latter properties were generally consistent with other data
in the literature for Young’s modulus and flexure strength given expected varia-
tions in CVD bodies, especially colony structure and hence orientation and other
microstructural factors. Their toughness results were from a mix of DCB, CT, and
NB testing, since crack propagation was not always well behaved, especially in the
high toughness orientation, which was for both the crack propagation plane and the
direction normal to the plane of deposition and the basal texture. The high and
variable toughness for this orientation of 1.4 to 7.5 MPa·m1/2 was associated with
variable but generally extensive delamination that occurred parallel with the basal
texture normal to the crack. Such delamination occurred at distances from the
notch and with spacings of the order of mm, i.e. on a large scale. The lowest tough-
ness of 0.53 MPa·m1/2 was for both the crack propagation plane and the direction
parallel with the basal texture. The third orientation, i.e. with the crack propagation
plane and direction being respectively perpendicular and parallel with the basal
texture, gave a toughness of 0.93 MPa·m1/2, which is between the other two values,
but much closer to the lowest value. Their strength and Young’s modulus values
roughly scale with each other, as do the two lowest toughness values, but their high
toughness value does not, again showing high toughness behavior with large
cracks with limited or no correlation with smaller crack behavior as for normal
strength, as is discussed extensively in the next chapter.](https://image.slidesharecdn.com/mechanical-properties-of-ceramics-and-composites-120303143122-phpapp01/85/Mechanical-properties-of-ceramics-and-composites-102-320.jpg)
![102 Chapter 2
TABLE 2.4 Effects of Preferred Grain
Orientation on Mechanical Properties of CVD
Graphite
Orientationa
Property ca ab bc
E(GPa) 5.5 28 20
σ(MPa) 9.6 190 158
KIC(MPA·m1/2) 0.53 0.93 1.4–7.5
a
Designations of Sakai et al. [237] referring respectively
to crack propagation planes and directions relative to the
basal plane texture: parallel, parallel; perpendicular, par-
allel; and perpendicular, perpendicular.
Source: From Sakai et al. Ref. 237.
I. Other Factors and Evaluations
There are several factors that impact on, or have correlation with, effects of grain
stresses that should be considered; effects of electrical fields in piezoelectric and
ferroelectric materials are important examples. McHenry and Koepke [238]
showed in DT tests of poled PZT that both the K and the n value [Eq. (2.3)] de-
creased substantially with increased electric fields perpendicular to the crack,
with somewhat less effect of ac versus dc fields. They also showed that similar
field application to poled samples deflected propagating cracks. Kim et al. [239]
showed that a clear transition from predominately intergranular fracture below ∼
10 µm to predominately transgranular fracture by 18–20 µm in sintered PZT (P ∼
3%) was progressively shifted to larger grain sizes after poling with progres-
sively higher poling fields. Thus a body with G ∼ 18 µm and ∼ 76% transgranular
fracture unpoled had ∼ 26% transgranular fracture after poling with 2 kV/mm
and ∼ 2% after poling at 3 kV/mm. Chung et al. [240] showed that microcracks
began forming at grain boundaries and increased in number and size in sintered
BaTiO3 (G 36–53 µm), and in a tetragonal, and a rhombohedral, PZT (G 10–17
µm) as grain size and poling field (1 or 3 kV/mm) increased. However, while the
cracks started at the grain boundaries, they typically propagated into the grains.
The above and following cracking associated with poling and other applied elec-
tric fields is consistent with expected stress concentrations of such fields at crack
tips [127, 238].
Earlier studies of Halloran and Skaar [241] on Navy Type III Pt-8 sonar
rings showed that all four apex cracks from Vicker’s indents (500 gm, 4.9 N)
were equal in thermally depoled samples whether the cracks were parallel or per-
pendicular to the original (axial) poling field (giving KIC ∼ 0.7 MPa·m1/2, Fig.
2.21A). However, they showed that stresses from poling resulted in significant](https://image.slidesharecdn.com/mechanical-properties-of-ceramics-and-composites-120303143122-phpapp01/85/Mechanical-properties-of-ceramics-and-composites-103-320.jpg)
![Grain Dependence of Microcracking, Crack Propagation 103
anisotropy of the indent cracks due to some shortening of cracks parallel and es-
pecially significant elongation perpendicular to the poling direction (Fig. 2.21
B), which they attributed respectively to compressive stresses normal, and ten-
sile stresses parallel, to the poling direction. They calculated that these stresses
would increase hoop, and decrease axial, tensile strengths by ∼ 60% and 40% re-
spectively if they were linearly additive to the applied stress. Subsequent work
[242] showed poling stresses increased hoop tensile strengths of poled rings, but
by only ∼ 10%, not 60%, and that the Weibull modulus for hoop strengths of
poled and depoled rings were respectively ∼ 3.6 and 7.6. The lower increased
hoop strength and Weibull modulus for poled rings must reflect other complexi-
ties, e.g. effects of pores.
Zhang and Raj [243] corroborated the above anisotropy of cracks from
Vickers indents relative to the poling direction in poled samples (3.5 kV/mm) of
a hot pressed tetragonal PZT. Indent (3.5 N) toughness of unpoled material was
isotropic but decreased from ∼ 1.9 at G = 0.5 µm to ∼ 1.4 MPa·m1/2 at G = 3 µm,
then was constant at the latter value to the limits of their grain sizes (15 µm).
Toughness at G = 0.5 and 1.5 µm were respectively 2.8/0.8 and 2.2/0.7 MPa·m1/2,
where the first and second values are respectively for crack propagation parallel
and perpendicular to the poling direction, i.e a ratio of >3.
Lynch [244] has recently demonstrated similar effects of poling and has
shown effects of applied fields using Vickers indents in a ferroelectric composi-
tion of PLZT (G ∼ 5 µm). He showed that indent cracks in unpoled material
were isotropic but that cracks normal to a subsequently applied electric field
elongated above a threshold field. Such elongated cracks also occurred with in-
dentation under an electrical field (again above a threshold field) and in poled
FIGURE 2.21 Photomicrographs of Vickers indents (4.9 N) on surfaces of PZT:
(A) depoled and (B) poled (in vertical direction). (Photos courtesy of Dr. J. Hal-
lorin, University of Michigan.)](https://image.slidesharecdn.com/mechanical-properties-of-ceramics-and-composites-120303143122-phpapp01/85/Mechanical-properties-of-ceramics-and-composites-104-320.jpg)
![104 Chapter 2
samples. Microcracking was also observed near indents made in poled samples
with high applied fields. The fracture mode for these effects, which were attrib-
uted to grain mismatch stresses from the fields, was mainly intergranular. A
similar relaxor composition always had isotropic indent crack patterns, consis-
tent with little or no mismatch stresses. A model was presented for toughness
accounting for effects of residual strain energy released, showing that finer G
bodies would have higher toughness normal to the field direction and less spon-
taneous cracking during polarization switching.
Wan and Bowman [245] recently showed that poling of PZT also leads to
elastic anisotropy consistent with that of toughness. They further showed that
progressive thermal depoling progressively reduces the anisotropy, returning to
isotropic properties on complete depoling, and that these changes are consistent
with changes in domain character revealed by x-ray diffraction.
The above static applications of electric fields and mechanical stresses
raises the question of the grain dependence of microcracking and macrocrack
propagation when either or both are applied in a cyclic fashion. Though direct
studies of grain dependence are lacking, the previous and following results indi-
cate that such dependence probably occurs. Jiang and Cross report that electrical
fatigue can be a serious life limiting factor for ferroelectric and piezoelectric ma-
terials such as PZT and PLZT, where porosity [246] and surface contamination
[247] can be factors. White and colleagues found some similarities, as well as
complexities relative to the above results in delayed fatigue and electrical cy-
cling tests of a PZT (-8, G ∼ 3 µm) with and without indent flaws at temperatures
of < 86 and > 150°C. TEM showed microcracking at both lower and higher tem-
perature cyclic loading [248]. At the higher temperatures crack extension was
observed with no evidence of environmental effects or reduction of toughness
and microcracking occurring in small clusters throughout the specimen. Little
crack extension was seen at the lower temperature, where microcracking was
confined to a region of ∼ 600 µm radius from the indentation. Subsequent cy-
cling of such specimens at > 100°C resulted in immediate failure from undefined
sources. Further studies [249] showed that high microcrack densities formed in
mechanically cycled samples and in samples electrically cycled at < 80°C, with
the microcracks originating from second-phase particles consisting of Pb, Ti, and
Fe at the triple points. Electrically cycled samples allowed to heat to 180°C
showed much lower crack densities, but were depolarized, while samples simply
heated in a furnace to 180°C were not. Higher densities of microcracking found
in mechanically cycled samples were related to the higher mechanical stresss.
Note that other mechanical properties can be affected by electric fields, e.g. hard-
ness of both single and polycrystalline BaTiO3 [250] (Chap. 4, Sec. II.E) and
other complications occur (see the note at the end of this chapter).
The developing field of mechanical fatigue of ceramics typically uses frac-
ture toughness-type specimens and resultant v–K curves and the related Eq.](https://image.slidesharecdn.com/mechanical-properties-of-ceramics-and-composites-120303143122-phpapp01/85/Mechanical-properties-of-ceramics-and-composites-105-320.jpg)
![Grain Dependence of Microcracking, Crack Propagation 105
(2.3), (2.6) for evaluation. Such testing has focused on the use of large cracks, so
grain bridging in the crack wake region is a major factor in fatigue crack propa-
gation, which implies substantial grain dependence (Sec. III.E). While much at-
tention has been focused on the mechanics of testing and behavior, some data on
grain dependence does exist. Thus Suresh’s review [251] reports that ceramics,
like other materials, typically follow the Paris relation, i.e.
dc (2.6)
= ( ∆K ) m
dN
where c = crack length (for large cracks), N = number of cycles, K = stress inten-
sity on the crack, and m = a constant for a given material, e.g. m ∼ 14 for ceram-
ics and 2–4 for metals. He also showed that increased grain size in WC-Co
bodies reduces fatigue crack growth with predominately intergranular fracture
along the Co binder (as in crack growth under static loading), but transgranular
fracture increased as G increased. He also summarized work showing overaged
(i.e. microcracked and lower toughness) PSZ had substantially faster crack
growth than the same material of more optimum aging and higher toughness, as
did Dauskardt [252]. The latter also reported modeling and limited experimental
results for sintered Al2O3 (G ∼ 8 and 13 µm) and Si3N4 with elongated beta grains
showing reduced fatigue crack growth as toughness increased, consistent with
bridging expectations. Hoffman et al. [253], however, showed that varying grain
size of PSZ did not significantly affect fatigue crack growth. Healy et al. [254]
reported “long” and “short” (indent) crack tests respectively in a pure sintered
alumina (P ∼ 0.02, G ∼ 10 µm) and a commercial 90% alumina (G ∼ 4 µm), the
former, but not the latter, following a Paris law. They attributed the failure of the
short (indent) crack tests to follow a Paris law to differences of short crack be-
havior, e.g. dependence on local microstructure, and also noted differences in
grain size effects on fatigue crack growth and (rotary) fatigue strength. They also
observed that the “long” crack fatigue behavior of the two aluminas was similar,
being dominated by crack wake bridging. However, in situ fatigue tests in a
SEM resulted in mixed transgranular fracture with discontinuous propagation
and frequent crack arrest, versus continuous propaation and entirely intergranu-
lar fracture in air, implying environmental effect on bridging, consistent with
earlier results (Sec. III.B).
Kishimoto et al. [255] evaluated cyclic tensile fatigue behavior of two
dense, pure aluminas, G = 1 and 19 µm, using compact tension specimens in test-
ing at room temperature. They showed that while crack propagation was acceler-
ated by cyclic loading, i.e. gives higher crack propagation rates than static
loading, the stress intensity for the onset of cyclic crack propagation is greater in
the larger grain body, which also had a subsequent lower rate of crack increase.](https://image.slidesharecdn.com/mechanical-properties-of-ceramics-and-composites-120303143122-phpapp01/85/Mechanical-properties-of-ceramics-and-composites-106-320.jpg)
![106 Chapter 2
Thus the crack propagation rate for the fine-grain body increased as crack length
increased, while that for the coarser grain body was independent of crack length.
They attributed these differences to the significant grain bridging and related R-
curve effects in the larger grain body, which is consistent with more intergranu-
lar fracture in the larger grain body and more of this fracture mode in cyclic
versus fast fracture.
Besides use of electric fields and cyclic loading to alter and hence probe ef-
fects of grain stresses and associated micro- or macrocracking, there are other im-
portant tools that can be of value but have not been widely used. Thus measuring
elastic moduli and damping as a function of temperature cycling can be a valuable
indicator of micro and other cracking [35, 63], e.g. from serious thermal shock
[256]. Similarly, while measurement of thermal expansion during thermal cycling
is valuable for determining aspects of microcracking, careful measurements of
specimen length or volume can give useful estimates of microcrack content [99].
Further, measurements of precision elastic limit, the stress beyond which a partic-
ular body will exceed its original dimensions upon release of the stress, while es-
sential for some high-precision applications such as telescope mirrors, can be
valuable indicators of microcrack formation (see Note at end of chapter).
Finally, the first of two powerful, but highly neglected, tools is acoustic
emission. This is useful not only for identifying microcracking, e.g. in Al2TiO5
[257, 258], but also potentially for learning more about various aspects of crack
propagation, including bridging and fatigue. Both recent results [49, 259–261]
showed promise, and advances in electronics increase opportunity. Thus Kishi et
al. [262], using acoustic emission and fractography in crack propagation (includ-
ing R-curve) studies of two aluminas (G ∼ 5 and 20 µm), showed formation of
15–20 µm microcracks at the crack tip and subsequently some ∼ 100 µm cracks.
They reported that in the finer G body smaller microcracks formed intergranu-
larly, e.g. from pores, and larger ones from the coalescence of smaller ones,
while in the larger G body microcracks were mainly transgranular with the size
determined by the grain size. Sklarczyk [263] showed microcracking and subse-
quent microcrack coalescence ahead of the crack tip, substantial, e.g. ∼ 20% of
events, occurring in the wake area, so one or both of these probably indicate
greater sensitivity for such events. The second tool is fractography, which while
used more than acoustic emission is still widely underutilized. Thus, for exam-
ple, while fractography has been used to identify bridging mechanisms, its use
has been limited, and even claimed (incorrectly) to be ineffective. Besides
broader use, more quantitative and sophisticated use of fracture mirror and frac-
ture origin–fracture mechanics evaluation is needed [39, 40, 60]. A key need is to
use these tools in addition to broader measurement of different properties on the
same body under a broader range of conditions, as shown by the limitations of so
much testing of a limited range of material, microstructural, and environmental
conditions, usually for one physical property.](https://image.slidesharecdn.com/mechanical-properties-of-ceramics-and-composites-120303143122-phpapp01/85/Mechanical-properties-of-ceramics-and-composites-107-320.jpg)
![Grain Dependence of Microcracking, Crack Propagation 107
While the application of fractography to fracture of bulk materials is im-
portant, as discussed elsewhere in this chapter and book, its use for evaluating
properties of ceramic fibers allows obtaining fiber property data not obtainable
by other methods. Thus Sawyer et al. [264, 265] obtained a fracture toughness of
∼ 2 MPa·m1/2 for polymer-derived SiC-based ceramic fibers with nanoscale
grains (Figure 3.13) by measuring fracture mirror sizes versus failure stress. This
result was also consistent with indicated flaw sizes or a few microns to a fraction
of a micron and is consistent with values obtained for variations of fiber compo-
sition [167]. Similarly, Vega-Boddio et al. [266] reported a fracture energy of ∼
4.6 J/m2 from the strengths of CVD B filaments and fracture initiating flaw sizes
and character; this gives a similar toughness, i.e ∼ 2.2 MPa·m1/2 [267].
IV. DISCUSSION, SUMMARY, AND CONCLUSIONS
The transition from intergranular to transgranular fracture at finer grain sizes
(e.g. from a fraction of a micron to ∼ 10 or fewer microns) is widely found for
most ceramics (Fig. 2.5, and often on a given specimen whose grain size range
covers much of the fracture transition mode range). However, this transition is
often shifted to larger grain sizes by boundary phases, SCG under static and dy-
namic loading, superposition of other stresses such as from electric fields, and by
higher temperatures. Much less data indicates partial to complete transition back
to intergranular fracture at larger to very large (e.g. multi cm scale) grain sizes,
with a probable inverse correlation between the grain size range and the degree
of TEA, EA, or both. Because of these factors influencing fracture mode and its
role in many mechanical properties, failure to determine the fracture mode,
preferably as part of a larger fracture surface evaluation, is a serious limitation to
establishing a sound self-consistency to mechanistic interpretations of test re-
sults. However, there are also at least two cases where SCG is transgranular and
fast fracture intergranular (Sec. III.B and the note at the end of this chapter),
showing the need for further characterization and study.
Microcracking from mismatch strains between grains is clearly estab-
lished, with grain sizes and parameters for this approximately predicted by Eq.
(2.4) (Fig. 2.10), but there is a clear need to refine the equation, e.g. its numerical
constant and parameters that are used in it as a function of material and microc-
rack character. There are limited, but clear, indications of (1) a significant depen-
dence of microcracking on environmental effects, i.e. SCG, (2) changing
microcrack/grain ratios as G changes, (3) closure and healing of microcracks di-
minishing, then disappearing as grain size increases, at least in HfO2 (at G ∼ 17
µm), and (4) some transgranular microcracking occurring in larger grains of at
least some bodies. The latter two observations, while typically neglected or as-
sumed not to occur, are probably of fairly broad occurrence. Observation 4 indi-
cates a fracture mode transition similar to the conventional one but shifted to](https://image.slidesharecdn.com/mechanical-properties-of-ceramics-and-composites-120303143122-phpapp01/85/Mechanical-properties-of-ceramics-and-composites-108-320.jpg)
![108 Chapter 2
larger G by boundary stresses, probably occurring in larger grains with less mis-
match strain with adjacent grains (hence favoring microcracking at or nearer
room temperature where intergranular fracture is less favored). Observations 3
and 4 are probably related, since transgranular microcracks would appear to be
less amenable to closure and healing than intergranular microcracks.
Grain structure effects on SCG are clearly shown by differences between
single- and polycrystals, e.g. in the high directionality of SCG in many single
crystals (Fig. 2.7) versus polycrystals, and especially by the occurrence of inter-
granular SCG in polycrystals (Fig. 2.6), including materials having no SCG in
single crystal form. While some of the latter differences may be an intrinsic re-
sult of grain boundary character, it commonly is an extrinsic result of grain
boundary phases as found from effects of oxide additives for sintering nonoxide
materials such as AIN, Si3N4, and SiC. Additional grain structure effects on SCG
are indicated by effects of grain orientation. A direct effect of grain size is indi-
cated by reduced SCG, i.e. higher n values [Eq. (2.3)], in some finer grain bodies
of both cubic (MgAl2O4) and noncubic (Al2O3, and TiB2) bodies (Fig. 2.8).
Effects of grain structure on fracture energy and toughness are clearly
shown by differences between polycrystals and the lower fracture toughness sur-
faces of single crystals, e.g. by a factor of 2–3 (Table 1) (Figs. 2.12, 2.13, 2.16,
and 2.17) and the transition between these as a function of the crack-to-grain size
ratio (Fig. 2.15). In extreme cases of one very low toughness plane (e.g. the basal
plane of beta alumina), comparison to primarily or only the lower fracture tough-
ness crystal values is generally appropriate, as is indicated by the dominance of
such planes in the transgranular fracture of most polycrystals. This is also indi-
cated by a possible trend for a more rapid single crystal to polycrystal toughness
transition as the multiplicity of lower toughness crystal surfaces increases. Grain
size dependence of fracture energy and toughness can be significant depending
on test parameters, especially with larger crack sizes and extents of propagation,
as well as material and microstructure character. Significant maxima are com-
monly seen as a function of G for noncubic materials and lesser ones in cubic
materials, but some of the latter can be substantial. The significant increases in
toughness, yielding maxima over a sufficient G range in noncubic materials, first
attributed to microcracking ahead of the macrocrack tip, is now attributed to
crack bridging in the macrocrack wake, i.e. behind its tip. However, experimen-
tal evidence shows that some microcracking occurs closely ahead of, in or near
the plane of, and around, and possibly somewhat behind, the macrocrack tip.
Thus microcracking probably occurs, though not in the zone configurations pre-
viously proposed, and it may be a precursor to bridging, independent of bridging
or both. Crack branching, though mostly neglected, probably because many tests
limit or preclude it, may be another factor in, or in addition to, bridging.
Bridging clearly occurs in the wakes of large cracks in crack propagation
tests in a variety of materials and microstructures and is an important factor in R-](https://image.slidesharecdn.com/mechanical-properties-of-ceramics-and-composites-120303143122-phpapp01/85/Mechanical-properties-of-ceramics-and-composites-109-320.jpg)


![Grain Dependence of Microcracking, Crack Propagation 111
preferred orientation of anisotropically shaped pores. Fractography is thus a
critical tool in resolving these, especially strength, effects, as it is in so many
other cases.
NOTE
After completing this chapter, a few additional and important references were
obtained, whose results pertinent to this chapter are briefly summarized. Don-
ners [268] conducted a more comprehensive study of fracture of MnZn ferrites.
He corroborated the opposite change in fracture mode, i.e. from more trans-
granular for SCG to more intergranular for fast fracture reported in such ferrites
reported by Beauchamp and Monroe [52, 53] instead of the usual reverse of
this, and cites evidence that this is related to effects of stoichiometry. He also
showed that (1) fracture mode could thus vary with location on the fracture sur-
face as a function of distance from the specimen surface due to reduced H2O
diffusion, (2) fracture toughness decreased from ∼ 2 to 1.3 MPa·m1/2 as the rela-
tive humidity increased from 0 – 10 to 100%, (3) NH3 had the greatest effect on
SCG, H2S, the next, with NO and CO having a similar effect as H2O, and (4)
large, exaggerated grains (e.g. >> 100 µm due to Al2O3 from contact with re-
fractories) were preferred fracture origins. A threshold for SCG was also re-
ported, as was fracture initiation for areas of exaggerated grain growth. He also
cited date of Tanaka et al. [269] showing fracture on both (100) and (110) crys-
tal planes with respectively ∼ 1–1.3 and 0.9–1 MPa·m1/2, consistent with a pref-
erence for (110) fracture.
Swab et al. [270] have shown that fracture initiation in dense, transparent
AlON with large G (∼ 150–200 µm) was from one or a few transgranularly frac-
tured grains followed by mainly intergranular fracture indicating another case of
the reversal of the typical SCG to fast fracture mode transition. They also
showed that isolated large grains in dense, transparent MgAl2O4 with a bimodal
grain distribution (G - 5–20 and ∼ 200 µm) were frequent fracture origins, appar-
ently with transgranular fracture, with more intergranular fracture of the sur-
rounding finer grains.
Further testing of electric field effects on fracture of piezoelectric ceramics
shows wider and conflicting results. Thus, while some, e.g. Park and Sun [271]
showed that positive fields normal to a crack aid propagation while negative
ones retard propagation, and questioned the use of stress intensity factors in such
cases, Fu and Zhang [272] found crack propagation enhanced by either field po-
larity, e.g. apparently consistent with effects of ac fields [237]. However, these
and other differences, and reports of microcracking and fatigue, respectively im-
plying and showing nonreversible effects, indicate that this is a broader and more
complex area of research that requires much more comprehensive study and
analysis than it has generally received so far.](https://image.slidesharecdn.com/mechanical-properties-of-ceramics-and-composites-120303143122-phpapp01/85/Mechanical-properties-of-ceramics-and-composites-112-320.jpg)
![112 Chapter 2
Finally, further note the very high dimensional stability of materials, which
consists of two aspects: (1) the precision elastic limit (PEL) commonly defined as
the stress to produce a detectable positive residual strain, e.g. 1 ppm, upon removal
of a temporarily applied stress and (2) dimensional stability (DS) with a stress ap-
plied for extended times, often expressed as a percentage of the PEL, i.e. a “creep”
resistance. While the PEL definition is based on stability to 1 part in 10-6 some (e.g.
optical and gyroscope) applications, may require higher stability, e.g. 1 part in
10-7–10-8. PEL values for metals are a fraction of their yield stress, e.g. < 1/2, while
the more limited values for ceramics may be their ultimate, usually true tensile,
strength, but can be less [273–275]. Thus, three measurements showed the PEL of
sintered BeO varying from 70–81% of their true tensile strengths (of 105–145 MPa)
and one measurement in compression gave a PEL of 82% of the ultimate (1.7 GPa)
[273]. The DS of the three tensile tests were 50–80% of their tensile PEL, while the
one compressive test was 6–12% of the compressive PEL, i.e. ∼ twice the stress
level for compression versus tension. Other tests of fused SiO2 and a low expansion,
highly crystallized glass (Cer-Vit®) showed elastic behavior to a strain sensitivity
of 5x10⁻⁸ to stresses of 34 MPa (which was true for specimens with etched or un-
etched surfaces, with some specimens failing at such a stress) [275]. Such tests may
be valuable for detecting effects such as SCG (though the similarity of etched and
unetched results with glassy materials may question this) and microcracking, e.g. as
may occur in BeO (in tension and possibly compression).
REFERENCES
1. AG Evans. Fracture Mechanics Determinations. Fracture Mechanics of Ceramics
1 (RC Bradt, DPH Hasselman, FF Lange, eds.). Plenum Press, New York, 1974,
pp. 17–48.
2. RF Pabst, Determination of KIC-Factors with Diamond-Saw-Cuts in Ceramic Ma-
terials. Fracture Mechanics of Ceramics 2. Plenum Press, New York, 1974, pp.
555–565.
3. RF Pabst, K Kromp, G Popp. Fracture toughness—measurement and interpreta-
tion. Proc Brit Cer Soc, No. 32 (R Davidge, ed.), pp. 89–103, 1982.
4. RW Rice. Fractographic Determination of KIC and Effects of Microstructural
Stresses in Ceramics. Ceramic Transactions, 17:Fractography of Glasses and Ce-
ramics II (VD Frechette and JR Varner, eds.). Am. Cer. Soc., Westerville, OH,
1991, pp. 509–545.
5. RW Rice. Porosity of Ceramics. Marcel Dekker, New York, 1998.
6. CCm Wu, RW Rice, PF Becher. The Character of Cracks in Fracture Toughness
Measurements of Ceramics. Fracture Mechanics Methods for Cements, Rocks,
and Ceramics (SW Freiman and ER Fuller, Jr., eds.). Am. Soc. for Testing and Ma-
terials, STP 745, 1981, pp. 127–140.
7. CCm Wu, SW Freiman, RW Rice, JJ Mecholsky. Microstructural aspects of crack
propagation in ceramics. J Mat Sci 13:2659–2670, 1978.
8. RW Rice. Test-Microstructural Dependence of Fracture Energy Measurements in](https://image.slidesharecdn.com/mechanical-properties-of-ceramics-and-composites-120303143122-phpapp01/85/Mechanical-properties-of-ceramics-and-composites-113-320.jpg)
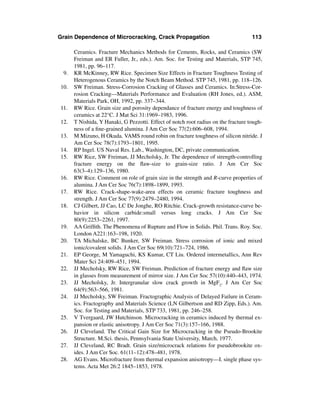


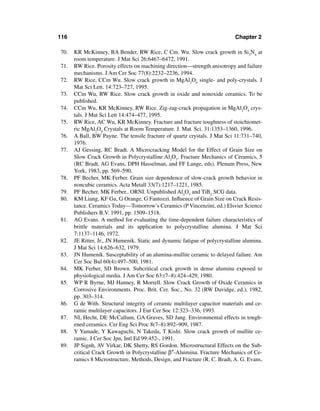
![120 Chapter 2
145. AV Virkar, GT Tennenhouse, RS Gordon. Hot-pressing of LiO2-stabilized β″-alu-
mina. J Am Cer Soc 57(11):508, 1974.
146. AV Virkar, RS Gordon. Fracture properties of polycrystalline LiO2-stabilized β-
alumina. J Am Cer Soc 60(1–2):58–61, 1977.
147. R Stevens. Strength and fracture mechanisms in beta-alumina. J Mat Sci
9:934–940, 1974.
148. YP Gupta, AT Santhanam. On cleavage surface energy of calcite crystals. Acta
Metall. 17:419–424, 1969.
149. K Honma, M Yoshinaka, K Hirota, O Yamaguchi. Fabrication of calcite (CaC03)
ceramics with high density. J Mat Sci Lett 17:745–746, 1998.
150. RA Schultz, MC Jensen, RC Bradt. Single crystal cleavage of brittle materials. Int
J Fracture 65:291–312, 1994.
151. M Pardavi-Horváth. Microhardness and brittle fracture of garnet single crystals. J
Mat Sci 19:1159–1170, 1984.
152. CP Chen, MH Leipold. Fracture toughness of silicon. Am Cer Soc Bull
59(4):469–472, 1980.
153. CP Chen, MH Leipold, Jr., D Helmreich. Fracture of directionally solidified mul-
ticrystalline silicon. J. Am Cer Soc 65(4):C-49, 1982.
154. M Iwasa, RC Bradt. Cleavage of natural and synthetic single crystal quartz. Mat
Res Bull 22:1241–1248, 1987.
155. OO Adewoye. Anisotropic flow and fracture in beryl [Be3Al2(SiO3)6]. J Mat Sci
21:1161–1163, 1986.
156. M Sakai, RC Bradt, AS Kobayashi. The toughness of polycrystalline MgAl2O4. J
Cer Soc Jpn, Intl Ed 96:510–515, 1988.
157. J Seidel, J Rodel. Measurement of crack tip toughness in alumina as a function of
grain size. J Am Cer Soc 80(2):433–438, 1997.
158. WH Class, ES Machlin. Crack propagation method for measuring grain boundary
energies in brittle materials. J Am Cer Soc 49(6):306–309, 1966.
159. J Tatami, T Harada, K Yasuda, Y Matsuo. Influence of twist angle on the toughness
of (0001) twist boundary of alumina. Cer Eng Sci Proc 19:211–218, 1998.
160. HYB. Mar, WD Scott. Fracture induced in Al2O3 bicrystals by anisotropic thermal
expansion. J Am Cer Soc 53(10):555–558, 1970.
161. WP Minnear, RC Bradt. Stoichiometry effects on the fracture of TiO2. J Am Cer
Soc 63(9–10):485–490, 1980.
162. K Yasuda, S Ohsawa, Y Matsuo, S. Kimura. Influence of microcracking on frac-
ture toughness of TiO2 sintered body. J Jap Soc Mat Sci 41(463):482–488,
1992.
163. SW Freiman, L Chuck, JJ Mecholsky, DL Shellman, LJ Storz. Fracture Mecha-
nisms in Lead Zirconate Titanate Ceramics. Fracture Mechanics of Ceramics 8,
Microstructure, Methods, Design, and Fracture (R C Bradt, AG Evans, DPH Has-
selman, FF Lange, eds.). Plenum Press, New York, 1986, pp. 175–185.
164. Y Ohya, Z-E Nakagawa, K Hamono. Crack healing and bending strength of alu-
minum titanate ceramics at high temperature. J Am Cer Soc 71(5):C-232–233,
1988.
165. EC Skaar, WC Croft. Thermal expansion of TiB2. J Am Cer Soc 56(1):45, 1973.](https://image.slidesharecdn.com/mechanical-properties-of-ceramics-and-composites-120303143122-phpapp01/85/Mechanical-properties-of-ceramics-and-composites-121-320.jpg)


![3
Grain Dependence of Ceramic
Tensile Strengths at ∼ 22°C
I. INTRODUCTION
A. Background
It has been known for years that grain effects play an important role in the ten-
sile, hence flexure, strength (σ) of ceramics. Since grain size (G) is the most im-
portant and pervasive variable in both improving and understanding tensile
strength, various G functions have been used to show strength decreases with in-
creasing G. Some investigators opted for log σ vs. log G plots, e.g. Knudsen [1]
but this compresses data at large G (obscuring important σ–G changes there). An
inverse G function is preferred, since this allows use of data for all grain sizes,
including single crystals (G = ∞), though with some large-G data compression.
For mechanistic reasons discussed below, plotting σ vs. G-1/2 has become stan-
dard, but there is still some confusion and uncertainty concerning specific para-
meters and interpretations. Related issues of using average or maximum G
values and branch intersections and slopes, particularly at finer G, whose clarifi-
cation [2, 3] is addressed later, need broader recognition and use. The volume
fraction porosity (P) and the shape and spatial variations of porosity, grains, and
other phases can be important, particularly in view of the challenge of obtaining
a significant range of specimens in which G is the primary factor determining σ.
Before proceeding to discussing mechanisms and presentation and evalua-
tion of data it is useful to consider briefly the history of investigating and under-
standing grain size effects on the strength behavior of ceramics. To obtain
reasonable data several limitations had to be overcome, often in an iterative fash-
127](https://image.slidesharecdn.com/mechanical-properties-of-ceramics-and-composites-120303143122-phpapp01/85/Mechanical-properties-of-ceramics-and-composites-128-320.jpg)
![128 Chapter 3
ion, namely effects of second, e.g. glassy, phases in many oxide ceramics such as
Al2O3, and varying pore and flaw populations, and their interactions, and limita-
tions and variations of grain size, shape, and orientation. Problems of these limi-
tations were compounded by many studies focusing on one particular
mechanism or one particular aspect of a variable, e.g. G distribution, often with a
limited range of testing and evaluation, and failing to apply some necessary ba-
sic tools, especially fractography. An important step was sorting out the main
porosity effects [1–6], thus enhancing identification of grain size effects.
Another major help was improvements in raw materials and processing,
especially the introduction and increasing use of hot pressing, to give bodies
with little or no porosity and second phases with either finer or larger G [7–11],
thus better defining both branches (Fig. 3.1). Larger G behavior generally ap-
proximated a G -1/2 dependence of strength, suggesting grains being the flaws
(recognizing that flaw size, c, is measured by a radius and G by a diameter).
However, this relation must be limited, since it implies strength extrapolating to
0 at G = ∞, neglecting single crystal strengths generally being similar to many,
and higher than some, polycrystalline bodies, as is discussed later. Finer grain
samples typically showed some, but much less, grain size dependence than
larger grain samples, i.e. laying mostly or completely along the finer grain
branch (Fig. 3.1), hence projecting to a positive strength intercept at G = ∞ (i.e.
G-1/2 = 0), commonly of the order of magnitude as for single crystal specimens
with the same surface finish. The combination of such a positive intercept along
with increasing observations of slip or twinning on a micro-, or in some cases a
macro-, scale suggested possible microplastic crack nucleation, growth, or both.
Carniglia’s surveys [8, 9] showed that when a sufficient G range was covered,
both regimes of behavior were typically observed as a continuous function of G,
showing finer G strengths decreasing with increasing G, extrapolated to σ > 0 at
G = ∞, i.e. at G-1/2 = 0. Intermediate to large G samples showed greater σ de-
crease with increasing G, generally indicating extrapolation to σ ∼ 0 at G -1/2 = 0.
Carniglia suggested that the failure mechanism for the finer grain branch
was microplasticity, hence referring to this as the Petch or Hall–Petch regime,
and that for the large G branch it was Griffith flaw failure with the flaw dimen-
sions being ∼ those of the grain size. The change between mechanisms was at-
tributed to stresses for failure from flaws being higher than the stresses to
activate microplastic failure at fine G, until G became sufficiently large to allow
flaw failure at stresses below those needed for microplasticity. This provided not
only a possible explanation for the two-branch character of the σ – G-1/2 plots
commonly observed but also for variability in the intersection of the σ – G-1/2
branches. Thus, as the quality of surface finish improved in specimens lacking
other major sources of flaws e.g., pores, the larger G branch would extend to
finer G before microplasticity took over. A few investigators, such as Kirchner
and Gruver [10] and Rice [3, 11–13], suggested contributions of other intrinsic](https://image.slidesharecdn.com/mechanical-properties-of-ceramics-and-composites-120303143122-phpapp01/85/Mechanical-properties-of-ceramics-and-composites-129-320.jpg)
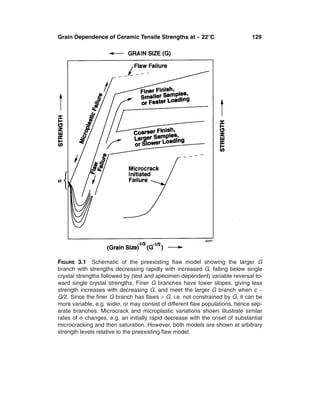
![130 Chapter 3
factors such as elastic anisotropy (EA) and thermal expansion anisotropy (TEA).
Rice, with others, also considered microplasticity (including twinning as a possi-
bility in some materials) but subsequently broadened consideration to include
extrinsic factors such as surface finish, preferred orientation, and pore and grain
characteristics and heterogeneities (e.g. of larger grains).
As the range of materials, microstructures, and testing broadened, four fac-
tors ended consideration of microplasticity as a broad mechanism controlling the
G dependence of ceramic tensile strengths. First, the intercept strength levels for
finer G branches were typically lower, e.g. by an order of magnitude, than the
expected stresses for activating microplasticity in many materials, e.g. Al2O3
(one of the key materials in Carniglia’s review). Second, while local stresses
from EA and TEA can be substantial, they were of uncertain levels and spatial
extents to make up the difference between the strength intercepts and the yield
stresses. Further, they are only pertinent to some materials and vary substantially
from material to material. Third, TEM examination of sharp cracks in single
crystal and polycrystalline Al2O3 at room temperatures showed no evidence of
associated slip [14]. While the possibility of crack-twin relations was not ad-
dressed, twinning is pertinent to only a limited and uncertain (more likely noncu-
bic) set of materials. Fourth and most fundamental was subsequent evaluation,
with fractography being a key tool, showing that typically both branches result
from flaw failure [2, 3, 11–13].
Thus it will be shown that the finer and larger σ – G-1/2 branches typically
arise from changes in the flaw to grain size ratio, with strength levels of both
finer and larger G branches being determined by flaw sizes (Fig. 3.1). However,
there can be two important variations of the normal flaw controlled σ – G-1/2 be-
havior. First, some room temperature failure is determined by microplasticity in
a limited number of ceramics and related materials (and becomes somewhat
more common and extensive as temperature increases, Chap. 6). However,
where this occurs, the large grain branch is the regime of this behavior, not the
finer grain branch as proposed by Carniglia. Further, as the stress for microplas-
ticity increases, e.g. as G decreases, there is often a switch to flaw failure when
preexisting flaw dimensions are ∼ those of the grains, which is identical to the
finer grain flaw failure (Fig. 3.1). The other deviation from the now-established
normal two-branch flaw controlled strength behavior occurs with substantial mi-
crocracking.
Two aspects of σ – G behavior should be stressed. First, the above two-
branch σ – G-1/2 behavior is due first to changing c/G ratios and the resultant
grain boundary or single crystal polycrystalline toughness transition, and secon-
darily, at least for machining flaws, to impacts of grain parameters, especially
size, and local hardness, elastic moduli, and toughnesses on flaws that are intro-
duced and determine strength. This is contrary to the focus of most mechanical
property studies on toughness, as measured by large cracks, as the mechanism of](https://image.slidesharecdn.com/mechanical-properties-of-ceramics-and-composites-120303143122-phpapp01/85/Mechanical-properties-of-ceramics-and-composites-131-320.jpg)
![Grain Dependence of Ceramic Tensile Strengths at ∼ 22°C 131
controlling σ and its microstructural dependence. Second, as comparison of this
and the previous chapter shows, much of the G dependence of strength is incon-
sistent with that of large crack toughness, especially at larger G, since much of
the larger crack toughening is precluded by the above process.
Beyond the above historical summary of the grain dependence of failure
mechanisms, this review first addresses such mechanisms in more detail and
then provides an extensive summary of σ – G-1/2 data, mechanisms, and parame-
ters, updating and extending previous reviews [2, 3, 11, 13]. This starts with ma-
terials exhibiting some known or expected microplastic control of strength, often
with a transition to flaw failure. Next, σ – G-1/2 behavior for cubic and then non-
cubic materials, where strength is generally controlled by preexisting flaws, is
presented. In both cases oxide materials are reviewed first. Then pertinent mi-
crostructural effects are addressed, including grain shape and orientation as well
as moderate levels of impurities and especially additives (bodies having higher
levels of second phases are addressed later as composites, Chaps. 8–12). The ba-
sic microstructural question of which G to use, specifically the average or the
maximum, is also addressed, showing that while tensile failure is a weak link
process suggesting use of the maximum G, since it is associated with lower
strengths, this is a serious oversimplification. Blind application of this (i.e. with-
out other input, especially fractography) leads to errors and distortions, since
grains by themselves are not flaws. At the other extreme, behavior of ceramics
with nanoscale grains is discussed, including neglected but often significant ef-
fects of second phases commonly left from frequent unusually low processing
temperatures used to obtain bodies with very fine grains. Surface finish effects,
i.e. of machining flaws and effects versus as-fired surfaces, and test issues such
as specimen size and shape along with loading and environmental effects and
their interactions, are discussed. Then more detailed evaluation of the σ – G-1/2
model is given, followed by a comparison of strength-toughness-grain size be-
havior and discusson of mechanical reliability, primarily via Weibull moduli.
B. Mechanisms, Parameters, and Analysis
Consider now more specific aspects of the σ – G -1/2 brittle fracture model (Fig.
3.1), whose development and interpretation arose mainly from fractographic
study of machining flaws revealing their variation relative to G [2, 3, 11–13].
This showed that, in relatively dense machined ceramics, machining flaws
formed in the surface region were the dominant or exclusive source of failure.
Such flaw failure in finer G bodies clearly disproved Carniglia’s model of mi-
croplastic control of the finer G branches. To a first approximation, the depth of
such flaws for a given material and machining condition has no dependence on
grain size, i.e. did not change significantly in size with G (nor between most ce-
ramics). (However, as discussed later, there is some second-order variation of c](https://image.slidesharecdn.com/mechanical-properties-of-ceramics-and-composites-120303143122-phpapp01/85/Mechanical-properties-of-ceramics-and-composites-132-320.jpg)
![132 Chapter 3
with material and microstructural parameters.) Thus failure of machined finer
grain bodies was due to machining flaws whose size, c, was > G/2 (since flaw
size is measured by a radius and grain size by a diameter). Typically two flaw
populations are generated in machining, one parallel and the other perpendicular
to the direction of the abrasive particle motion, with the depths of both being
similar, but the former being substantially elongated and the former being ∼ half
penny cracks [12, 13, 15–22]. This difference in flaw shape translates to two lev-
els of strength of the finer G branches as a function of stress direction relative to
the machining direction, again supporting the above model and concepts.
Other flaw sources may have similar or different trends with G. An impor-
tant flaw population that is produced in the body and can change, e.g. shift, σ –
G -1/2 behavior (Fig. 3.1) is that of microcracks. Surface flaws from contact dam-
age or particle impact/erosion may often be similar or ∼ proportionate in size to
machining flaws, but this needs to be established. Some processing flaws, e.g.
some larger pores, may fit this trend, and some flaws may not, e.g. other pores or
cracks from thermal stresses (Chap. 6). However, even in such cases, failure to
account for flaws causing failure and basing analysis only on toughness can be
misleading, e.g. as shown by evaluation of effects of preferred orientation on
strength of hot pressed Si3N4 (Chap. 2, Sec. III.H).
Another important surface finish condition that often gives similar trends
as machining as a function of G, at least over the normal G range, is failure of
samples with as-fired surfaces, e.g. as for some ceramic parts and tests, espe-
cially for fibers [2]. This is consistent with Coble’s evaluation showing grain
boundary grooves from firing (or annealing) acting as sharp flaws whose size is a
reasonable fraction of the grain size, e.g. over the range of G/15 to ∼ G [23].
Thus at finer G such flaws are < G, in part due to the fine G and generally less se-
vere grooving from less severe firing conditions, which means that several con-
nected grooves along different boundaries act as the failure causing flaws. As G
increases, grooving also generally increases, and fewer connected grooves are
needed to form a failure causing flaw, reaching a point where failure may occur
from a groove along part or all of a single grain, i.e. analogous to the above ma-
chining flaw case, as is discussed next.
Typical flaw populations have c > G at finer G, and c does not increase
substantially as G increases, so c must become ∼, then progressively, < G/2 (1/2
arises since c is measured as a radius and G a diameter) progressing from the
finer G branch, its intersection with the larger G branch when the flaws ∼ en-
compass individual surface grain, then the larger G branch where the initial
flaw size is < G/2. However, while such flaw–grain relations define much of the
behavior, there are other issues. The first of three sets of issues are which G to
use, especially an average, Ga, or the maximum, Gm, as used by some [24–27],
and whether there is any G dependence in the finer G branches, i.e. whether the
slope of the finer G branch = 0 as claimed by those proposing the use of Gm. It](https://image.slidesharecdn.com/mechanical-properties-of-ceramics-and-composites-120303143122-phpapp01/85/Mechanical-properties-of-ceramics-and-composites-133-320.jpg)
![Grain Dependence of Ceramic Tensile Strengths at ∼ 22°C 133
will be shown that the finer G slope of 0, while possibly having pertinence in
some limited cases, is not the general case, since there is generally some to sub-
stantial decrease in strength as G increases along finer G branches. Second is
that while polycrystalline fracture toughness values are appropriate at finer G, a
transition to single crystal (Figure 2.15) or grain boundary toughnesses must
occur as the intersection of the large and finer G branches is approached or
reached [28]. The slope of the larger G branch is later shown to be between
polycrystalline and single crystal toughness values. The third issue is contribu-
tions of intrinsic effects, such as slow crack growth, EA and TEA, and extrinsic
effects, e.g. of secondary phases. Several, or all, of these may affect both
branches and their intersection(s), e.g. SCG due to differing effects of grain size
and of inter- versus transgranular fracture, but they are also probably important
in a less recognizd but clearly established occurrence, namely large G strengths
lower than those of the lowest strength crystal orientation with comparable sur-
face finish. Thus as G increases so failure can progressively only occur from
fewer and fewer individual grains or grain boundaries, strengths can decrease
below those of single crystals with comparable surface finish due to effects of
TEA and EA stresses, as well as residual pores or phase, especially at grain
boundaries [2, 3, 13]. Such large G effects are likely to depend substantially on
specimen size and shape as well as the nature of the stress, e.g. true tension ver-
sus flexure, since these will affect the limited statistics of grain structure im-
pacting failure.
While some of the above effects at large G have limited documentation
(presented later), there is clear evidence of significant effects of extreme TEA at
finer G. Thus an important flaw population that leads to a substantial variation in
the σ–G-1/2 is for bodies with extensive microcracking, such as that resulting
from high TEA, e.g. in MgTi2O5 and Fe2TiO5 (Figs. 3.1, 3.23). Subsequent mi-
crocracking results in much faster decreases in strength as G increases above the
critical value Gs for microcracking [per Eq. (2.4)], since the effective flaw size is
increasing due to more and larger microcracks as G increases, but then the de-
crease begins to saturate. Such effects are typically paralleled by similar initially
rapid and then decreasing reductions in elastic moduli, again due to saturation of
the microcracking process.
The above fractographic studies and resultant flaw model development
partly overlapped with conceptual arguments based on σ–G data. Thus aspects
of this model, i.e. finer G branches due to c > G/2, the higher slope large G
branch, and higher single crystal strengths than for some large G bodies were
schematically indicated by Emrich in his review of crystallized glasses [29].
Similarly, finer and larger G branches both being due to flaw failure with the two
branches intersecting when c ∼ G/2 was proposed by Rhodes and Cannon [30].
Bradt, Tressler, and students [24–26] also subsequently discussed such a model
in conjunction with their surface finish studies.](https://image.slidesharecdn.com/mechanical-properties-of-ceramics-and-composites-120303143122-phpapp01/85/Mechanical-properties-of-ceramics-and-composites-134-320.jpg)
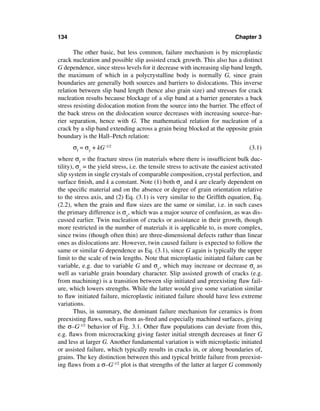
![Grain Dependence of Ceramic Tensile Strengths at ∼ 22°C 135
extrapolate to σ values well below any realistic σy values, e.g. 0, while mi-
croplastic failure extrapolates to σy at G= ∞ (G -1/2 = 0). Thus it is typical for
larger grain bodies having flaw failure at strengths less than those for compara-
bly finished single crystals oriented for the lowest strength. Conversely, data re-
flecting microplastic caused failure have large grain strengths that extrapolate to
σy and thus do not fall much below single crystal strengths. Brittle fracture initi-
ated by microplasticity is typically in competition with failure from preexisting
flaws, with slip assisted crack growth being a transition between these two
mechanisms. Flaw failure is favored by higher stresses for finer G fracture and
larger preexisting flaws, e.g. from harsher machining, handling, etc., or increased
severity due to second phases or pores. Note that as G decreases, the stress for
microplastic failure increases in a similar fashion as for flaw initiated failure in-
creases (e.g. since both are ultimately controlled by cracks). Thus it is both logi-
cal and observed that at some finer G, competition between microplastic and
flaw initated failure shifts depending on material and surface finish. However, in
the absence of significant extrinsic effects, this change should also occur when
the size of microplastically introduced crack is ∼ G/2, i.e. as for the flaw model
(Fig. 3.1).
II. CERAMICS AND RELATED MATERIALS WITH KNOWN
OR EXPECTED MICROPLASTIC INITIATED FAILURE
Some softer, less refractory ceramics and related materials often exhibit macro-
scopic yield (Fig. 3.2A). NaCl macroscopic yield stresses of Stokes and Li [11,
31] lie on, or slightly below, while their fracture stresses lie slightly above, that
of KCl [32]. CdTe may or may not exhibit yield before fracture [33–35]. Some-
what harder, stronger materials like PbTe [36] and CsI [37], while not showing
macroscopic yield, extrapolate to σ values (at G= ∞) that are probably ∼ their
yield stresses. Similarly, ZnSe [38, 39] (large G) extrapolation to σ ∼ 15–30 MPa
at G= ∞ (Fig. 3.2B) may indicate microplastic control of σ (e.g. by twinning).
Purity, processing, and testing are all probably factors in σ differences.
Previous data [40–43] for hot pressed and sintered (commercial) BaTiO3
shows two σ–G-1/2 branches (Fig. 3.3A), with the large G data for unalloyed (and
some alloyed) samples extrapolating to single crystal strengths [41]. This is
taken as evidence of microplastic controlled failure given yield shortly preceding
fracture of (“butterfly”) BaTiO3 crystals and associated substantial birefringence
around their fractures (Fig. 3.3B). The higher σ of BaTiO3 hot pressed with 1%
LiF + 2% MgO at larger G (hence higher heat treatment for more homogeniza-
tion) also supports microplastic control via indicated alloying effect [41], as do
other indications of microplasticity in BaTiO3 [44, 45]. Statistical analysis of
much of the data shows the fine G branch having a slope > 0, both above and be-
low the Curie temperature [42], but with higher strengths (by ∼ 50%) above the](https://image.slidesharecdn.com/mechanical-properties-of-ceramics-and-composites-120303143122-phpapp01/85/Mechanical-properties-of-ceramics-and-composites-136-320.jpg)
![136 Chapter 3
FIGURE 3.2 Yield or failure stress versus G-1/2 for materials of known or probable
microplastic controlled failure (A) Csl [37], KCl [32], PbTe [36], and CdTe [33]; (B)
ZnSe data of Roy and Natale for various hot-pressed (H) and PVD and CVD bod-
ies from a previous survey [38, 39]. Vertical and horizontal bars represent stan-
dard deviations.
Curie temperature where it is in a cubic structure with no microstructural
stresses.
Strengths of dense CaO, from hot pressing [46] or recrystallizing single
crystals (via press forging or hot extruding) [47, 48] all gave single σ – G-1/2
branches, with different slopes for different bodies (Fig. 3.4). All extrapolate to σ
= 20–35 MPa at G = ∞, reasonably consistent with macro yield stresses of 40–45
MPa for CaO crystals having some probable solution hardening, suggesting
probable microplastic control of strength. This is reinforced by some strength in-
crease for specimens tested with as-sanded (and more frequent internal fracture
origins, Fig. 3.4B) versus as-annealed surfaces indicating surface work harden-
ing and tests at ∼ 1100 and 1300°C showing limited strength decreases, fre-
quently with macroscopic yield preceding fracture, but maintaining transparency
[47, Chap. 6]. It is also indicated by fractography studies of recrystallized CaO
single crystal samples (with ∼ 100% transgranular fracture, Fig. 3.4B-D) and](https://image.slidesharecdn.com/mechanical-properties-of-ceramics-and-composites-120303143122-phpapp01/85/Mechanical-properties-of-ceramics-and-composites-137-320.jpg)
![Grain Dependence of Ceramic Tensile Strengths at ∼ 22°C 137
FIGURE 3.3 BaTiO3 data indicating microplastic control of strengths at larger
grain size in dense bodies. (A) strength versus G-12 for hot-pressed (with or with-
out additions of LiF + MgO as shown), sintered (commercial, with machined sur-
faces), and single crystal bars. Vertical bars are standard deviations; numbers in
parentheses represent the number of tests, and numbers at the bottom of the
bars the % porosity. Note data for pure bodies extrapolating to single crystal
strengths (which are shortly preceded by yielding). (Data after Rice, Pohanka,
and colleagues [40–43].) (B) and (C) Transmitted, polarized light, lower and
higher magnification micrographs of failed crystal bend bar showing substantial
birefringence of respectively a coarser (B) and fine (C) scale indicative of plastic
deformation (the X cut by the fracture in B) was associated with observed yielding
preceding failure [41].
probable slip bands at fracture origins [46], similar to (unetched) origins in MgO
(Fig. 3.6), including their internal nature indicating work hardening of surface
grains from machining [48, 49].
Substantial testing of (transparent) MgO as hot pressed, annealed, or hot
extruded (giving a <100> axial texture) showed primarily single σ – G-1/2
branches with significant slope increases in the respective order listed [48,
50–52] (Fig 3.5). All extrapolate to σ ∼ 70 MPa at G = ∞, less than typical single](https://image.slidesharecdn.com/mechanical-properties-of-ceramics-and-composites-120303143122-phpapp01/85/Mechanical-properties-of-ceramics-and-composites-138-320.jpg)
![138 Chapter 3
B C
FIGURE 3.3 Continued.
crystal flexure strengths of ∼ 150 MPa, but consistent with higher purity crystal
yield stresses of ∼ 75 MPa [46, 48]. Such indications of microplastic controlled
strength at large G are reinforced by fractographic observations showing internal
failures (attributed to work hardened surface grains) [48–52], and especially sub-
stantial identification of slip bands blocked at fracture origins on both unetched
and etched fractures (Figs. 6A and B). This data is generally consistent with sub-
stantial data for hot pressed and annealed MgO [25, 53–55] and sintered MgO
[56, 57], mostly with machined surfaces, which in turn reinforces the above
trends and mechanisms. Thus Evans and Davidge’s (transparent) hot pressed and
annealed MgO with chemically polished versus as-sawn surfaces [55] showed
respectively higher and lower σ at larger G reflecting respectively microplastic
and flaw failure as shown by respective intercepts at ∼ the yield stress and 0.
Harrison’s dense [56], sintered MgO with various machining straddles the hot
pressed and annealed curves of Rice with a trend for higher strength with finer
surface finish, as well as probable branching to less G dependence of σ at finer G
(e.g., at <∼ 10 µm) due to a transition to flaw failure at finer G. Spriggs and Vasi-
los’ [53, 54] and Nishida et al.’s [57] sintered MgO data support this, indicating a
decreased, but >0, finer G branch slope. Such a transition is also indicated by ef-
fects of additives [52], and greater reduction of machined versus annealed
strengths at finer G (5–10 µm). Subsequent studies [15] clearly showed (1) sig-](https://image.slidesharecdn.com/mechanical-properties-of-ceramics-and-composites-120303143122-phpapp01/85/Mechanical-properties-of-ceramics-and-composites-139-320.jpg)
![Grain Dependence of Ceramic Tensile Strengths at ∼ 22°C 139
A
FIGURE 3.4 Strength and fracture of dense CaO indicating microplastic controlled
strength at ∼ 22°C. (A) Strength versus G-1/2 for various bodies hot-pressed [46]
(with or without LiF additions) with various annealing as well as of single crystals
and bodies recrystallized from these by press forging or hot extrusion [47, 48].
Note intersection of the stress axis at ∼ 30–40 MPa in good agreement with the
yield stress for CaO crystals, with a higher slope for the extruded material (tested
parallel with the <100> axial texture), and similar results for bars tested with as-an-
nealed or annealed and sanded surfaces. (B–D) Fracture origins of dense, recrys-
tallized CaO test bars. In (B) note the internal fracture origin (attributed to surface
work hardening) and mist and hackle starting somewhat before the crack reached
the grain boundaries. (C) and (D) Fracture origins at or near the surface in surface
grains. In (C) note the fracture step (at ∼ 45° to the surface) indicating a slip band,
i.e. similar to MgO failures (where slip was corroborated by dislocation etching
which does not exist for CaO), and the onset of mist and hackle when the crack ∼
reached the grain boundary in this smaller G body. In (D), a larger G body; note
the onset of mist and hackle ∼ 1/2, way through the larger grain of origin.](https://image.slidesharecdn.com/mechanical-properties-of-ceramics-and-composites-120303143122-phpapp01/85/Mechanical-properties-of-ceramics-and-composites-140-320.jpg)

![Grain Dependence of Ceramic Tensile Strengths at ∼ 22°C 141
FIGURE 3.5 Strength of dense MgO versus G-1/2 from various studies, including
substantial earlier data of Rice for as-hot-pressed (AS HP), hot pressed and an-
nealed (HP & A) and hot extruded [48, 50–52] (all with as-sanded surfaces); ear-
lier data of Vasilos and colleagues [53, 54] as well as data for single crystals
as-cleaved, machined, or recrystallized [47, 48] or translucent-transparent bodies
as hot-pressed (with different grinding directions [13] relative to the tensile axis,
TA) or hot-pressed and annealed. Also shown are hot pressed data of Bradt et al.
[25] (ground or lapped perpendicular to the tensile axis with grits as shown) and
Evans and Davidge [55] for transparent MgO (with as-sawn surfaces); and sin-
tered data of Harrison [56] (with various surface finishes), as well as more recent
data of Nishida et al. [57].
nificant σ effects of grinding direction, especially at finer G (3–20 µm), and (2)
much lower slope (and lower σ) finer G branches. Such finer G branches were
further (1) shown by fractography separating edge and tensile surface failures
[17] (i.e. similar to Al2O3 studies) and (2) indicated in more recent analysis of
MgO data, especially that of MgO with second phases (much of them at grain
boundaries) [52]. Similarly Bradt et al.’s [25] tests of hot pressed MgO ground](https://image.slidesharecdn.com/mechanical-properties-of-ceramics-and-composites-120303143122-phpapp01/85/Mechanical-properties-of-ceramics-and-composites-142-320.jpg)
![142 Chapter 3
FIGURE 3.6 Fractographs of recrystallized MgO samples showing fracture initia-
tion associated with slip bands blocked at grain boundaries. (A) Fracture origin
from two transgranular fractured grains showing etched slip band across the left
grain terminating at the origin, which is internal, as was typical for machined sur-
faces due to work hardening of the surface grains. (B) Less common origin from
grain boundary surface, again with associated slip bands (arrows) and internal lo-
cation. (From Ref. 52, After Rice [52] published with the permission of the Journal
of the American Ceramic Society.)](https://image.slidesharecdn.com/mechanical-properties-of-ceramics-and-composites-120303143122-phpapp01/85/Mechanical-properties-of-ceramics-and-composites-143-320.jpg)
![Grain Dependence of Ceramic Tensile Strengths at ∼ 22°C 143
parallel or perpendicular to the tensile axes with various grit sizes again indicate
lower strengths with coarser grits, especially at finer G. These all indicate a tran-
sition to preexisting flaw control of strength at finer G and more competition be-
tween failure from such flaws and microplasticity at larger G, with harsher
surface finish and more residual porosity or other phases shifting the balance in
favor of flaws.
Extensive fractography of specimens from hot deformed, recrystallized
MgO showed fracture origins from slip bands (Fig. 3.6). Some of these were im-
plied based on expected association with cleavage steps [48, 52]. Etching cor-
roborated such cleavage step–slip band association as well as frequent internal
fracture origins being due to work hardening of surface grains due to mechanical
finishing [49].
III. CUBIC CERAMICS AND RELATED MATERIALS FAILING
FROM PREEXISTING FLAWS
A. Cubic Alkaline Earth Halides and Oxides
While most, if not all, dense alkali halides show microplastic controlled strength
(and often some macroplasticity), alkaline earth halides have shown no evidence
of this at room temperature [58]. Single crystals and large G bodies that have
been investigated, mainly CaF2 and some BaF2 and SrF2, have shown three char-
acteristics of failure from preexisting flaws. The first is greater strength sensitiv-
ity to surface finishing than expected for microplastic controlled strength, e.g.
doubling single crystal and fully dense (press forged) polycrystal strengths [59,
60]. The second is substantial identification of flaws at fracture origins that were
consistent with fracture stress and toughness (∼ 0.4 MPa·m1/2) values [61]. Third
is some increase in strengths with limited decreases in G (e.g. to 100–200 µm) as
well as some strengths higher and lower than single crystals at large G (∼ 1 cm in
test bars from fusion cast billets with bar dimensions ∼ 1/2 cm). Fractography
showed clear cases of single crystal fracture mirrors, i.e. mist and hackle forma-
tion within a single grain (Fig. 3.7) [61], showing that failure occurred entirely
within such a large grain rather than propagating subcritically into surrounding
grains.
Limited data exists for some other common single oxide (machined) ce-
ramics that is not inconsistent with the flaw model or provides some support for
it. Thus NiO strength data of Spriggs et al. [62] and of Harrison [63] individually
are not inconsistent with the flaw model (but are difficult to compare since they
used respectively diametral and flexure tests). However, both showed clear devi-
ations to lower strengths at finer grain sizes achieved, e.g. respectively 0.5–1.5
and < 5 µm by higher pressure hot pressing or hot pressing versus sintering. Thus
Spriggs et al.’s bodies hot pressed at higher pressures (70–140 MPa) only had](https://image.slidesharecdn.com/mechanical-properties-of-ceramics-and-composites-120303143122-phpapp01/85/Mechanical-properties-of-ceramics-and-composites-144-320.jpg)
![144 Chapter 3
FIGURE 3.7 Optical fractograph of a higher strength, larger grain, dense CaF2
from a surface (probably machining) flaw near the test bar edge, photo bottom
center, at start of edge rounding. Note grain boundary near right photo edge and
the onset of mist and hackle within the grain of origin.
about 2/3 the strength, ∼ 240 MPa (P ∼ 0, G ∼ 1.5 µm) versus samples hot
pressed at lower pressures, despite the latter having larger G, e.g. ∼ 3-fold. Such
lower strengths with finer G as higher hot pressing pressures were used were also
shown by Spriggs et al. [64] for other oxide ceramics, Al2O3, Cr2O3, TiO2, and
MgO, as is discussed in Sec. V.A.
ThO2 data of Knudsen [65] illustrates a typical problem with much, partic-
ularly earlier, data, namely substantial P, especially at finer G. However, correc-
tion to P= 0 gives results reasonably consistent with the flaw model, e.g.
suggesting a finer G branch of lower but >0 slope transitioning to the larger G
branch at G ∼ 10–15 µm (Fig. 3.8). Even more limited uniaxial flexure data [28,
67] for dense, transparent sintered Y2O3 shows decreasing strength with increas-
ing G, as does biaxial flexure data of Rhodes et al. [68]. Both studies clearly
show failure initiation in larger G bodies occurring from machining flaws sub-
stantially smaller than the grains, even with the size of surface grains typically
being substantially reduced by machining (Fig. 3.9A and B). On the other hand,](https://image.slidesharecdn.com/mechanical-properties-of-ceramics-and-composites-120303143122-phpapp01/85/Mechanical-properties-of-ceramics-and-composites-145-320.jpg)
![Grain Dependence of Ceramic Tensile Strengths at ∼ 22°C 145
FIGURE 3.8 Strength versus G-1/2 for sintered ThO2 at 22°C of Knudsen corrected
for variable porosity (% shown as superscripts) using the exponential relation e-bP,
with b ∼ 4.4 per his determination [65]. Vertical bars = standard deviations, sub-
scripts = number of tests averaged. Note good consistency between various data
points of differing P, as well as reasonable agreement with the one data point of
Curtis and Johnson [66]. Also included are data on the same ThO2 at 1000°C [65]
and for two grain sizes of dense (transparent)Y2O3 at 22°C [28, 67]. Bars are the
standard deviations, and subscripts or numbers adjacent to data points the num-
ber of tests.
fractography of the finer grain body showed machining flaw fracture origins
somewhat larger than G, indicating they are from the finer G branch, but near its
intersection with the larger G branch.
Diametral compression strengths of UO2 by Kennedy and Bandyopadhyay
[69] for G ∼ 2–20 µm showed a finer G branch with limited, but >0, slope, and
probably transitioning to the larger G branch at G ∼ 10–20 µm, whether strengths
are corrected for the limited P or not. Flexural strengths from three other studies
with G ∼ 8–50 µm [70–73], again with or without limited corrections for limited
P, are more consistent with each other than the diametral strength values, being
higher than the latter by 2–3-fold. These studies also indicate possible transitions
to a larger G branch in the range of G ∼ 10–20 µm, which would be consistent](https://image.slidesharecdn.com/mechanical-properties-of-ceramics-and-composites-120303143122-phpapp01/85/Mechanical-properties-of-ceramics-and-composites-146-320.jpg)
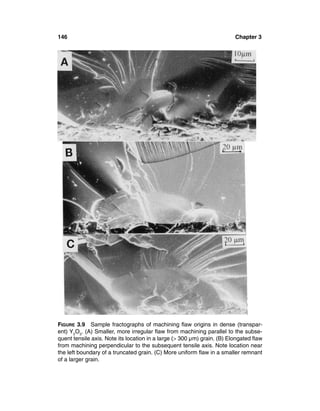
![Grain Dependence of Ceramic Tensile Strengths at ∼ 22°C 147
with strength being controlled by toughness values between those for grain
boundaries or single crystals and polycrystalline values.
Previous compilations [74, 75] of the limited data for nearly, or fully, cubic
ZrO2 with CaO, MgO, or Y2O3 stabilizers showed a substantial decrease in
strength with increasing G over ∼10 µm, consistent with this data being on the
larger G branch as expected (Fig. 3.10A). More recent limited data of Adams et
al. [76] (11 wt% Y2O3, G ∼ 1–50 µm), though generally of lower strengths (in
A
FIGURE 3.10 Strength and fracture of fully stabilized, machined cubic zirconia
bodies. (A) Strength–G-1/2 data for fully and some partially stabilized bodies (see
Fig. 3.21 for TZP data), as well as similarly finished, fully stabilized crystals of the
same or similar compositions [80]. (B) Optical fractograph of a fracture origin from
a smaller surface grain (surrounded by somewhat larger, but still normal, mostly
transgranularly fractured, intermediate size grains) and the fracture mirror
(brighter region) in an intermediate to larger grain ZrO2 + 1lw/o Y2O3 body. (C)
SEM fractograph of a machining flaw fracture origin in a CZ crystal. (D) SEM of
fracture origin (center of photo) in a commercial PSZ (Zircoa 1027 with 2.8 w/o,
8.1 m/o, MgO) from an individual grain boundary facet with common excess
tetragonal phase and some pores [82]. (Photos (B) and (D) published with the
permission of the ASTM [21].)](https://image.slidesharecdn.com/mechanical-properties-of-ceramics-and-composites-120303143122-phpapp01/85/Mechanical-properties-of-ceramics-and-composites-148-320.jpg)

![Grain Dependence of Ceramic Tensile Strengths at ∼ 22°C 149
part reflecting no correction for the 1–8%, often heterogeneously distributed
porosity, especially at larger G), clearly extends into the finer G branch, e.g. be-
ing consistent with an intersection of the branches at G ∼ 15 µm. This data and
effects of porosity on it are corroborated by data for transparent cubic ZrO2 (+10
m/o TiO2 and 7 m/o Y2O3) of Ahlbom et al. [77] falling along or slightly above
the upper bound of Adams et al.’s data. Data of Hague [78] and King and Fuchs
[79], having the highest porosity levels (to ∼ 15%, but mostly ≤ 8%), is (possibly
over) corrected to zero porosity via the exponential relation e-bP, using b = 8, ex-
cept at the lowest stabilizer contents). Again, note polycrystalline strengths ex-
tending substantially below earlier [74] and later, higher quality fully stabilized
single crystals of the same or similar compositions (mostly with Y2O3) and sur-
face machining [80]. PSZ polycrystalline data (i.e. for cubic grains with tetrago-
nal precipitates) shows similar larger G dependence, but with higher strengths,
as expected from transformation toughening, and thus steeper slopes [81–83].
(Such PSZ polycrystalline strengths are well below those for PSZ crystals of
similar compositions and surface finishes, but are consistent with strengths of
TZP bodies, Fig. 3.21). Fractography showed fracture initiation in intermediate
G Y-CZ from grains or defects on the scale of the typical cubic grains (Fig.
3.10B and C) and fracture mirrors consistent with such grain scale flaws [21].
Grain scale origins from individual grain boundary facets (with some pores) are
found in commercial PSZ (Fig. 3.10D), again showing similarities between cu-
bic and PSZ [83].
Extensive MgAl2O4 data of Bailey and Russell [84, 85] and others in an
earlier survey [86] and more recent work [87–92] show two sets of σ–G-1/2
branches, with fine G branches being determined by various fabrication, e.g.
finishing, parameters (Fig. 3.11). Though there is considerable variability, all
fine G branches show >0 slopes. Most if not all the significant variations of σ
with stoichiometery were via G [84, 85], e.g. Bailey and Russell’s MgO rich
MgAl2O4 showed G decreasing ∼ 10·fold with corresponding σ increases with
increasing excess MgO [85]. The data clearly shows σ (even for highly
translucent to transparent specimens) in the large G region extending down to
∼ 40–70% that of low index orientation of stoichiometric single crystals with
similar surface finishes. This is also true for Gentilman’s [92] data for fusion-
cast transparent (2Al2O3·1MgO) large (2–5mm) G specimens tested with grain
boundaries perpendicular to the tensile surface. Fig. 3.12 shows one set of the
author’s data from Fig. 3.11 along with specific fracture origins. Data of Hou
and Kriven [93] for CaZrO3 also shows a two-branch behavior. A single data
point of Moya et al. [94], is reasonably consistent with their data but probably
reflects common differences in preparation, testing, and characterization (espe-
cially G measurement).
Note that there is generally no significant inconsistency between the G
dependence of toughness and strength for most cubic materials where there is](https://image.slidesharecdn.com/mechanical-properties-of-ceramics-and-composites-120303143122-phpapp01/85/Mechanical-properties-of-ceramics-and-composites-150-320.jpg)
![150 Chapter 3
FIGURE 3.11 MgAl2O4 σ–G-1/2 data. The curve marked Bailey and Russell reflects
not only their data [84, 85] but also other data of an earlier survey [86]. Subse-
quent data of Chay et al. [87], Rhodes et al. [88], Jacobs [89], Bakker and Lind-
say [90], and Rice [13, 67] are shown corrected to 0 porosity using b=3, 6, and 8
(respectively low, middle, and high points of vertical bars); the limited % porosity
of Rice’s specimens is shown next to those data points. Data of Kanai et al. [91],
Gentleman [92], and Rice are shown as measured with machined surfaces. Verti-
cal bars are the standard deviation, and the numbers underneath them, the num-
ber of tests; S=sintering, H=hot-pressing. While there is considerable uncertainty
in the specific finer G slopes of all of the data (except that represented by Bailey
and Russell), all such slopes are > 0.](https://image.slidesharecdn.com/mechanical-properties-of-ceramics-and-composites-120303143122-phpapp01/85/Mechanical-properties-of-ceramics-and-composites-151-320.jpg)
![Grain Dependence of Ceramic Tensile Strengths at ∼ 22°C 151
A
FIGURE 3.12 MgAl2O4 strength and fracture. (A) σ–G-1/2 data for dense sintered
and hot pressed MgAl2O4 from an earlier survey with fractographic inserts show-
ing specific fracture origins in the strength and G ranges circled. (After Rice [12],
published with the permission of Plenum Press.) (B) Fracture origin from a ma-
chining flaw in a stoichiometric MgAl2O4 crystal machined parallel with the subse-
quent stress axis normal to (100), on which fracture occurred at ∼ 370 MPa. Note
the mist and hackle at the left edge of the photo (and in the top left insert of (A))
indicating that the failure crack had become catastrophic well before it exited the
large grain.](https://image.slidesharecdn.com/mechanical-properties-of-ceramics-and-composites-120303143122-phpapp01/85/Mechanical-properties-of-ceramics-and-composites-152-320.jpg)
![152 Chapter 3
FIGURE 3.12 Continued.
reasonable data, e.g. for Y2O3 (Figure 2.12) and MgAl2O4 (Figure 2.13), which
show limited or no toughness dependence on G. The limited decrease of
strength with increasing G in the finer G branch is explained by effects on flaw
size in Section VI.A and the greater strength decrease at larger G by the transi-
tion to single crystal or grain boundary toughness control (Chap. 2, Sec. III.E;
(Chap. 3) Sec. VII.A). Thus this data is clearly consistent with the two-branch
model (Fig. 3.1). Such comments also apply to much of the failure of materials
having limited plastic induced fracture, especially those tranisitioning to preex-
isting flaw failure, e.g. MgO (Figs. 2.12, 3.5). However, SiC, addressed in the
following section, shows serious discrepancies between the G dependences of
toughness (Figure 2.14) and strength (Fig. 3.13) similar to those often found for
noncubic materials discussed later.
B. Cubic Carbides and Refractory Metals
The most extensive data for a cubic nonoxide is for SiC (Fig. 3.13). Though some
data is for bodies of some to all α-SiC content which is noncubic, it has limited
anisotropy and is thus generally consistent with cubic (β) data. Previous surveys
[3, 11, 13] of earlier SiC data [95, 96] clearly established part of the large G
branch and finer G branches, based on Ga, generally agreeing, as does that of](https://image.slidesharecdn.com/mechanical-properties-of-ceramics-and-composites-120303143122-phpapp01/85/Mechanical-properties-of-ceramics-and-composites-153-320.jpg)
![Grain Dependence of Ceramic Tensile Strengths at ∼ 22°C 153
A
FIGURE 3.13 Strength versus G-1/2 for various, mostly β-, SiC bodies at ∼ 22°C.
(A) Data for mostly dense sintered or hot pressed SiC bodies, including bounds
from earlier surveys [3, 11, 13], along with earlier [95–97] and more recent data
[98, 99], showing different finer G branches and one larger G branch consistent
with the expected model. This is also supported by data of Larson et al. [100] (not
shown for clarity). Again limited strengths for similarly machined small, single
crystal bars [101, 102] are above much of the polycrystalline values. Note data for
extruded and as-sintered SiC fibers (∼ 50 µm dia., 103), which appear to be an
extension of the larger G branch, consistent with similar σ – G-1/2 behavior for as-
fired surfaces. (B), Data for polymer-derived SiC fibers containing typical [104]
and low [105] oxygen levels tested as-fired and as-deposited CVD SiC filaments
[106]. Note that the compressed G-1/2 scale gives the appearance of high slopes
in (B) but they are actually ∼ 0.4 and 0.2 MPa·m1/2, consistent with being finer G
branches, as is their fine G.](https://image.slidesharecdn.com/mechanical-properties-of-ceramics-and-composites-120303143122-phpapp01/85/Mechanical-properties-of-ceramics-and-composites-154-320.jpg)
![154 Chapter 3
B
FIGURE 13 Continued.
Cranmer et al. [26] (using Gm). Prochazka and Charles’ data for sintered β bodies
[96] also generally agrees with other data when strengths (<140 to ∼350 MPa) are
plotted versus the effective G (taken as 1/10 the length) of the long tabular (exag-
gerated) α-grains at fracture origins in the β-SiC matrix, rather than the grain
length, as used by the authors. Gulden’s [97] CVD SiC data (0.6 ± 0.5% poros-
ity), based on Ga, is also consistent, recognizing the higher strength due to the use
of small polished specimens (with some possible preferred orientation), and it
supports a positive fine G slope, as does Cranmer et al.’s surface finish study. The
latter again show different finer G branches as a function of machining grit size,
with less differentiation in the larger G branch. Seshardri et al.’s [98] (sintered α,
∼1.6% porosity) SiC data also showed a finer G branch of low slope. Takeda and
Nakamura’s [99] SiC (sintered to 98–99% theoretical density, mostly with 1–2%
of AIN, BN, B, or B4C) data tends to fall to the right of the other data whether
plotted versus Ga or Gm from general microstructure evaluation (measurement
specifics not given). This data being to the right of other data probably reflects G](https://image.slidesharecdn.com/mechanical-properties-of-ceramics-and-composites-120303143122-phpapp01/85/Mechanical-properties-of-ceramics-and-composites-155-320.jpg)
![Grain Dependence of Ceramic Tensile Strengths at ∼ 22°C 155
measurement issues, especially the inability to determine a true Gm on other than
the fracture surface, so the values given are likely to be <Gm at fracture origins
(not determined), especially at medium and larger G. Correction for this would
likely bring their data into agreement with the other SiC. Larsen et al.’s [100] SiC
strength data versus measured Gm (based on fractography), as well as variable Ga
values for various SiC materials, is consistent with other SiC data and the model
of Fig. 3.1, e.g. similar to their data for Si3N4 (Fig. 3.29). This showed that most
higher strength failures occurred from undetermined origins (i.e. no dominant
features such as large grains in the origin area), thus being more consistent with
Ga values and on finer G branches (of which there should be more than one, sub-
stantial scatter, or both in view of different and varying flaw populations), while
lower strengths (e.g. <450 MPa) showed failure from various flaws, tabular grains
(e.g. in the GE β SiC), or both. Again, note various polycrystalline strengths ex-
tending down to ∼ 20% or less of the average strengths of small α single crystal
bars (oriented for easy fracture, e.g. on (100) [101, 102] with similar surface ma-
chining as the polycrystalline bodies and basic inconsistencies with K–G data
(Figure 2.14), especially at finer G.
While the above bulk SiC data is for machined samples, as is typical for
most materials, various SiC fibers provide data on as-fired or as-deposited sur-
faces (and some possible surface damage), as is the case for alumina-based fibers
discussed below (Fig. 3.18). Data of Srinivasan and Venkateswaran [103] for
SiC fibers made by green extrusion of SiC powders and sintering clearly falls
along an extension of the larger G branch for bulk SiC to strengths of ∼ 1500
MPa (Fig. 3.13A). This is consistent with its grain size range, the as-fired sur-
faces, and fractography indicating fracture origins from flaws with c ∼ G. Data
for polymer-derived SiC-based fibers (Fig. 3.13B) also shows a clear G depen-
dence [104, 105], extending well into the nanograin regime. Data of Elkind and
Barsoum [106] on commercial CVD SiC filaments tested as-received or after
heat treated to increase G, both by itself and combined with the one much larger
G specimen [107], shows a distinct G dependence. This is corroborated by data
of Bhatt and Hull [108, 109] showing similar decreases in strength with heat
treatments and associated qualitative changes in G and by the microstructural
characterization of such fibers by Nutt and Wawner [110]. Differences between
these sets of as-fired polymer-derived and as-deposited or as-fired CVD fibers
are attributed primarily to the G differences and composition, especially signifi-
cant dilution of the SiC content, primarily in the polymer-derived fibers, as well
as to some test differences (e.g. loading rates, gage lengths, etc.). Other mi-
crostructural differences, especially elongated grains with an axial preferred
[111] alignment with the carbon core of the CVD filaments, also are probably a
source of the difference in σ–G-1/2 behavior between the fibers. However, these
fiber results clearly show that such as-fired surfaces follow similar G depen-
dences as machined surfaces.](https://image.slidesharecdn.com/mechanical-properties-of-ceramics-and-composites-120303143122-phpapp01/85/Mechanical-properties-of-ceramics-and-composites-156-320.jpg)
![156 Chapter 3
Another SiC data source providing additional insight is very fine G
(0.01–0.1 µm), small rods (∼ 1.5 mm dia.) of SiC deposited on W wire cores (∼
200 µm dia.). This is a transition between the above SiC bulk and filament data.
As-deposited surfaces were very smooth, giving strengths averaging 1400–1800
MPa depending on whether they were respectively tested in four- or three-point
flexure, despite an indicated internal stress from W–SiC expansion differences of
the order of 700 MPa [111, 112]. Limited fracture origin identification indicated
failure from surface flaws from handling damage, indicating such bodies would
fall on a fine G branch, as was expected. These results were corroborated by
three-point flexure of lightly and more heavily abraded surfaces (respectively
with 600 and 320 grit SiC paper in the axial direction), giving average strengths
of ∼ 1000 and 600 MPa respectively (the latter also obtained for oxidized sur-
faces). Substantial fracture origin determinations showed that fractures in
abraded rods occurred from machining flaws substantially larger than the han-
dling flaws and the G, confirming their placement on finer G branches.
A previous survey [11] of more limited data of Cr3C2, HfC, TaC, and ZrC
showed larger G behavior like that of other ceramics, as well as reasonable evi-
dence of finer G branches (e.g. TaC, TiC, and ZrC), the latter sufficient to indi-
cate a positive slope. Subsequent data by Miracle and Lipsett [113] for TiCx (x =
0.66, 0.75, 0.83, or 0.93 with G = 22, 21, 20, and 14 µm respectively) is consis-
tent with the other TiC data; i.e. effects of G dominate over, or are a reflection of,
stoichiometry. ZrC data of Bulychev et al. [114] for G ∼ 10–24 µm indicates in-
tersection of the finer and larger G branches in the range of G ∼ 15–20 µm.
Recently, Savage et al. [115] presented fairly extensive data for CVD di-
amond showing a clear G-1/2 dependence of strength (Fig. 3.14). Though they
showed a single line through their data, there is reasonable indication of a
change from a finer to a larger G branch, with the intersection of the two
branches in the 100–250 µm range and a larger G branch slope of ∼ 6
MPa·m1/2. Both these values are in reasonable agreement with the model (Table
3.1), especially given uncertainties due to the elongated, oriented grain struc-
ture from CVD.
While some refractory metals such as Nb and Ta commonly exhibit macro-
scopic ductility (hence also commonly following a Petch relation), others such
as Cr, Mo, and W commonly have limited or no macroscopic ductility. Thus
when there are cracks, pores, impurity particles, etc. of sufficient size and con-
centration to be failure causing flaws [116], failure is brittle, e.g. as shown by ef-
fects of surface finishing on ductility in W [117]. In such cases there may be
relations of strength to G via relations of the flaw sizes or of toughness to G, or
both. In the absence of such flaws, these commonly brittle materials fail by slip-
induced (cleavage) fracture, e.g. down to temperatures of ∼ 100° K [118] which
is corroborated by their strengths following a Petch relation. However, there are
some departures to a lower Petch plot slope, e.g. at G > 0.25 mm in Mo that re-](https://image.slidesharecdn.com/mechanical-properties-of-ceramics-and-composites-120303143122-phpapp01/85/Mechanical-properties-of-ceramics-and-composites-157-320.jpg)
![Grain Dependence of Ceramic Tensile Strengths at ∼ 22°C 157
FIGURE 3.14 Flexure strength of CVD diamond at ∼ 22°C as a function of the in-
verse square root of grain size (G-1/2). Note that while they drew a single line
through all of the data, it is fitted better by two lines consistent with the model for
machining flaw–grain interactions. (From Ref. 115, published with the permission
of the SPIE.)
sults in intercept stresses higher than those projected from finer G, e.g. by ∼
50%. This and other variations may arise from differing brittle-to-ductile transi-
tion temperatures at different G values, e.g. in W ∼ 300° K at fine G and < 200°
K for large G [119] with brittle fracture following the Griffith equation [120].
Such higher transition temperatures in finer G bodies would suggest the occur-
rence of brittle fracture in some finer G bodies with slip-induced fracture in
larger G bodies, i.e. as in Fig. 3.1. However, it is not clear whether this combina-
tion as found in ceramics has been clearly demonstrated in brittle metals, though
an earlier combination of strengths of a few different W bodies to give a broader
G range [11] suggests that possibility.
IV. NONCUBIC CERAMICS FAILING FROM PREEXISTING FLAWS
A. Al2O3 Machined and As-Fired
Al2O3 has the most extensive data base, providing substantial data not only on
the basic σ – G-1/2 and related fractography, but also on effects of different me-
chanical testing, additives and second phases (especially to inhibit grain growth),
and machined and as-fired surfaces. Though much of this data is limited by the](https://image.slidesharecdn.com/mechanical-properties-of-ceramics-and-composites-120303143122-phpapp01/85/Mechanical-properties-of-ceramics-and-composites-158-320.jpg)
![158 Chapter 3
grain size range covered and the accuracy and detail of microstructural charac-
terization, it clearly provides extensive demonstration of the two branch behav-
ior of Fig. 3.1, as was shown in previous surveys [2, 8, 9, 11–13] summarized
here. Thus the area labeled previous surveys in Fig. 3.15 covers the range of al-
most all data with only a limited amount of data falling outside of this area and
only to a limited extent. Thus earlier data on commercial and similar aluminas,
often with some (e.g. 3–8%) porosity, second phase (1–7%, mainly silicate), or
both [121–127] falls mostly in the lower half or somewhat below this area but in-
dividually or collectively agree with the two-branch model. This includes Alford
et al.’s [27] data for specimens machined from somewhat porous pressed discs
[2] and that of Evans and Tappin [125] (sintered, diamond ground) Al2O3 with 2
σ–G-1/2 branches with a reduced but > 0 slope in the fine G region, but somewhat
lower σ due to ∼ 5% porosity. Correction for effects of porosity and silicate
phase (Fig. 3.30) of sintered bodies moves this data further toward the mean of
FIGURE 3.15 Strength versus G-1/2 for alumina bodies at ∼ 22°C. A summary of
trends from previous surveys [2, 3, 11, 13] is shown along with more recent re-
sults for mainly high-purity, dense sintered bodies [128–136] and results of true
tensile testing of large hot pressed specimens [67, 138]. Note data for Verneuil
crystals ground parallel or perpendicular to the tensile axis [15] (open and closed
symbols respectively).](https://image.slidesharecdn.com/mechanical-properties-of-ceramics-and-composites-120303143122-phpapp01/85/Mechanical-properties-of-ceramics-and-composites-159-320.jpg)
![Grain Dependence of Ceramic Tensile Strengths at ∼ 22°C 159
the data survey and into better agreement with hot pressed data, which fell
mostly near the central-to-upper portion of the survey area [13, 53, 128–130].
Subsequent studies of higher purity bodies, mostly sintered close to theoretical
density [131–136], also agree individually or collectively with the previous sur-
vey, including that of Koyama et al. [135] with small additions of CaO, SiO2, or
both giving elongated Al2O3 grains (Fig. 3.17). Two exceptions to these trends
are for submicron G bodies of Spriggs et al. [64] and Krell and Blank [137] with
strengths for (unspecified) machined dense Al2O3 of 450–550 MPa (G ∼ 0.6–0.8
µm) and 582 MPa (G ∼ 0.4 µm). The lower level of these strengths relative to
that expected from extrapolation of data of Fig. 3.15 to finer G is attributed to
grain boundary contamination left from raw materials and processing used to
achieve the finer G (Sect. V.A).
Data of Fig. 3.15 also allows comparison of different test techniques,
though most data is from various flexure tests, which is probably a factor in the
data range. Chantikul et al.’s data [131] in biaxial flexure of small discs tends to
fall higher in strength, especially at finer G, which may reflect some benefits of
avoiding edge failures (and probably also reflects some benefits of polished ver-
sus ground surfaces, as is discussed below), but it still falls in the typical range
for other studies. True tensile testing of much larger hot pressed Al2O3 samples is
shifted to larger G values due to the large specimen volume tested and the occur-
rence of isolated single large grains or clusters of a few of them, e.g. reaching di-
mensions of ≥ 500 µm [67, 138]. While some of these grains or clusters may
exceed the flaw size, indicating a somewhat higher than real slope, the slope of
the resultant larger G branch is still in the range of the other studies of Fig. 3.15
(see also Sec. VII). This true tension data also shows some of the finer G branch
consistent with the other data. Further, diametral tensile testing of mostly hot
pressed bodies [139–141] falls near the lower bound of the survey range in Fig.
3.15 and clearly shows a consistent intersection of larger and finer G branches
[13]. Thus while different testing may shift the results due to stressing of differ-
ent volumes of material and thus sampling different ranges of failure causing
flaws, the σ–G-1/2 behavior shifts accordingly, e.g. in slopes and intersections, but
remains consistent with the basic model, which is thus reinforced.
Consider next machining studies, which were an important factor in devel-
oping the model of Fig. 3.1. The demonstration that there was significant
anisotropy of tensile strength as a function of machining direction relative to the
subsequent stress direction in uniaxial tensile or flexure testing [15, 17] was a
major factor in indicating the two-branch character of σ–G-1/2 behavior. Initial
studies showed that machining parallel versus perpendicular to the tensile axis
resulted in respectively higher and lower strengths at both finer and large G (and
also generally in single crystals), thus indicating different finer G branches. Sub-
sequent studies of Tressler et al. [24] showed different machining σ effects in the
finer, than in the larger, G region. Coarser abrasive finishing in the finer G region](https://image.slidesharecdn.com/mechanical-properties-of-ceramics-and-composites-120303143122-phpapp01/85/Mechanical-properties-of-ceramics-and-composites-160-320.jpg)
![160 Chapter 3
resulted in lower strengths on separate branches, while in the larger G region
coarser finishing also resulted in lower strengths, but in one basic larger G
branch. The polishing results of Chantikul et al. [131], though also entailing
some probable benefit from biaxial testing (i.e. no edge failures), is consistent
with higher strengths with finer finishing. [Note that Tresssler et al.’s [24] data
for Al2O3 hot pressed with MgO (Ga ∼ 2 µm) or without MgO (Ga ∼ 3, 12, or 18
µm) generally agreed with other data whether plotted vs. Ga or, as they did, vs.
Gm (Gm ∼ 3.3 and 4.3 µm for the two finest G bodies, but ∼ 80 – 100 µm, due to
scattered large platy grains found at fracture origins, in their two largest G bod-
ies). However, their data is insufficient to prove their claim that the fine G slope
= 0; it is at least as supportive of a positive slope (though complicated by their
use of Gm, see Sec. V.B). Also note that (1) Chantikul et al.’s [131] model is not
correct, since the σ–G-1/2 behavior is basically the same in cubic and noncubic
ceramics and thus is not determined by TEA effects as they proposed, and (2)
there are important machining effects when the flaw and grain sizes approach
each other [142–144] (Fig. 3.33), as is discussed later.
Again an important component of the σ–G-1/2 model for understanding
failure mechanisms is relating strength and fractography of single crystals of the
same material with the same or similar surface finish, i.e. sapphire in this case,
focusing on weaker single crystal orientations (which are also typically the ones
tested), since these are likely to dominate failure in larger G polycrystals. Rice’s
[15] data for Verneuil crystals of two different orientations and machining paral-
lel with the tensile axis agrees well with earlier data of Wachtman and Maxwell
[145] (σ ∼ 350–700 MPa) and of Heuer and Roberts [17, 146] (σ ∼ 450 MPa) for
unspecified machining (presumably parallel to the tensile axis) of similar sap-
phire. Again, polycrystalline strengths are frequently below those for single crys-
tals with similar finishing, and machining perpendicular to the tensile axis
reduces most strengths [15], often substantially. Mechanical polishing also gave
single crystal strengths of ∼ 450 MPa, which increased to 600–900 MPa with
subsequent annealing [17, 146], consistent with no grain boundary grooving on
crystal specimens.
Definitive fractography of polycrystalline Al2O3 is more difficult, espe-
cially as G increases, but machining flaws have been found in some finer G bod-
ies, where they are > G as expected (Fig. 3.16). In single crystals, definitive
machining flaws are frequently found and are of similar size and character to
those in similarly finished polycrystalline bodies. For bodies of intervening G,
definitive machining fracture origins are generally not found, but probable or
certain origins from larger grains or clusters of them occur [3, 11–13, 138] (Figs.
1.2A,B, 1.3A,B, 1.4).
Next consider effects of phases added, usually in limited amounts, for lim-
iting G. Such additions were an important factor in extending the G range, espe-
cially with low to 0 P, but raises questions of additive roles in σ – G behavior.](https://image.slidesharecdn.com/mechanical-properties-of-ceramics-and-composites-120303143122-phpapp01/85/Mechanical-properties-of-ceramics-and-composites-161-320.jpg)

![162 Chapter 3
MgO, the most common additive (often at ≤ 1 %), can be very effective in con-
trolling G with resultant strength increases mainly, or exclusively, as a result of
the reduced G, as was indicated above (but local, substantial, excesses of it can
be quite detrimental [16]. Several other additives also appear to have little or no
effect on strength other than increasing it via resultant finer G. Thus McHugh et
al. [140] showed that sintered Al2O3 strengths increased with additions of fine
Mo particles up to ∼ 6 v/o due to reductions in G, then remained constant to the
limits of their study of 16% addition. Similar improvements were noted in an-
other study using diametral testing [141], and for addition of W or ZrO2, as is
discussed below. While some negative effects of other constituents occur, as is
noted later, specimens with up to several percent silicate phase [121–129], 30%
AION [147], and 25% Cr2O3 [10, 148], indicate limited, or no, effect of these
phases, other than via their effect on G.
Consider now data for specimens with as-fired surfaces, typically from
extruded rods. Data of Charles [149] for (lamp envelope quality) Al2O3 ex-
truded, as-fired rods (∼1.7 mm dia, noting inhomogeneous G only in the next-
to-largest G body) clearly shows a two-branch curve with the finer G branch
having a significant positive slope (Fig. 3.17). Alford et al.’s [27] extruded (< 1
mm dia., as-fired) rod strengths are much higher, presumably reflecting the
small-size) high-quality as-fired finish, and possible (unexamined) preferred
orientation (e.g. reflecting the ∼ 1.5 aspect ratio of their Al2O3 powder particles
and the small rod diameter, implying a high reduction ratio). However, their
data is at least, if not more, consistent with a positive finer G branch slope
rather than their proposed slope of 0. Their one fractograph indicating fracture
from a cluster of three larger grains raises issues of the rationale of using the
large G in such cases, as is discussed later (Sec. IV.B). Note that their strengths
of machined bars (∼2.5 mm thick of unreported orientation relative to the press-
ing direction for the original disks) made from the same Al2O3 powder are simi-
lar to those of others but tend to lower strengths, especially at finer G in view of
their use of Gm (∼3 Ga). This lower σ is reasonable in view of the large (e.g. ∼
100 µm) processing defects (e.g. laminar voids), and as-sawn surfaces. Alford et
al.’s use of maximum σ (σm, i.e. the outer fiber stress) is inconsistent with their
use of Gm, since such round rods have such a small σm region and thus a low
probability of failure occurring at σm with significant microstructural hetero-
geneity. Their proposed 0 fine G slope for their extruded rods (though affected
by use of Gm and probable orientation effects) is far less than for similar ex-
truded Al2O3 rods. Baily and Barker’s [150] and Blakelock et al.’s [151] data for
smaller (<1 mm dia.) extruded, sintered Al2O3 rods vs. Ga showed positive
slopes, which are also supported by these data extrapolating to σ–G-1/2 values
for Al2O3-based fibers (Figs. 3.17, 3.18). Hing’s [152] data for as-fired Al2O3–W
(isopressed) rods (Fig. 3.17) clearly showed a two-branch behavior with > 0
slopes for the fine G branches and agrees with other as-fired or machined Al2O3](https://image.slidesharecdn.com/mechanical-properties-of-ceramics-and-composites-120303143122-phpapp01/85/Mechanical-properties-of-ceramics-and-composites-163-320.jpg)
![Grain Dependence of Ceramic Tensile Strengths at ∼ 22°C 163
FIGURE 3.17 Strength–G-1/2 data for alumina bodies with primarily as-fired sur-
faces. Nominally pure alumina bodies of Charles [149], extruded ∼1.7 mm rods as-
fired, and Alford et al. [27], high strength extruded rods (< 1 mm dia.), both tested
as-fired. The solid lines for Alford et al.’s data are their original lines; the dashed
lines are an equal or more probable alternative. Bailey and Barker’s [150] data
(vertical bars represent the range of data) for as-fired extruded rods (0.8 mm dia.,
with 0.25% MgO). The three lines (top to bottom) are for three-point and four-point
flexure, then true tension of Blakelock et al.’s rod [151] with ∼ 6 to ∼ 15% porosity,
correction for which would increase strength ∼ 15 to ∼ 50% (assuming similar cor-
rection to that shown by Bailey and Barker). Data of Rice [15] for Verneuil crystals
ground parallel or perpendicular to the tensile axis (open and closed symbols re-
spectively). Hing’s [152] data (vertical bars = standard deviation) for isopressed,
as-fired (∼ 9 mm dia.) rods of Al2O3 with 1.9 to 7.6 v/o W, and data of Hori et al.
[153] for sintered bars with up to 5% ZrO2; both additions for grain growth inhibition
show the same σ–G-1/2 behavior as pure alumina, except for Alford et al.’s high
strength Al2O3. Note designation of whether the bodies were conductive or non-
conductive indicating the degree of contiguity of the W phase. (From Ref. 2, [2],
published with the permission of the Journal of Materials Science.)](https://image.slidesharecdn.com/mechanical-properties-of-ceramics-and-composites-120303143122-phpapp01/85/Mechanical-properties-of-ceramics-and-composites-164-320.jpg)
![164 Chapter 3
data with or without Mo additions. Similarly, data of Hori et al. [153] for sin-
tered Al2O3 bars with up to 5 wt% ZrO2 that were machined and then annealed
(at near sintering conditions) showed strengths increasing (but toughness de-
creasing) due to reduced grain growth. Lange and Hirlinger showed similar re-
sults [154].
Data on Al2O3-based fibers (Fig. 3.18) [155–168] complements and ex-
tends Al2O3 data (especially for as-fired surfaces). The typical fine G and defects
(e.g. pores and cracks) [3] that are the cause of failure in most fibers indicate that
all of this data belongs on finer G branches, except probably for some of Simp-
FIGURE 3.18 Al2O3-based fiber σ–G-1/2, i.e. as-fired, data. Data of Nazarenko et
al. [155] is shown as-measured and corrected to P = 0. Data of Simpson [156]
Hamling [157], Birchall [158], Dupont FP and PRD [159, 160] as well as various
Al2O3-SiO2 fibers [159–164, shown as-measured]. Note reduced σ for larger G
(annealed) Dupont fibers and the σ of commercial single crystal (c-axis) filaments
[165–168].](https://image.slidesharecdn.com/mechanical-properties-of-ceramics-and-composites-120303143122-phpapp01/85/Mechanical-properties-of-ceramics-and-composites-165-320.jpg)
![Grain Dependence of Ceramic Tensile Strengths at ∼ 22°C 165
son’s [3, 156] data. Thus the Dupont fiber data by itself, as well as the other data
collectively, show a substantial finer G slope. Addition of 20% ZrO2 maintains
finer or more uniform G, while SiO2 additions reduce G and give non-α phases
and smoother surfaces [159–161], the latter clearly shown to improve strengths.
Note that single crystal sapphire filaments have higher strengths [165, 166] than
many of the polycrystalline fibers, despite their generally >10-fold larger diame-
ter and frequent failure from residual pores [168], and also fall below strengths
of many polycrystalline fibers.
Note two important facts for later discussion. First, there are frequent sig-
nificant discrepancies between the G dependence of toughness of Al2O3 (Figs.
2.16, 2.17) for many tests, especially those showing R-curve effects, and
strength, which is true for much other data for noncubic ceramics. Second,
strength data for Al2O3 as well as most other noncubic ceramics is consistent
with the two branch model (Fig. 3.1).
B. Other Noncubic Oxide Ceramic
Individual BeO studies [169–175] and compilations by Cargniglia [8, 9] and
Rice [11, 13] clearly show two σ–G-1/2 branches (Fig. 3.19). Again, (1) a few per-
cent porosity present in some samples lowered σ, as did machining perpendicu-
lar (e.g., circumferentially for round rods) vs. parallel with their lengths (more so
in the finer than in the larger G branch), and (2) the primary effect of a nonmisci-
ble second phase (SiC) [175] or a reactive phase (Al2O3) [173] in increasing σ
was via reduced G. The number of specimens (e.g. 50) per test and the demon-
stration of increasing preferred orientation (from extrusion) as G increased indi-
cates that the negative finer G slope is real for UOX-derived BeO [169, 170]
(Sec. III.N). Again, σ–G behavior is inconsistent with γ–(hence also K–) G be-
havior (Figure 2.17).
Machined TiO2 data of Kirchner and Gruver [176] (hot pressed, porosity
≤3%) vs. Ga, Alford et al.’s [27] (lower σ specimens from sintered, die pressed
disks) are reasonably consistent regardless of whether Ga or Gm is used for Al-
ford et al.’s data (Fig. 3.20). Alford et al.’s small (<1 mm dia) as-fired extruded
rods with expected higher σ have a larger G slope < KIC, when it is recognized
that c = G/2, not Gm as they used [27], and the zero σ intercept at G = ∞, finer G
slopes = 0 are quite uncertain, and not supported by Kirchner and Gruver’s data.
Additionally, all of the comments for Alford et al.’s extruded Al2O3 data apply to
their extruded TiO2 data, since the processing (including a TiO2 powder aspect
ratio of ∼ 1.5), testing, characterization, and analysis issues are the same. Again,
some large G σ’s are below those of (Vernuil) crystals [13] (which may be
weaker than Czchralsky crystals) with similar surface finishes. Again, γ–G and
K–G behavior are inconsistent.
A previous σ–G-1/2 data compilation [74] for mainly PSZ ZrO2, and a more](https://image.slidesharecdn.com/mechanical-properties-of-ceramics-and-composites-120303143122-phpapp01/85/Mechanical-properties-of-ceramics-and-composites-166-320.jpg)
![166 Chapter 3
FIGURE 3.19 BeO σ – G-1/2 data of Chandler and colleagues [169, 170], Bentle
and Kniefel [171], Veevers [172], Greenspan [173], and O’Neal and Livey [174]
for relatively high-purity BeO with various processing and machining. Specimens
of Greenspan and Hill et al. [175] with and without substantial levels of respec-
tively Al2O3 and SiC additives.
recent survey [75] (especially for TZP bodies) with various types and levels of
partial stabilization [177–185], show higher strengths but similar σ – G-1/2 behav-
ior with transformation toughening from tetragonal ZrO2 as without (Fig. 3.21).
PSZ bodies (some of which are conservatively corrected for porosity, Fig. 3.9A)
lie along larger G branches whose slopes generally increase with decreasing sta-
bilization (presumably to an optimum toughness, beyond which their slopes and
other behavior should again decrease). Such PSZ strengths commonly extend
well below the strengths of similarly machined PSZ crystal specimens of the](https://image.slidesharecdn.com/mechanical-properties-of-ceramics-and-composites-120303143122-phpapp01/85/Mechanical-properties-of-ceramics-and-composites-167-320.jpg)
![Grain Dependence of Ceramic Tensile Strengths at ∼ 22°C 167
FIGURE 3.20 TiO2 σ – G-1/2 data of Kirchner and Gruver [176] (hot-pressed and
machined), machined single crystals (Verneuil) of Rice [13] and of Alford et al.
[27] for extruded high strength (< 1 mm dia.) rods tested as-fired, and lower
strength bars (tested as-sawn from die pressed and sintered disks). Solid lines
are those proposed by Alford et al. [27] with equal or more probable dashed alter-
natives indicated.
same or similar composition and machining (e.g. > 1000 MPa [80], Fig. 3.21).
On the other hand, TZP materials all appear to lie along finer G branches, again
often at lower strength levels than strengths of PSZ crystals of similar finish and
composition. Again there are some variations due to residual porosity, e.g. the
slope of Wang et al.’s [180] data for ZrO2 fully stabilized with CeO2 (12 m/o, i.e.,
∼16 w/o) would be decreased a limited amount since the limited porosity present
(0.8–2.8%) tended to increase as G increased, so there would be greater correc-
tion of the larger G strengths. In either case, this data is approximately an exten-
sion to larger grain sizes of the data for similar compositions of Tsukuma and
Shimada [177] and of Hecht el al. [182]. While it is possible that Wang et al.’s
data reflects the large grain branch for such CeO2-based compositions, this
seems unlikely based on (1) probable limited differences in slope between it and
the other similar compositions, and (2) the fine G of such an intersection, in view](https://image.slidesharecdn.com/mechanical-properties-of-ceramics-and-composites-120303143122-phpapp01/85/Mechanical-properties-of-ceramics-and-composites-168-320.jpg)
![FIGURE 3.21 ZrO2 σ–G-1/2 data for machined bars with various stabilizers. Some
PSZ data is shown from a previous survey [74] (Fig. 3.10) along with data for PSZ
crystals of Ingel et al. [80]. Most data is for dense TZP bodies of Tsukuma and
Shimada [177], Wang et al. [179, 180], Masaki [181], Hecht et al. [182], Tsukuma
[183], and Puchner et al. [184]. Stabilizer contents (Y2O3 w/o shown next to data
points of Masaki). Vertical bars = standard deviations, and numbers at bar bot-
toms the number of tests. Note (1) strengths of ∼ 1 GPa for Y-TZP of Kihara et al.
[185] with finer G (∼ 0.5 µm) from modest additions of Al2O3 (to 1.5 m/o) agree
well with other data, (2) TZP data appears mainly or exclusively as finer G
branches for the larger G PSZ data, and (3) the general agreement of the bulk
TZP data with that for ZrO2 fibers [74, 75, 186]. (From Ref. 75, published with the
permission of the Journal of Materials Science.)](https://image.slidesharecdn.com/mechanical-properties-of-ceramics-and-composites-120303143122-phpapp01/85/Mechanical-properties-of-ceramics-and-composites-169-320.jpg)
![Grain Dependence of Ceramic Tensile Strengths at ∼ 22°C 169
of KIC of such material (5–19 MPa·m1/2) predicting intersecton per the model for
c(∼G/2) at ∼50 – 400 µm. Note that while the Ce-PSZ materials varied in σ (as
expected from variations in composition and processing, hence resultant qual-
ity), they all show (1) general consistency between data sets, (2) lower ∼ and
moderate but definitely positive, finer G branch slopes, and (3) more definitive
and extensive microplasticity.
The above trends show that toughened ZrO2 bodies follow very similar
trends as normal ceramics, but with strength levels often increased substantially
due to transformation toughening. Again, larger G branches extend to strengths
considerably below those for single crystals of comparable composition and sur-
face finish, and finer G branches have lower slopes than the larger G branches,
but often substantial slopes. Although data to define intersection(s) of the larger
and finer G branches is limited, there are indications that larger and finer G
branches do intersect when c ∼ G (Table 3.1). Extrapolation of this data gives an
intersection with the larger G PSZ data at G∼10µm, which is consistent with the
expected intersection at c ∼ G. Further, other miscellaneous TZP data, e.g., of
Rice and McDonough [74], Jue and Virkar [82], Masaki [181], and Hecht el al.
[182], would all be consistent with their being on the same or similar finer G
branches, dependent upon their composition and processing. Note that primarily
composition and secondarily processing are important factors in strength, and
hence in determining the branches bodies appear on, especially in the finer G
branch regime. Whether the finer G branches, especially for bodies (e.g. Ce-
PSZ) showing considerable plasticity, extrapolate, at least approximately, to sin-
gle crystal yield stresses at G = ∞ (e.g. to ∼ 400 MPa) is not known. Such stress
levels may not be unreasonable for a solid solution type system (versus compres-
sive yield stresses in precipitate PSZ crystals, ∼1200 MPa for Mg-PSZ [187] and
∼2800 MPa for Y-PSZ [188]). Again note that similar trends for machined and
as-fired surfaces, including extrapolation to fiber strength–grain size trends, are
also shown by ZrO2 data. There are again some uncertainties in correction for
porosity (especially for Nazarenko et al.’s ZrO2 fibers [155], since the same or
similar correction as for their Al2O3 fibers would imply a much greater Young’s
modulus than for theoretically dense ZrO2. However, data for finer G TZP bodies
overlaps with the data for ZrO2 fibers partially stabilized with CaO or Y2O3 [155,
186] (Fig. 3.21).
Collectively, these results show that grain size plays a major role in the
mechanical behavior of partially stabilized ZrO2 materials, in essentially the
same fashion as it does in other ceramics. The effect of toughening from trans-
formation associated with partial stabilization appears to manifest itself primar-
ily by effects of increased KIC increasing strengths by either allowing the
introduction of smaller (e.g. machining) flaws or more difficult flaw propaga-
tion, or both, thus increasing σ over and above that for fully stabilized materi-
als, but maintaining a similar G dependence. However, there is again a](https://image.slidesharecdn.com/mechanical-properties-of-ceramics-and-composites-120303143122-phpapp01/85/Mechanical-properties-of-ceramics-and-composites-170-320.jpg)

![Grain Dependence of Ceramic Tensile Strengths at ∼ 22°C 171
FIGURE 3.22 Strengths of various machined beta aluminas versus G-1/2 of Virkar
and Gordon [195] (hot pressed or sintered, plotted vs. Gm) and various other stud-
ies [196–200] of hot pressed, HIPed, and sintered bodies plotted versus average
G, Ga (horizontal bars for some bodies with a wider G range). (From Ref. 2, pub-
lished with the permission of the Journal of Materials Science.)
fundamental difference between the G dependences of strength and toughness
(Figure 2.18), i.e. the strength continuously decreasing as G increases, while
toughness goes through a, commonly significant, maximum at certain G, e.g.
1–3 µm. Thus there is a need to integrate the σ – G-1/2 behavior with evaluation
of mechanisms for transformation toughening. Some of this may involve in-
creased G increasing the martinsitic start temperature, which reduces KIC
[189–194] and hence generally σ, thus also impacting σ – G-1/2 trends, but such
effects are not pertinent to fully stabilized ZrO2 and are of uncertain applicabil-
ity to precipitate toughened PSZ. Thus the toughness maximum must reflect
testing effects not pertinent to normal strength behavior, though the general in-
crease in toughness from transformation does increase strength in two ways, as
is discussed later.](https://image.slidesharecdn.com/mechanical-properties-of-ceramics-and-composites-120303143122-phpapp01/85/Mechanical-properties-of-ceramics-and-composites-172-320.jpg)
![172 Chapter 3
Data for (mostly hot pressed) β″-Al2O3 bodies of Virkar and Gordon [195]
vs. Gm (Ga values and specifics of the Gm determination were not given) clearly
showed the characteristic two-branch σ – G-1/2 behavior with the larger G slope <
KIC (Table 3.1) and the finer G slope probably >0 (Fig. 3.22). The crystallo-
graphic orientation from hot pressing was a primary factor in a second probable
finer G branch. More limited earlier data of other investigators [196–200] was
generally consistent with this data, given effects of some porosity, composition
differences, and larger grains from exaggerated grain growth [2]. However,
again resultant larger tabular grains were large enough to be fracture origins in
some cases and not others. McDonough et al.’s [196] fractography in their uni-
formly fine grain bodies showed clear fracture origins from typical machining
flaws substantially larger than the fine (∼5 µm) grains.
Chu et al.’s data for Li4SiO4 (G ∼ 3–50 µm, P 2–32%, increasing as G de-
creased) indicated a possible finer–larger G intersection at G ∼ 3 – 10 µm using
their porosity correction of e-3.8P [201]. The limited data on highly anisotropic
FIGURE 3.23 Strengths of MgTi2O5 [202] and Fe2TiO5 [203] as a function of G-1/2.](https://image.slidesharecdn.com/mechanical-properties-of-ceramics-and-composites-120303143122-phpapp01/85/Mechanical-properties-of-ceramics-and-composites-173-320.jpg)
![Grain Dependence of Ceramic Tensile Strengths at ∼ 22°C 173
materials such as MgTi2O5 [202] and Al2TiO4 [203] with extensive microcrack-
ing showed a significant change in σ – G-1/2 behavior, i.e. a much faster decrease
in strengths at fine G, then saturating as G increases (Fig. 3.23). Data for these
two materials also show nominally identical G dependence of their Young’s
moduli.
C. Noncubic Nonoxide Ceramics
Data for dense sintered and hot pressed bodies MgF2 [204 and 205] shows
strengths of bodies with average G ≥ ∼1 µm substantially decreasing within nor-
mal bounds as G increases (Fig. 3.24), with some difference in strengths at a
FIGURE 3.24 Strength versus G-1/2 for hot pressed and sintered MgF2 test bars
with polished surfaces [204–207], and for three basic orientations of single crys-
tals (error bars are shown for the standard deviations where greater than the
symbol height), with no evidence of plasticity observed [204]. Note the decrease
in strength with increasing G at G > 1 µm and decreasing G < 1 µm. Vertical ar-
rows indicate probable corrections for limited porosity.](https://image.slidesharecdn.com/mechanical-properties-of-ceramics-and-composites-120303143122-phpapp01/85/Mechanical-properties-of-ceramics-and-composites-174-320.jpg)
![174 Chapter 3
given G between the different investigators, data of Lin et al. [205] being higher
than the others. This probably reflects typical flaw differences due to differ-
ences in machining, residual processing defects, and specimen size and other
testing effects, which are particularly pertinent to this probably being the finer
G branch. This data is consistent with an intersection with the larger G branch
being at ≥ G = 10 µm, which in turn is consistent with typical polishing flaws in
dense (transparent) MgF2 being of the order of ∼ 10–20 µm [18]. Note that poly-
crystalline strengths are below single crystal strengths. Also note the clear de-
creases in strength as G decreased below ∼ 1 µm, attributed to retention of
(primarily anion, e.g. OH) impurities [204] from higher pressure hot pressing at
lower temperatures, e.g. ∼ 210 MPa at 650°C [205] and 240 MPa at 568–713°C
[207], both for powders of ∼ 0.1 µm particles.
Earlier TiB2 [11, 208–210] agrees with more recent data of Baumgartner
and Steiger [211] as well as that of Becher et al. [212], and Telle and Petzow’s
[213] evaluation of Watanabe and Kouno’s [214] data indicate a clear larger G
branch and possible finer G branches at various strength levels (Fig. 3.25). Other
limited data is generally consistent with these trends [215–218].
B4C data from mostly hot pressed bodies in a previous survey [13] showed
two branches, with finer G branches showing more effect of grinding parallel or
perpendicular to the tensile axis than the larger G branch (i.e. each forming a
finer G branch [17]. A further survey [2] (Fig. 3.26) of substantially more data
[219–234] corroborated these trends, i.e. generally showing positive finer G
slopes, but greater G dependence of the larger G branch, which may or may not
extrapolate to σ = 0 at G = ∞. These data cover a considerable composition
range, showing no clear, substantial effect of this on σ, other than via G, except
for the hot pressed B4C data of Rybalchenko et al. [225] (∼2–5% porosity),
which generally falls well below the other data. This may be in part due to lower
quality (unspecified) surface finish but appears to reflect processing effects. Thus
σ increased at a given G with both hot-pressing temperature and pressure, and
for a given pressing pressure σ often even increased with increasing G for G ≤ 5
µm (for all but one of their bodies). The trend for limited effects of composition
in most cases is consistent with evaluations of B4C hardness data showing that
most of the composition effects were via G [231], in contrast to claims of Ni-
ihara and colleagues [232, 233].
Fractography has played an important role in better defining the G depen-
dence of B4C strength, for example some failure from substantially isolated or
clustered larger (exaggerated) grains [2, 13]. While this is similar to Al2O3, it is
also different, since the large grains in B4C are typically ∼ equiaxed, occur less
frequently than in Al2O3, and have almost, if not universal transgranular fracture.
Frequent twins in B4C, at least in larger grains, may be a factor in these differ-
ences, but correction for observed and expected failure from isolated or clustered
larger grains (e.g. Figs. 1.20, 1.30) shifts some data points to the larger G branch,](https://image.slidesharecdn.com/mechanical-properties-of-ceramics-and-composites-120303143122-phpapp01/85/Mechanical-properties-of-ceramics-and-composites-175-320.jpg)
![Grain Dependence of Ceramic Tensile Strengths at ∼ 22°C 175
FIGURE 3.25 TiB2 σ–G-1/2 data of Mandorf and Hartwig [208], Alliegro [209], and
Holiday et al. [210] from an earlier survey [11] along with more recent data for
similar materials by Baumgartner and Steiger [211] as well as data of Becher et
al. [212] (for specimens with 0–1.5% Ni additions) and from Telle and Petzow’s
[213] evaluation of data for nearly dense bodies of TiB2 with three different addi-
tives from Watanabe and Kouno [214]. (From Ref. Rice [2], published with the
permission of the British Ceramic Society.)
increasing its slope a limited amount, and removing some more extreme lower
strengths from the finer G branch. However, again fractography has also shown
that some data points are (incorrectly) moved further to the left than most of the
data, and some not far enough by using Gm, indicating respectively that they (1)
are not pertinent to σ–G behavior, i.e. reflect a more serious defect and (2) are
not large enough to be the flaws by themselves. Further, fractography clearly
showed cases of failure initiation not occurring from large grains (Fig. 3.27),
again showing that the arbitrary use of Gm even in the vicinity of the fracture ori-
gin can lead to serious errors. Both the σ – G-1/2 data and fractography again
show intersection of the finer and larger G branches when c ∼ G. Fractography
also showed (via extensive transgranular fracture) mist and hackle, arguing](https://image.slidesharecdn.com/mechanical-properties-of-ceramics-and-composites-120303143122-phpapp01/85/Mechanical-properties-of-ceramics-and-composites-176-320.jpg)
![176 Chapter 3
FIGURE 3.26 B4C σ–G-1/2 data (mostly hot pressed) from an earlier survey [13] as
well as subsequent studies of Rice [17] of two different bodies ground parallel or
perpendicular to the tensile axis are shown along with data of Osipov et al. [219],
de With [220] (all hot pressed), Champagne and Angers [221] (with varying ex-
cess B) Beauvy [222], Seaton and Dutta [223], Vasilos and Dutta [224], Ry-
bal’chenko et al. [225], Bougoin et al. [226] (sintered), Schwetz and Grellner
[227], and Schwetz et al. [228] (sintered-HIPed with varying excess C). Numbers
next to points are % porosity where > 1%. Vertical lines are standard deviation,
and associated numbers are the number of tests. (From Ref. 2 published with the
permission of the Journal of Materials Science.)](https://image.slidesharecdn.com/mechanical-properties-of-ceramics-and-composites-120303143122-phpapp01/85/Mechanical-properties-of-ceramics-and-composites-177-320.jpg)
![Grain Dependence of Ceramic Tensile Strengths at ∼ 22°C 177
FIGURE 3.27 Fractographic demonstration of failure not occurring from much
larger grains in dense B4C. (A) Lower magnification SEM showing a nearly half
penny origin (arrow) from a machining flaw in the fine grain structure and a higher
magnification of it in (B). Note in (A) the two large grains to the left of the origin,
the largest one touching the tensile surface, are clearly not the origin (From Ref.
[2], published with the permission of the Journal of Materials Science.)
against significant subcritical crack growth and bridging, which typically is via
mostly intergranular fracture. Finally, note (1) that Rice [234] showed evidence
of TEA stresses contributing to tensile failure (Fig. 3.35), and (2) that σ trends
with G are clearly inconsistnt with toughness results, typically having significant
maxima at G ∼ 10 µm [2] (Chap. 2, Sec. III.F).
As is shown in Fig. 3.13, the limited α-SiC data is generally consistent](https://image.slidesharecdn.com/mechanical-properties-of-ceramics-and-composites-120303143122-phpapp01/85/Mechanical-properties-of-ceramics-and-composites-178-320.jpg)
![178 Chapter 3
with that for cubic, β-SiC, as is expected from the limited anisotropy of noncubic
α-SiC. However, exaggerated growth of α-SiC grains in β-SiC give frequent
fracture origins, e.g. as first shown by Prochazka and Charles [96]. A previous
survey [11] of more limited data of Cr3C2 and WC shows large G behavior like
that of other ceramics, as well as some evidence of finer G branches. Most WC-
Co data appears to form fine G branches, e.g. for pure (larger G) WC data. How-
ever, Roebuck’s [236] WC-Co data from a novel flexure test concentrating stress
in a small test volume showed strengths increasing from 1 to 3 GPa as the origin
(pore) size decreased from ∼ 100 to ∼ 20 µm, which then was constant for failure
from larger grains of ∼ 6 – 30 µm. This may reflect fracture initiation due to Co
deformation, WC-Co miss match strains, or both, again indicating possible
changes in mechanisms at small crack sizes.
AIN data of Rafaniello [237] for machined bars from bodies sintered
with a few percent of different oxide additions (typically leaving ∼ 0.3–2%
porosity) clearly showed strengths increasing as G-12 increased (Fig. 3.28).
More limited data of Rice [15] for a finer G sintered AIN (+ Y2O3) and a hot
pressed body (with CaO addition) is in excellent agreement for machining both
parallel and perpendicular to the bar/stress axis, consistent with such machin-
ing direction effects. Substantial data of Hiruta el al. [238], for AIN bodies
FIGURE 3.28 Flexure strength of dense (< 3% porosity) AIN processed with dif-
ferent additives versus the inverse square root of grain size (G-1/2). (From Refs.
15, 237.)](https://image.slidesharecdn.com/mechanical-properties-of-ceramics-and-composites-120303143122-phpapp01/85/Mechanical-properties-of-ceramics-and-composites-179-320.jpg)
![Grain Dependence of Ceramic Tensile Strengths at ∼ 22°C 179
made with various additions (and < 2% porosity) over a similar G range,
though somewhat (e.g. ∼ 10 – 15%) higher in strength (probably reflecting
moderate test-specimen conditions), are also generally consistent with the
other data and the G-12 dependence.
Though limited in its extent (mainly at intermediate and larger G), a previ-
ous compilation of Si3N4 data [2] indicates typical large and fine G branches.
Plotting of Larsen et al.’s [100] hot pressed and reaction sintered Si3N4 (cor-
rected to zero porosity, Fig. 3.29) shows the same trends, i.e. (1) at finer G,
higher σ’s being from machining flaws rather than microstructural hetero-
geneities, and lower σ’s being from microstructural heterogeneities such as large
tabular grains, and (2) the larger G slope (using Gm) is < KIC (≥ 4 MPa·m1/2, for P
FIGURE 3.29 Strength versus G-1/2 for various, mainly sintered or hot pressed,
Si3N4 bodies. (From Refs. 2, 11, 67, 100.)](https://image.slidesharecdn.com/mechanical-properties-of-ceramics-and-composites-120303143122-phpapp01/85/Mechanical-properties-of-ceramics-and-composites-180-320.jpg)
![180 Chapter 3
= 0). Further, limited fractographic studies showed failure from larger, usually
exaggerated grains [100, 239, 240], as has also been found in self-reinforced
bodies, often associated with excess additive phase [241–244]. Again note that
significant toughness maxima often seen with R-curve effects (Chap. 2, Sec.
III.F) are inconsistent with σ – G-1/2 behavior.
Data on graphites and related carbon materials is limited by the extensive
complications of the typical substantial porosity and local or global grain orien-
tation and resultant anisotropy of properties reflecting the high crystalline
anisotropy, as well as the coupling between these factors. However, limited at-
tempts to sort out the grain size component have consistently shown that strength
decreases with increasing G. Thus Brocklehurst’s review [245] notes such G de-
pendence of graphites, citing in particular work of Knibbs [246]. Rice has also
presented some analyzed data in a survey [11]. While details of this G depen-
dence of strength such as finer and larger G branches are uncertain, they are not
inconsistent with the basic model (Fig. 3.1).
V. COMPOSITIONAL, MICROSTRUCTURAL, AND
SURFACE FINISH EFFECTS
A. Compositional and Nanoscale Grain Effects
A diversity of compositional effects can occur ranging from enhanced to reduced
strength, which may involve a G dependence or obscure it, e.g. the latter via
global effects of body composition on strength through changes in E, or more lo-
cal changes. Effects mainly or exclusively via global changes in properties im-
pacting strength are only outlined here, since they are a very diverse topic and
often require large additions to have substantial effect. However, their effects
must often be recognized in order to adequately identify and understand σ–G re-
lations. Both local and global compositional effects on micro-, especially grain-,
structure are addressed in more detail. An important separation of effects is in
part associated with whether the other constituents are as a second phase or in
solid solution.
Impurities or additives that end up in solid solution commonly increase
strengths of materials in which microplasticity, especially slip, determines their
strength, even at modest levels, e.g. CaO [46–48] (Fig. 3.4), MgO [48, 51, 52]
(Fig. 3.5), and BaTiO3 [41] (Fig. 3.3). Such increased strength should be inde-
pendent of G if a suitable solid solution is achieved, uniformly raising the σ–G-1/2
line. However, a decreased solid solution with reduced temperature–time expo-
sure in obtaining finer G would reduce the σ–G-1/2 slope. Increased solid solution
(and undissolved phase, typically at grain boundaries) would commonly result in
transitioning from microplastically controlled strength at larger G values. For
materials whose strength is controlled by brittle failure from flaws, constituents](https://image.slidesharecdn.com/mechanical-properties-of-ceramics-and-composites-120303143122-phpapp01/85/Mechanical-properties-of-ceramics-and-composites-181-320.jpg)
![Grain Dependence of Ceramic Tensile Strengths at ∼ 22°C 181
in solid solution may affect strength by altering properties such as E, or EA and
especially TEA, but this typically requires substantial contents for significant ef-
fects. However, limited study of such possible effects is not definitive (e.g. for
Cr2O3 in Al2O3 [10, 145].
While added constituents as second phases can influence microplastic be-
havior, e.g. via precipitation toughening, effects of such phases have more exten-
sive effects on failure due to preexisting flaws, and some on failure from
microcracks. Again, a general effect is via changes in properties affecting
strength; a key example of this is effects on Young’s modulus, e.g. of SiO2 (Fig.
3.30), which can lower E substantially. This reduction may or may not depend on
the degree of reaction and hence processing conditions that also affect grain
structure (though this is often not much of a factor in the Al2O3-SiO2 system,
since E is not greatly different for mixtures or compounds of these at a given
constituent ratio). Another, though probably less common, property effect that is
pertinent to the presence of lesser quantities of SiO2 is surface roughness of as-
fired surfaces. Some strength increase of alumina fibers containing or coated
with SiO2 has been attributed to reduced surface roughness [159].
Other diverse compositional effects include effects on microcracking, ei-
ther increasing this by forming phases with substantial expansion differences
with themselves or the matrix, or decreasing this by reducing intergranular
stresses, e.g. as some silica glass phases may. The latter often require less second
phase and are often particularly dependent on wetting effects, which at elevated
temperature can seriously reduce strengths with more extensively coated grain
boundaries. However, serious effects can also occur at moderate temperatures,
e.g. Wakamatsu et al. [247] recently showed lower strength in Al2O3 + V2O3 sin-
tered in air due to formation of an AlVO4 grain boundary phase despite some in-
hibition of grain growth. On the other hand, firing in a reducing atmosphere,
which also inhibited grain growth, resulted in solid solution of the V without sig-
nificant strength degradation, but with a higher surface concentration of V4+.
Another example of variations and complications is with TiO2 additions to
Al2O3, which can substantially aid densification [248, 249]. However, net effects
can again be dependent on processing and use details. Thus beyond the solubility
limit in vacuum sintering, grain growth inhibition occurs [250], but subsequent
air annealing can result in preferential diffusion to grain boundaries and the sur-
face with some reduction in strength. Hot pressing with TiO2 + MgO additions
has indicated loss of MgO inhibition of grain growth [251]. High-temperature air
sintering with TiO2 additions results in large grains, substantial intragranular
pores, very rough surfaces, and resultant low strengths. However, oxygen partial
pressure can have substantial effects on TiO2 in Al2O3 [252]. Thus while exten-
sive second phase precipitation can have various effects, including toughening,
as is discussed for ceramic composites (Chaps. 8 and 9), second phase effects
can be complex, varying, and direct or indirect.](https://image.slidesharecdn.com/mechanical-properties-of-ceramics-and-composites-120303143122-phpapp01/85/Mechanical-properties-of-ceramics-and-composites-182-320.jpg)
![182 Chapter 3
FIGURE 3.30 Effects of SiO2 content on Young’s modulus and tensile and flexure
strengths of alumina bodies based on data for fibers and flexure bars. Such data
is only a rough guide, since effects of different processing, wetting and reaction,
and microstructure are not fully specified or investigated. Curves were obtained
from analysis of Steele et al.’s [122] data for bulk alumina bodies and from data
for alumina rich fibers [162] by using the experimental correction of σ for lower
density, then subtracting the decreases due specifically to porosity, leaving the re-
ductions due to reduced density from the SiO2 additions.](https://image.slidesharecdn.com/mechanical-properties-of-ceramics-and-composites-120303143122-phpapp01/85/Mechanical-properties-of-ceramics-and-composites-183-320.jpg)
![Grain Dependence of Ceramic Tensile Strengths at ∼ 22°C 183
Consider next effects of local compositional variations, which can cause
microcracks, and especially larger local grains, by themselves, or with micro-
cracks, the local phase itself, or both acting as fracture origins. While occurring
in several materials, such origins are commonly observed, especially in larger
grains, in Al2O3 and in situ toughened Si3N4. Thus formation of larger platelet
beta alumina grains that act as origins have been noted in Al2O3 bodies with al-
kali [253], e.g. especially Na, impurities (e.g. in Bayer processed Al2O3) made
without grain growth inhibitors [24] (Figure 1.3A). In Si3N4, large rod shaped
grains singly or more commonly two or more in combination with excess addi-
tive phase are dominant fracture origins as grain sizes and the level of toughness
increase [241–244]. While both the number of grains clustered and the extent of
excess additive phase, as well as the location of these relative to flexure tensile
surfaces, affect the resultant effective flaw size (Fig. 3.31), there has been little
evaluation. Such evaluation is of uncertain relevance to basic σ–G-1/2 behavior,
e.g. for projection of strengths to significantly larger or finer grain sizes, since
such combinations often represent a significantly different flaw population.
Clues to the validity of such extrapolations are the similarity of the larger grain
shapes, phases, associated amount and character of matrix phase, and resultant
fracture mode to the body matrix. However, the above questions are relevant for
understanding strength behavior of such bodies better to control their mi-
crostructure and properties. Such cases of heterogeneous larger grains may also
reflect some local preferred orientation due to interactions of possible relations
of nuclei or the impurity distribution to fabrication effects. Further, impurities or
additives can be interactive with each other, as well as with effects of environ-
ment on strength.
Consider now the more general case of more global, hence typically
more uniform effects of other constituents on grain structure, which are often
sought and used to reduce both average and maximum grain size to increase
strength. Thus note that stoichiometry variations in spinel samples [84, 85]
(Fig. 3.11) had their primary effects via grain size changes, with possible (but
unidentified) secondary effects on physical properties such as Young’s modu-
lus. Similar effects are shown with other mechanical properties in subsequent
chapters. Other constituents (often nonreactive or nonsoluble ones) are also
often added to control grain size, which typically greatly limits exaggerated
gram growth and hence also commonly deviations from equiaxed grain shape.
Key examples of these for Al2O3 are MgO, ZrO2, Mo, and W (Fig. 3.17). Ef-
fects of such additions are commonly primarily or exclusively directly related
to the reduction in grain size, increasing strengths, so long as the level of ad-
dition is limited. At higher levels of additions such grain growth inhibitors
can change effects, e.g. MgO may form larger spinel grains, hence possibly
lowering strengths. Both average and maximum alumina strengths increased
with increasing Mo additions to ∼ 6 vol% and then leveled off (or, especially](https://image.slidesharecdn.com/mechanical-properties-of-ceramics-and-composites-120303143122-phpapp01/85/Mechanical-properties-of-ceramics-and-composites-184-320.jpg)
![184 Chapter 3
for the maxima, may decrease slightly) to the limits of investigation of 16
vol% [141]. This limitation on effects of Mo additions was attributed to coa-
lescence of Mo particles limiting further alumina grain size reductions but
may also reflect some reduced elastic moduli and possibly bonding. However,
while increasing AlON additions to alumina (via reaction processing) from 0
to 40 vol% decreased toughness some, e.g. by 10–20%, it gave intermediate
flexural strengths [147] (Fig. 3.17), consistent with the intermediate grain size
constant over the range of AlON additions (but better retention of strengths at
higher temperatures). On the other hand, increased ZrO2 additions enhanced-
strength and toughness to the extent that transformation toughening occurs
and increases with increasing ZrO2 additions, but at low addition levels (e.g.
<6%), the primary benefits come from maintaining fine G [153, 154]. The
above constituents, whether additives or impurities, are either metals or com-
pounds with anions giving bond strengths and temperature capabilities similar
to those of the matrix material. Significant reductions in strengths at finer
grain sizes, attributed to impurities involving anions of much weaker, much
less refractory compounds, are discussed below.
While examples of added phases inhibiting grain growth are particularly
common in Al2O3, as was outlined above, it is demonstrated in other materials,
e.g. BeO with SiC [174, 175] or Al2O3 [173] additions (Fig. 3.19). Though some
nonoxide materials such as Si3N4 are less prone in their pure state to substantial
grain growth, some important densification aids for nonoxides also significantly
limit grain growth, contributing to improved strength via grain size limitations.
Thus pure dense WC typically has G values ≥ 10 µm, while metal, e.g. Co, addi-
tions generally give dense bodies in which G = 1–3 µm, and pure TiB2 com-
monly has grains 10 to 20 µm, while densification with Ni reduces G’s to 5 to 10
µm (but again with diminishing returns with increasing Ni content) [212]. Cer-
tainly in such cermets and other composites there can be other important effects
increasing strength over and above that due to G reduction, but the latter can be
an important factor.
Consider now effects of impurities characterized by anions that severely
limit refractoriness and other properties that can be pervasive and severe in ob-
taining much finer, especially nanoscale, grain structures in some materials.
These impurities and their effects are almost universally neglected, despite there
being both reasonable theoretical, and especially experimental, evidence of their
occurrence and effects [254, 255]. They are primarily materials such as hydrox-
ides, carbonates, sulfates, etc., e.g. often the sources of common oxide ceramics,
or of impurities (e.g. of Ca), and can form on oxide and on some other material
surfaces. They are neglected because it is commonly assumed that their normally
low decomposition temperatures preclude their presence in a solid body due to
densification temperatures. However, this neglects effects in densification that
inhibit decomposition, hence allowing retention of limited quantities of these](https://image.slidesharecdn.com/mechanical-properties-of-ceramics-and-composites-120303143122-phpapp01/85/Mechanical-properties-of-ceramics-and-composites-185-320.jpg)
![Grain Dependence of Ceramic Tensile Strengths at ∼ 22°C 185
(e.g. from << 1 to a few percent). While there are some chemical interactions
(e.g. with densification aids such as LiF) that limit decomposition, a major factor
is the pressures commonly used to obtain high densities at low temperatures nec-
essary to limit grain growth and hence retention of finer grains from fine parti-
cles. The higher surface areas and lower decomposition temperatures commonly
used to obtain finer powders exacerbate the problem by leaving more of these
impurities in higher surface area powders to be densified. While such impurities
can cause various fabrication problems, they can also be an aid in densification,
e.g. the ready direct hot pressing of magnesium hydroxides of bicarbonates to
near theoretical density (transparent), high purity (≥ 99%) MgO [256].
There are clear, well documented manifestations of these impurities [254,
255]. A simple direct one is IR transmission of frequently transparent or translu-
cent specimens that commonly clearly show anion species discussed above via
their IR absorption bands. More general methods are based on heating, with
weight losses, though commonly limited, often being definitive, as is identifica-
tion of the evolved species, e.g. by mass spectrometry. Particularly demonstra-
tive are clouding, blistering, gross bloating, and in the extreme, crumbling back
to powder (e.g. for MgO and Al2O3) pressed to ∼ full density at room tempera-
ture with ∼ GPa) [254, 255, 257] due to the large, ∼ 104 leverage in the expansion
of the gaseous species released in solid state thermal decomposition on heating.
Turning to the specific effect of such impurities on σ–G relations, it is im-
portant to note that such impurities will commonly be mostly or exclusively at
grain boundaries, where they will typically have pronounced effects even for
very modest quantities, due to their markedly different, usually much lower,
properties than the ceramic itself. Thus strengths of MgO, while typically in-
creasing with decreasing G, e.g. to G ∼ 10 µm or less [48, 50–54, 254, 255] start
decreasing as G decreases further, often falling well below the generally ex-
pected strengths at finer G, especially with higher pressure processing to obtain
finer G bodies with decreased grain size. The latter clearly show the presence of
such anion species as hydroxides and can have their strengths markedly in-
creased, e.g. doubled, by very slowly annealing such specimens to remove the
impurity without serious disruption of the body structure. In such cases, the re-
sultant strengths are those projected from larger grain bodies. Note that the de-
creased strengths of MgF2 at finer G (Fig. 3.24) were correlated with observed
OH absorption bands in the transparent bodies [207]. Similarly, decreased Al2O3
strengths at finer G from higher pressure fabrication [64] and demonstrated high
temperature outgassing of species from hydroxides, carbonates, and sulfates
(e.g. from alum precursors) also strongly indicate the same effects [254, 255].
This is also true of similar reductions in strengths at finer G as higher pressures
are used for processing NiO and Cr2O3 in view of their, and their precursor,
chemical similarities respectively with those for MgO and Al2O3 [64]. A very im-
portant corroboration of these effects is the high strengths obtained in fibers of](https://image.slidesharecdn.com/mechanical-properties-of-ceramics-and-composites-120303143122-phpapp01/85/Mechanical-properties-of-ceramics-and-composites-186-320.jpg)
![186 Chapter 3
these or similar ceramics. The use of only temperature, not pressure for densifi-
cation at low temperatures for fine G, along with very small cross ections of such
fibers, means respectively that limited quantities of such anion impurity species
will be in the fiber, and those there are much more likely to diffuse out of the
fibers at their modest firing temperatures.
The above effects in a few common ceramic oxides and one related nonox-
ide, MgF2, probably reflect only a small fraction of the materials manifesting
such anion impurity effects. Thus for example such effects have been indicated
in Y2O3, manifesting themselves at higher temperatures (due to phosphate pre-
cursors) [255]. Also note that residues from the use of LiF additions that can be
very beneficial to densification of several oxides, especially MgO and MgAl2O4,
can also be detrimental to resultant strengths unless suitably removed by subse-
quent annealing, which is much more feasible in MgO than in MgAl2O4, as was
discussed earlier (Figure 2.12).
Higher densification temperatures required for many other refractory ce-
ramics such as borides, carbides, and nitrides indicate that such effects will be
greatly reduced or not present in these materials from conventional powder pro-
cessing. However, other low-temperature processing of nonoxides via prece-
ramic polymers has similarities to processing of oxides from their common
precursors and results in similar bulk body (Figure 2.14) [255] to fiber strength
differences (Fig. 3.13). Whether such strength differences are related to similar
impurity effects, residual stresses, or other effects, e.g. porosity, that would also
be more serious in bulk bodies versus fibers is not established.
B. Grain Size Variation Effects, Especially
Average Versus Maximum G
Even from a purely abstract standpoint, the issue of what G value to use for cor-
relation with tensile strengths arises given any significant grain size distribution,
strength being controlled by weak links. This issue is heightened by the frequent
occurrence of fracture origins from larger grains or clusters of them, especially
extremes of these from exaggerated grain growth in some materials such as
Al2O3 (especially without grain growth inhibitors), beta aluminas, B4C, SiC, and
Si3N4 (Figs. 1.2–1.5). However, the use of the maximum grain size (Gm), as pro-
posed by some investigators, is a serious oversimplification whose use leads to
serious problems for basic reasons. A fundamental reason from an experimental
standpoint is that larger grains or clusters of them are not always fracture origins,
even when in a region of high to maximum stress. Thus, though not seriously
sought by most investigators (nor for a long time by this author), clear cases of
large grains not being fracture origins have been observed (e.g. Fig. 3.27).
A fundamental theoretical reason for larger grains or clusters of them not
always being fracture origins, even when in a region of high or maximum stress,](https://image.slidesharecdn.com/mechanical-properties-of-ceramics-and-composites-120303143122-phpapp01/85/Mechanical-properties-of-ceramics-and-composites-187-320.jpg)
![Grain Dependence of Ceramic Tensile Strengths at ∼ 22°C 187
is that they may not be sufficiently serious flaws for either or both of two rea-
sons. The first is that larger grains or clusters of them by themselves are not
flaws; they must be associated with some other factor, a defect or stress, that
causes the combination of it and the larger grain(s) to become a source of failure.
Such a factor is typically an associated machining flaw (requiring the larger
grains to be sufficiently near the finished surface), some other crack formed prior
to testing or during testing in combination with the applied stress (e.g. from ex-
pansion differences between adjacent grains or second-phase regions or parti-
cles), or pores (e.g. Figure 1.4B). The second reason that larger grains or clusters
of them are not always fracture origins is that they may not be of sufficient size.
This is a particularly important problem for the finer G branches, which is also
often the region where the difference between Ga and Gm has the greatest impact
on the G-1/2 dependence of strength. Thus, for example, use of a Gm instead of a
Ga value can significantly change (often increasing) the slope of the finer G, es-
pecially at very fine G (where use of Gm has less relevance), thus distorting the
projections of strengths to finer grain sizes. Note that the suggestion of most us-
ing Gm that the slope of the finer G branches is zero is generally not supported by
their own data and is inconsistent with the great bulk of other data.
The above observations imply a significant statistical variation in the oc-
currence of larger grains or clusters of them at fracture origins, e.g. due to the
statistics of association of larger grains and other defects. These statistical effects
are compounded by statistical variations in orientations of easier fracture planes
nearly normal to the applied stress. That the statistics of the spatial distribution
of larger grains is a factor was shown by Stoyan and Schnabel [259]. Using a
pair correlation approach, they showed a higher correlation of the spatial distrib-
ution of larger grains with σ for nearly dense Al2O3 bodies than with variations
of Ga over their limited G range (∼9 to 15 µm).
Larger grains or clusters of them frequently being fracture origins raises
three broad questions concerning their (1) occurrence in terms of types of mate-
rials and body factors, (2) impact on σ–G-1/2 relations, and (3) impact on engi-
neering development. With regard to their material occurrence, the preceding
sections and a previous survey [2] clearly show larger grains as fracture origins
mainly in some noncubic materials such as Al2O3, beta aluminas, B4C, and Si3N4,
except for SiC where noncubic exaggerated tabular grains of α-SiC commonly
form in β-SiC (e.g. above ∼ 2000°C). Similar large grain origins have been re-
ported much less in cubic ceramics, since they typically do not exhibit as much
exaggerated grain growth common to many noncubic materials. In fact in cubic
ceramics cases are seen where some failure initiation occurs from smaller grains,
though in such cases smaller grains at the origin commonly abut one or more
somewhat larger (bur not unusually large) grains, e.g. Fig. 3.10B.
Fracture initiation arising from larger grains is of practical, e.g. engineer-
ing, importance in order to identify their cause(s) so they can be reduced or](https://image.slidesharecdn.com/mechanical-properties-of-ceramics-and-composites-120303143122-phpapp01/85/Mechanical-properties-of-ceramics-and-composites-188-320.jpg)
![188 Chapter 3
eliminated to improve strength and reliability. However, such cases may not be
relevant to basic σ–G-1/2 relations or comparison of grain size dependences of
strength and toughness to understand basic factors controlling fracture or pro-
jection of strength–grain size data to finer G as an indication of potential
strength improvements by reducing grain size. Thus, three cases where larger G
strengths may have limited relevance to basic σ–G-1/2 behavior [2] are where
impurities (1) with a pore (and possibly causing the pore) cause large associated
grains (e.g. Figure 1.4B), (2) cause platelet grains (Figure 1.3A), and (3) cause
large grains that also have associated cracks (Figure 1.2D), or also cause cracks
or reduced properties over the area affected by the impurity.
A fourth, more specialized question is the role of G variations on slip-in-
duced or assisted failure. Theoretically, strength should still be controlled by the
largest grain size, since this gives the longest slip source–barrier distance and
thus the lowest back stress. However, there are the combined statistical effects of
grain orientation on both the resolved shear stress on easily activated slip sys-
tems and the stress normal to the resultant initiated crack that may significantly
affect which grains become fracture origins. There are also issues of effects of
impurities on grain size, e.g. impurities might cause larger grains but increase
their yield stress, thus partly or fully counteracting effects of their larger size in
favoring their being origins. Experimentally it is observed that slip nucleated
fracture does occur from some smaller grains [52], though again there are often
one or more somewhat larger abutting gains. In some of these cases it is not clear
whether the slip nucleated crack formed in the smaller grain with the slip band or
in the abutting grain against which the slip band piled up. Note that slip band
length should on average be controlled by the three-dimensional grain size,
while the failure causing crack is more related to the grain dimensions on the
fracture surface.
Consider now more specific experimental results based mainly on fractog-
raphy, especially in alumina bodies, with some observations secondarily also
from B4C [2]. As noted earlier, identification of specific fracture origins from
larger grains showed plotting strengths versus the observed Gm shifted some data
points from the finer to the larger G branches. However, this also left a number
of data points still remaining on the finer G branch, indicating that the larger
grains or clusters of them were not of sufficient size to be fracture origins by
themselves. Larger grain origins frequently are from clusters of larger grains
making them even more uncertain in their relation to σ – G-1/2 relations. Thus
their frequently being shifted too far to the left, i.e. past the limiting larger G
branch slope for data from failures from a single large or dominating grain, im-
plying that the complete cluster was not the origin, or that the cluster origin was
not directly pertinent to σ – G-1/2 relations, also usually indicated by abnormally
low strengths (e.g. Figure 1.4B). However, use of Gm values transferring varying
numbers of data points to the larger G branch made limited reductions of data](https://image.slidesharecdn.com/mechanical-properties-of-ceramics-and-composites-120303143122-phpapp01/85/Mechanical-properties-of-ceramics-and-composites-189-320.jpg)
![Grain Dependence of Ceramic Tensile Strengths at ∼ 22°C 189
scatter and increases in the larger G branch slope, and limited change in the finer
G branch slopes, e.g. leaving them substantially positive. The number of data
points affected by such evaluations varied substantially, from a high of 16 out of
40 data points (i.e. 40%) to much less (e.g. to ∼7%) [2, 17]. The extent and char-
acter of such Gm corrections increased with the size of the body and fabrication
method, e.g. more for larger die pressed disks and less for smaller extruded rods.
Similar evaluations of the much more limited data based on grain size averages
and ranges (mostly observed on polished surfaces, thus not showing the full ex-
treme of grain size range) ad much more limited impact on scatter and slopes of
the larger and finer G branches. Thus sintered, machined Al2O3 data of Ting et al.
(99+%) [133] and McNamee and Morrell (95%) [127] vs. Gm(from microstruc-
tural, not fractographic, studies) simply moved some data points leftward in the
finer G regime or to the larger G branch. In either case their data agrees with the
other data, as does Alford et al.’s [27] (99+%) machined data vs. Gm(the only
values given).
Thus while there is scatter and uncertainty in many details, which can be
improved some by more detailed evaluation such as of specific G values, there
is a clear, very consistent overall pattern (Fig. 3.1). This pattern is observed de-
spite the diversity of materials, test methods, especially characterization. The
latter is often overlooked but in fact is probably one of the larger factors in vari-
ations, i.e., scatter, between different sets of σ–G data. The techniques of mea-
suring G are often only partially given or not given at all. Thus while many
investigators may state that they used a linear intercept, they frequently do not
tell whether they used a factor, and if so what it was, to convert that linear inter-
cept to a “true G value.” Such values are commonly of the order of 1.5 or more
but can vary from <1 to >2, thus commonly giving at least a 50% variation in G
values and possibly in excess of 100%. It was recommended (Chap. 1, Sec.
IV.B) that the average diameters of grains be measured, e.g., along randomly
selected lines with the average possibly being weighted based upon grain area
considered for σ–G relations. It is important that the G measurement be com-
patible with measurement of individual grains, i.e. where they are fracture ori-
gins (which generally needs to be corroborated by fractographic analysis). It is
also important that the σ and G measurements be self-consistent, i.e. use of
Gmis often not consistent with use of the maximum flexure strength (= outer
fiber stress at fracture, Sec. F).
C. Grain Shape Effects
Grain size effects and issues are often intimately related to various other grain
factors, of which grain shape is the most immediate one. This affects σ–G-1/2 re-
lations directly via effects on G measurements (Chap. 1, Sec. IV) as well as pos-
sible effects on failure causing flaw sizes and shapes. While, much, if not all, of](https://image.slidesharecdn.com/mechanical-properties-of-ceramics-and-composites-120303143122-phpapp01/85/Mechanical-properties-of-ceramics-and-composites-190-320.jpg)
![190 Chapter 3
such grain shape effects can be included in the size, e.g. via equivalent circular
area, this needs further evaluation, because of other possible ramifications or
correlations. Thus grain shape is often interactive with local and global grain ori-
entation, since this can influence the shape and extent of grain growth. Con-
versely growth of nonequiaxed grains may impart some, or enhance, local grain
orientation. The phase content of the body can be important, e.g. as shown by ex-
aggerated grain growth of α-Al2O3 or β-Al2O3 grains in α-Al2O3, of α-SiC in β-
SiC, and of β-Si3N4 grains in α-Si3N4. Other body constituents can enhance or
retard exaggerated grain growth and hence increase or decrease grain elongation
effects. Grain shape effects by themselves and body parameters affecting them
are discussed next, followed by compositional and fabrication effects on grain
shape, then by effects of grain orientation.
Very limited direct assessment of grain shape on tensile strength has
been made, with much of the limited data being of some uncertainty due to
questions of possible impurity or additive effects, e.g. in AIN and Al2O3 bod-
ies. Thus Sakai [260] reported an ∼ 1/3 increase in strength (from ∼ 310 to ∼
470 MPa) of hot pressed AIN with an increase in oxygen content from ∼ 1 to ∼
2.7 wt% (by addition of Al2O3). Part of this increased strength was attributed to
reduction of AIN grain size (from Ga nearly 10 to ∼ 4 µm), but some of this
was probably also due to the distinct platelet character of most grains. (Note
that while Sakai’s AIN without additives had typical equiaxed grains and pre-
dominately intergranular fracture, bodies with the platelet grains showed ex-
tensive transgranular fracture.) Similarly, Komeya and Inoue [261] showed
similar levels and increases of strengths of AIN-based composites with ∼ 25
w/o Y2O3 additions that resulted in similar elongated, but more fibrous and
elongated, AIN grains.
Al2O3, data of Koyama et al. [135] with relatively uniform grains having
aspect ratios of ∼ 2 (e.g. due to limited additives) showed very similar σ–G-1/2
behavior to that of bodies with nominally equiaxed grains (Fig. 3.15), though
some uncertainty exists due to lack of comparison of G measurement techniques
for varying grain shape. While alumina bodies with in situ growth of alumina-
based platelet grains really fall into the category of composites (Chaps. 8–12),
their results are also reasonably consistent with data for pure Al2O3 (Fig. 3.15).
Similarly, strengths of the pure Al2O3 of Yasuoka et al. [262] of ∼ 430 and 660
MPa respectively for Ga ∼ 5 and ∼ 2 µm are in good agreement with Al2O3 data,
as are those of bodies with ∼ 20 vol% platelet grains of lanthanum aluminate of
similar average grain size as the alumina grains (∼ 5 µm). There is also agree-
ment of strengths of similar data of Kim et al. [263] on Al2O3 with and without
additions of Na2O and MgO to form by in situ reaction during sintering to yield
several volume percent long lath, beta-alumina grains of small cross section.
Strength increases, commonly ∼ 20%, but in the extreme nearly 100%, were at-
tributed to combined effects of reduction of the matrix alumina grain size and](https://image.slidesharecdn.com/mechanical-properties-of-ceramics-and-composites-120303143122-phpapp01/85/Mechanical-properties-of-ceramics-and-composites-191-320.jpg)
![Grain Dependence of Ceramic Tensile Strengths at ∼ 22°C 191
formation of more and longer beta-alumina grains. Development of platelet or
other exaggerated grains via other constituents is paralleled by some effects of
impurities (generally with sufficient solubility or reactivity with the body phase).
Note again that alkali, especially Na from Bayer processing of Al2O3, results in
beta-alumina platelet grains commonly acting as fracture origins (Figure 1.3A),
especially in bodies without grain growth inhibitors. Much or all of this data is at
least approximately consistent with data for alumina with the same grain size as
such larger beta-alumina grains. However, strengths may fall below the σ–G-1/2
relation for the pure material because of the platelet size and shape of single, and
especially clustered, platelets, acting as fracture origins, possibly aided by addi-
tive or impurity effects.
The shape (and orientation) of nonequiaxed grains are important in most
properties. It has been recommended that measuring of nonequiaxed grains for
σ–G-1/2 evaluations can be aided by determining the size of an equivalent
equiaxed grain having the same fracture surface area as the actual grain. Gen-
erally this would be essentially the same as the area of an equivalent semi- or
full-circular flaw if an isolated grain is a possible fracture origin (e.g. for the
situation depicted in Fig. 3.31A). This requires recognizing that for single
larger grains at fracture origins the smaller grain dimension is the flaw size
rather than the larger grain dimension (as incorrectly used in some SiC studies
[96]; the larger dimension enters in determining the flaw geometry factor, Sec-
tion VI.B). However, this is not necessarily pertinent to other nonmechanical
properties, and it has limitations for tensile strength and especially other me-
chanical properties.
Of broader concern for tensile strength are common complications such as
grain orientation, and character relative to the matrix grain structure other than
size and shape. Other issues are connection with other flaws, e.g. surface flaws
(Fig. 3.31), pores (Figure 1.4B), or combinations of these. However, a major is-
sue is grain and local compositional variations or more than one grain with or
without local compositional variations acting as fracture origins. While probably
fairly common in several materials, this is common in origins from larger grains
in situ toughened Si3N4. There, large rod or platelet shaped grains singly, or more
commonly two or more in combination with excess additive phase, are dominant
fracture origins as grain sizes and the level of toughness increases. While both
the number of grains in a cluster and the extent of excess additive phase, as well
as the location of these relative to flexure tensile surfaces, impact the resultant
effective flaw size (Fig. 3.31), there has been little evaluation. Again such evalu-
ation is of uncertain relevance to basic σ–G-1/2 behavior, e.g. for projection of
strengths to significantly larger or finer grain sizes, since such combinations of-
ten represent a significantly different flaw population. However, the above ques-
tions are relevant for understanding strength behavior of such bodies to control
better their microstructure and properties.](https://image.slidesharecdn.com/mechanical-properties-of-ceramics-and-composites-120303143122-phpapp01/85/Mechanical-properties-of-ceramics-and-composites-192-320.jpg)
![192 Chapter 3
FIGURE 3.31 Schematic of some possible idealized flaws for fracture initiation
from one or more larger grains. (A) A single larger tabular or rod grain near the
surface with an associated machining flaw. Arrows indicate subsequent crack
propagation.(B) and (C) Possible effects of two crossed grains, which clearly in-
crease the effective flaw sizes (dashed lines), with the extent of this probably de-
pending on the extent of associated excess additive phase (i.e. less of these
indicated by inner dashed lines). (D) Three grains, increasing probable flaw size
(dashed line) some.
D. Grain Orientation Effects
Preferred crystallographic orientation of grains can significantly effect σ. Chan-
dler and colleagues [169, 170] showed higher σ due to preferred orientation in
extruded, sintered BeO from UOX-derived powders having a significant fraction
of needle shaped BeO grains (Chap. 2, Sec. III.H). The degree of preferred orien-
tation increased with decreasing specimen cross section (i.e. with increasing area
reduction in extrusion) and with subsequent grain growth (i.e. ∼ 50% orientation
at G = 20 µm, reaching ∼ 80% orientation at G = 80–100 µm). Several investiga-
tors have shown similar preferred orientation from green body extrusion of
Al2O3 and resultant increases in σ for fracture perpendicular to the extrusion axis
(Chap. 2, Sec. III.H). McNamee and Morrell [127] subsequently corroborated
the earlier favorable effects of extrusion on strengths of Al2O3 reported by Han-
ney and Morrell [126] and concluded that the preferred crystallographic orienta-](https://image.slidesharecdn.com/mechanical-properties-of-ceramics-and-composites-120303143122-phpapp01/85/Mechanical-properties-of-ceramics-and-composites-193-320.jpg)
![Grain Dependence of Ceramic Tensile Strengths at ∼ 22°C 193
tion of the Al2O3 grains was the major factor. Salem and Shannon [264] have
also recently shown a KIC anisotropy for extruded Al2O3, e.g. 2.5 MPa·m1/2 for
the crack plane, and propagation direction perpendicular to the extrusion direc-
tion to 4.1 MPa·m1/2 for the crack propagation direction and plane being respec-
tively perpendicular and parallel to the extrusion direction (with an intermediate
value for the third basic orientation). Similarly, preferred orientation obtained by
hot pressing or hot working (press forging) Al2O3 has been shown to effect
strengths significantly [11]. Preferred crystallographic orientation of MgO by hot
extrusion results in increased strength attributed to reductions in the ease of
crack nucleation via blocked slip bands at grain boundaries due to reduced mis-
orientation between the grains [48, 50, 52]. Other studies of preferred orientation
corroborate and extend these effects [265–267]. These prevalent effects of orien-
tation raise questions of adequately interpreting data for specimens from materi-
als and processes that may yield (generally unexamined) preferred orientation,
e.g. in Al203 studies of Charles [149] and especially in studies of small extruded
Al2O3 and TiO2 rods of Alford et al. [27] (Figs. 3.16, 3.20), where effects could
be greater because of the small rod size.
Dykins’s [268] study of the tensile strength of ice from –27 to –4°C (i.e.
from ∼90 to ∼98% of the melting point) showed marked anisotropy of strength
relative to the axis of the freezing direction. Strengths for stressing normal to the
freezing direction averaged 39 ± 5% of those for stressing parallel with the freez-
ing direction, with little effect of grain size. Strength, even this close to melting,
also commonly followed a G-1/2 dependence (Figure 6.13).
Bodies having both preferred grain orientation and pronounced grain elon-
gation often show greater effects on strength, since both often reflect greater
crystalline anisotropy. Thus data of Virkar and Gordon [195] for beta-alumina
bodies with substantial basal plane texture of the platelet grains in the hot press-
ing plane showed ∼30% higher strength in the finer grain regime for specimens
tested for fracture normal, versus parallel, with this basal texture (Figure 3.21,
i.e. respectively mode A and A′ versus mode C). Clearly much of this difference
is due to the anisotropy of single crystal fracture energy, but it may also reflect
some effect of grain elongation. Note that the latter could also affect the branch
intersection some, but primarily if the grain elongations were oriented to accom-
modate machining flaw elongation for tests based on failure from flaws formed
parallel with the abrasive particle motion.
More pronounced effects are seen in bodies with substantial uniaxial align-
ment of rod or needle shaped grains. Thus data of Yon et al. [269] for bodies of
SbSI (a piezoelectric material of interest) with highly aligned needle grains
showed anisotropies of strengths for four bodies ranging from ∼40 to ∼170%
higher for stress parallel with the C (and elongation) axis of the needle shaped
grains as the grain diameter increased from 0.38 to 600 µm and lengths increased
from 11 to 6000 µm (Fig. 3.32). Though the much less refractory and much](https://image.slidesharecdn.com/mechanical-properties-of-ceramics-and-composites-120303143122-phpapp01/85/Mechanical-properties-of-ceramics-and-composites-194-320.jpg)
![194 Chapter 3
FIG. 3.32 Strength at 22°C versus the inverse square root of the grain size[G]
for SbSI bodies with highly oriented needle grains. Strengths plotted using (1) the
diameter of elongated grains as G for stressing parallel with the axis of elongation
with resultant fracture transverse to the grain axis, and (2) either the length (1) of
the elongated grains or the equivalent diameter (d, assuming an elliptical cross
section of the elongated grains) for stressing normal to the grain orientation axis
for fracture parallel with the grain elongation. Note that in either of the latter cases
the much greater initial rates of strength decrease as the corresponding grain di-
mension increases. (Data from Yon et al. [269].)
softer nature of this material raise questions of the specific mechanisms, the
strengths for stressing parallel with the c-axis indicate finer G branch flaw failure
over most of the G range studied with a branch to either larger G flaw or mi-
croplastic failure at G (= needle diameter) of ∼55 µm. On the other hand, the
much more rapid initial decrease in strengths for stressing normal to the needle](https://image.slidesharecdn.com/mechanical-properties-of-ceramics-and-composites-120303143122-phpapp01/85/Mechanical-properties-of-ceramics-and-composites-195-320.jpg)
![Grain Dependence of Ceramic Tensile Strengths at ∼ 22°C 195
axes may indicate microcrack failure, which may be present for two reasons. The
first is the much larger needle dimension in the plane of fracture for this test ori-
entation and the high anisotropy of the material with substantial, but imperfect,
alignment. Second is that this is an orthorhombic material and thus has unequal
thermal expansion (and other properties) not only between the c direction and a
normal direction but also in the other direction normal to both the c-axis and a
normal to it. A more extreme case of strength anisotropy due to orientation of
elongated grains is that of Ohji et al. [270], who extensively seeded α-Si3N4 with
fine rod shaped β-Si3N4 grains that were oriented by tape casting. Resultant
dense sintered bodies had strengths of 1100 MPa for stressing normal to the re-
sultant elongated grains and just over half of this, 650 MPa, for stressing in the
normal direction. This strngth anisotropy was despite nearly identical toughness
values (∼ 11 MPa·m1/2) and Young’s moduli in the two directions but was similar
to that of the Weibull moduli for strengths in these two directions, i.e. 26 and 46
respectively. Much more extreme is the > 7-to-1 ratio of strengths for stressing
parallel versus perpendicular to the fibrous grain axis of the fine grain jadeite
[271] (Table 2.3). This data, though limited to three strengths for two different
jade compositions stressed parallel with (but only one stressed normal to) the
fiber axis is consistent with a definite positive slope to the finer G branch of the
σ–G-1/2 relation.
Further note the high strength anisotropy of CVD graphite (Table 2.14),
which roughly correlates with the anisotropies of E and K, but much less so for
the orientation giving very high K due to delamination normal to the crack. The
latter orientation is not the strongest, again showing large crack behavior not re-
flecting normal strength behavior. More generally note that while the orientation
dependence of strengths often at least partly correlates with that of K (Sec.
III.H), there are a variety of variations, some with opposing toughness and
strength trends. Examples of such variations besides CVD graphite are oriented
bodies of Al2O3, β-Al2O3, and Si3N4. In all these cases fractography has been
necessary to identify possible or definite orientation dependences of failure caus-
ing flaws, which together with the anisotropy of K explained that of strength.
VI. OTHER FACTORS
A. Flaw Character—Surface Finish Effects
The typically prominent role that surface finish plays in the tensile strength of
ceramics is reflected in their resultant σ–G-1/2 behavior, with the surface finishing
and grain size dependence of tensile strength each providing insight into the role
and character of the other. This is especially true for the dominant surface finish-
ing methods of machining that have been most extensively investigated with re-
gard to the range of parameters, materials, and grain sizes and has been](https://image.slidesharecdn.com/mechanical-properties-of-ceramics-and-composites-120303143122-phpapp01/85/Mechanical-properties-of-ceramics-and-composites-196-320.jpg)
![196 Chapter 3
supplemented by successful fractography. Thus machining effects, which were
the basis for the σ–G-1/2 model (Fig. 3.1) for flaw failure, are discussed first and
most extensively, but with some discussion of the more limited data on effects
for as-deposited or as-fired or annealed and chemically polished surfaces.
Fractography showed that to a first approximation machining flaw sizes
causing failure for a given material and machining condition were independent
of grain size (including single crystals, i.e. for G∼ ∞, G-1/2 = 0) [13, 15–22, 138,
142–144], e.g. note machining flaws in Figs 3.7, 3.9, 3.10BC, 3.12, and 3.16. A
central aspect of this is that the larger and finer G branches intersect when the
flaw size and grain size are ∼ the same (recognizing that the former is measured
as a radius and the latter as a diameter, as well as effects of varying flaw and
grain factors). The first of two machining factors that corroborate this model is
that more severe machining, commonly by use of coarser abrasive grits, reduces
strengths across the limited, but useful, finer G ranges encompassed [24–26].
Though it has been claimed that such finer G branches have no G dependence,
the data cited for this is at best insufficient, and other data clearly shows some G
dependence (e.g. Figs. 3.10–3.19), as indicated theoretically below.
The second aspect of machining effects that provides even stronger sup-
port for the basic model of Fig. 3.1 is the effect of machining direction on
strength. It has been extensively shown in a variety of single- and polycrystal
ceramics that tensile testing a machined body as a function of the angle of the
stress axis relative to the direction of motion of the abrasive particles in ma-
chining plays a major role in resultant strengths [15–22, 142–144]. Thus
strengths for samples of the same body machined in a direction parallel with
uniaxial stressing are commonly nearly twice the strengths of the same samples
tested machined in a direction perpendicular. This has been extensively shown
to be due to abrasive motion generating two flaw populations, one of elongated
flaws, and the other of ∼ half penny cracks respectively parallel and normal to
the abrasive motion. Both flaw populations are ∼ the same depth, and while
there are some other variations in shape, the differences in flaw aspect ratios,
commonly of 2 to 4 versus ∼1 respectively, is the predominant factor in the re-
sultant strength difference. Thus specimens uniaxially tested in two different di-
rections relative to the abrasive machining direction result in two different finer
G strength branches. Other limited variations in flaw dimensions are indicated
experimentally, consistent with limited theoretical dependence on E, H, and K
per Eq. (3. 2), as is discussed later.
Recent further evaluation or earlier and additional machining direction
studies show that such machining direction effects are grain size–dependent, and
that this dependence significantly further corroborates the basic model
[142–144]. Thus, as summarized in Fig. 3.33, the difference in strength as a
function of stress versus machining direction goes to ∼ 0 at an ∼ common G
value, designated GC, but increases as G either decreases or increases from this](https://image.slidesharecdn.com/mechanical-properties-of-ceramics-and-composites-120303143122-phpapp01/85/Mechanical-properties-of-ceramics-and-composites-197-320.jpg)
![Grain Dependence of Ceramic Tensile Strengths at ∼ 22°C 197
FIG. 3.33 Percent change in σ vs. G-1/2 for various materials for machining per-
pendicular to the tensile axis vs. machining parallel with it. Machining was by dia-
mond grinding except for one set of Al2O3 tests sanded with SiC fixed abrasive.
All data shows reduction in the strength anisotropy as a function of stress versus
machining direction as G increases to intermediate G values and then increases
again consistent with substantial strength anisotropy as a function of machining
direction in single crystals. The shift to higher values at intermediate and large G
as well as single crystal for MgO is attributed to surface work hardening in these
ranges [49]. (Published with the permission of the Journal of the American Ce-
ramic Society [143].)
GC value, for a given machining operation. This is completely consistent with,
and strongly corroborates, the basic model that as the grain and flaw dimensions
approach one another, the grain dimensions begin to constrain, hence become,
the flaw dimensions. However, this is more significant for elongated flaws, since
their greater length versus depth becomes incompatible sooner with grain dimen-
sions as these approach each other than does the depth of the flaws. (Also, flaw
depths are probably a more basic result of the flaw generation process, e.g. as in-
dicated by depths of both flaw populations being similar.) As G decreases below](https://image.slidesharecdn.com/mechanical-properties-of-ceramics-and-composites-120303143122-phpapp01/85/Mechanical-properties-of-ceramics-and-composites-198-320.jpg)
![198 Chapter 3
GC for a given machining operation, flaws become progressively larger than the
grain size and thus progressively less constrained in shape by individual grain
boundaries. Conversely, for G > GC, flaw dimensions are progressively < the G
values, so there is progressively less effect of the boundaries of the single grain
in which the flaw formed on the flaw shape.
It is important to note that there are three intrinsic statistical effects im-
pacting the specific relations between flaw and grain dimensions as they ap-
proach one another, so the dimensions of the failure causing flaws are only
approximately those of the grains at the branch intersections or the strength
anisotropy being zero at GC. First is the variation in grain size, which will
vary from specimen to specimen, with greater variations between different
bodies, but some between a given set of samples, as well as within specific
samples. An important one in larger G machined samples is truncation of sur-
face grains (Figs. 1.2A&C, 3.9). Thus there will be some tendency for branch
intersections and GC values to be toward the larger size of the G range, but
other factors such as truncation of larger grains can partially counteract such
shifts. Further, orientation of individual surface grains relative to preferred
planes for both forming of flaws and their causing subsequent mechanical
failure is important. Additionally, favorable orientation of two adjacent sur-
face grains can allow flaw formation partly in both grains instead of just one
even though the flaws and grain dimensions are similar. While the above grain
orientation affects impact flaw formation, this is also impacted by the second
factor, the specific local micromechanics of each abrasive particle–surface in-
teraction, e.g. of the size, shape, and force on the particle forming flaws. The
impact of this is clearly indicated by flaws not forming in much larger grains
despite their being favorably oriented (as shown by their subsequent cleavage
fracture, Fig. 3.27).
There is a general and two specific effects that need to be considered in
evaluation of effects on σ – G relations. The general one is introduction of sur-
face compressive stresses, which occurs in all materials and obviously does not
override effects of machining direction. However, whether such effects change
with G and possibly alter the anisotropy of strength due to machining direction
with G is unknown. The first of the two specific cases is work hardening of sur-
face grains of materials with easier activated slip such as MgO and CaO. How-
ever, this merely shifts the relative machining anisotropy curve (Fig. 3.33)
higher. The second specific case is the substantial surface transformation of
tetragonal to monoclinic ZrO2 from machining of TZP bodies with ∼ 20% in-
creased strengths attributed to expected surface compression [272]. Thus while
the baseline for measuring such strength increases is uncertain, study shows sub-
stantial reduction, or complete elimination, of strength anisotropy as a function
of machining direction possibly for some TZP and PSZ poly- and especially sin-
gle crystals [273]. However, there is no evidence that these trends for toughened](https://image.slidesharecdn.com/mechanical-properties-of-ceramics-and-composites-120303143122-phpapp01/85/Mechanical-properties-of-ceramics-and-composites-199-320.jpg)
![Grain Dependence of Ceramic Tensile Strengths at ∼ 22°C 199
bodies change σ – G relations. In fact, the similar effect from fine G to G = ∞ re-
inforces similar behavior across the complete G range.
An important question is what effects other surface treatments have on σ –
G relations. Abrasion, wear, and impact (e.g. from tumbling in a mill) are exam-
ples of other mechanical effects on surfaces. The nature and size of many impact
flaws [16] suggests that they may follow similar trends as for machining flaws.
This is also suggested by similar increases in strengths as a result of grit blasting
TZP bars as for machining them [8, 274, 275].
Consider now other surface finishing effects, primarily of as-deposited or
as-fired or annealed surfaces, which have received only limited investigation.
Some single crystal, and especially glass, specimens can commonly be flame or
chemically polished to remove surface flaws such as from machining and
achieve high strengths, so there is a common impression that as-fired or annealed
surfaces yield higher strengths. However, such surface treatments are commonly
not applicable to, or much less effective with, polycrystalline samples due to
probable intrinsic factors such as TEA and EA, and are clearly limited by a vari-
ety extrinsic surface effects. The latter arise from factors such as sintering of dust
(e.g. specimen powder, including agglomerates from spray drying) on their sur-
face as well as flashing and other surface and internal variations resulting from
imperfect specimen forming and densification, all leading to stress concentra-
tions limiting strengths. Further, machining again commonly introduces some
surface compression stress which aids strengths, as directly shown by Hanney
and Morrell [126], introducing some, usually moderate, uncertainty in calculat-
ing flaw sizes.
For the above reasons, as-deposited, fired, of annealed surfaces often do
not give the highest strengths, but even in some, possibly many, of these cases
useful σ – G-1/2 data may be obtained, but probably more scattered. Direct com-
parison with machined samples is valuable. Thus Hanney and Morrell [126]
showed strengths of their as-fired Al2O3 bodies generally being less than that for
specimens that were diamond ground. (Mechanical polishing resulted in σ
roughly intermediate between these two levels.) They also showed that anneal-
ing of bars with coarse, but not fine, machining reduced σ. Similarly, Steele et al.
[122] showed strengths of ground and polished Al2O3 bars being similar to each
other, but greater than as-sintered or thermally etched specimens. McMahon
[276] showed that Al2O3 specimens tested as-fired had lower strength, those
ground perpendicular to the specimen and tensile axis intermediate strengths and
those ground parallel with the specimens and tensile axis the highest strengths.
Lino and Hubner [277] also showed lower as-fired vs. machined strengths of
Al2O3 (P∼0.02, G∼4 µm), but an increase of the latter upon annealing (e.g. at
1400–1500°C). They also showed that machining increased strengths of their as-
sintered Al2O3 bars (P ∼ 2%, G ∼ 4 µm) by ∼100 MPa, i.e. ∼50% to ∼300 MPa
(still low for such bodies), but annealing near the original sintering conditions](https://image.slidesharecdn.com/mechanical-properties-of-ceramics-and-composites-120303143122-phpapp01/85/Mechanical-properties-of-ceramics-and-composites-200-320.jpg)
![200 Chapter 3
increased the machined strengths by ∼ 100 MPa (Weibull moduli were similar
for all three surface conditions at ∼ 17). Earlier studies of Rice [17] showed
strengths of machined samples of dense Al2O3, MgAl2O4, and ZrO2 (+ 11.2%
Y2O3) decreasing upon annealing at 1400, 1600, and 1670°C (in general G in-
creased only at 1670°C).
With limited, or no, extrinsic sources of failure, e.g. pores, or surface irreg-
ularities, the presence of (intrinsic) grain boundary grooves on as-fired surfaces
also limits strengths. Coble [23] has theoretically shown that such grooves act as
failure causing flaws. Such grooves are expected to be less severe for finer G
bodies than for coarser ones due to the relatively lower temperatures, shorter
times, or both used in obtaining finer G, thus introducing a G dependence of such
grooves. Coble indicates that the equivalent flaws will generally be related to G
and vary in the range of G/15 to ∼G. Support for the deleterious effects of grain
boundary grooving and its correlation with G is provided by the general fiber re-
sults as well as Simpson’s [156] fiber failures [3] and increasing the σ of FP
fibers ∼25% by smoothing their surface with a SiO2 coating [159, 160].
Chemical finishing of polycrystalline materials has received very limited
study, mainly because of frequent adverse affects of porosity, impurities, and
varying grain orientation, often resulting in rough or irregular, hence weaker,
surfaces. Evans and Davidge [72] showed a small (<10%) strength increase for
their chemically polished UO2 (P∼ 0.03) over the temperature range compared
(to 1200°C), with this increase being greater for their ∼25 µm vs. ∼8 µm G body.
Similarly, Gruszka et al.’s [124] chemical finishing of 99.5% Al2O3 electronic
substrates (G ∼ 0.9 µm, P ∼ 3%) showed both some σ increases and decreases vs.
as-fired or diamond lapped surfaces (both giving σ ∼ 400 MPa). They showed an
approximate inverse σ-surface roughness correlation, i.e. a maximum σ of 550
MPa from use of molten borax with among the lowest surface roughness (2.9
µin.) similar to that for the as-fired and diamond lapped surfaces (respectively
2.6 and 2.0 µin), with σ ∼ 410 MPa. This supports the implication from glass,
single crystal, and more specifically fiber, processing that achieving very smooth
surfaces of dense, fine grain polycrystalline bodies can give substantially higher
σ. Strengths of 2–5 GPa reported for small CVD SiC specimens (P = 0) with
very smooth as-deposited surfaces (apparently due in part to the extremely fine
G ∼ 0.01–0.1 µm) clearly show that such surfaces can yield high strengths [111,
112]. However, abrasion even by only light sanding with SiC abrasive paper
readily dropped these very high strengths to normal levels observed for conven-
tional SiC bodies, consistent with the resulting flaw sizes observed (which also
indicate lower KIC e.g. by ∼ 20%). Such σ decreases with abrasion were greater
than those observed for c-axis sapphire filaments [167].
An important question is what other flaw sources and populations can give
similar σ–G-1/2 behavior as for specimens whose strength is primarily determined
by surface flaws in machined or as-fired surfaces. Clearly, handling, impact, etc.](https://image.slidesharecdn.com/mechanical-properties-of-ceramics-and-composites-120303143122-phpapp01/85/Mechanical-properties-of-ceramics-and-composites-201-320.jpg)
![Grain Dependence of Ceramic Tensile Strengths at ∼ 22°C 201
of as-fired or deposited surfaces result in flaws that are generally similar to ma-
chining flaws, thus expected to give similar σ – G-1/2 behavior. Two other pri-
mary flaw sources are compositional variations (including impurities) and
porosity, with heterogeneities of these often being particularly important sources
of failure. Impurities and other compositional variations often have their main
influence via effects on grain size, especially that local to a serious composi-
tional fluctuation (e.g. Figure 1.5), in which case similar σ – G-1/2 trends are
likely to result (but require identification of effects of such local G changes, typ-
ically by fractography). On the other hand, impurity particles of random size, lo-
cation, or both are likely to be simply a source of scatter for most mechanisms
envisioned, e.g. microcracking, thus obscuring or eliminating normal σ – G-1/2
behavior. The other major source of failure is pores or pore clusters. Rice [6,
144, 273] has shown that machined alumina samples with fine porosity fail from
machining flaws similar to those found in dense bodies and thus should show the
expected σ – G-1/2 behavior (at least over the ranges in which G can change with-
out significantly changing the amount or character of the porosity). Recently,
Zimmermann et al. [278] showed that large (artificially introduced) isolated, uni-
form spherical pores that were fracture origins in otherwise dense alumina sam-
ples showed strengths decreasing as G increased from 0.8 to 9.2 µm, following
the same trend with G as for dense bodies without the large pores, but at about
30% lower strengths for failure from the isolated large pores. Zimmermann and
Rödel [279] discussed this trend, indicating that it probably reflected localized
cracks, rather than the postulated circumferential cracks around the pores, as also
suggested by Rice [6, 280]. This thus indicates that some larger pore failures can
give similar σ – G-1/2 behavior as for dense bodies, but this probably requires that
the pore size, shape, spatial distribution, and surrounding microstructure be
fairly uniform to limit data scatter, which could obscure or obliterate any consis-
tent trend as a function of G. Another issue that needs to be addressed to assess
the extent of such pore-grain failure is demonstrating such pore-grain failure re-
lations over a larger G range, especially into the larger G regime and where spac-
ing of larger pores is variable, which typically occurs and greatly complicates
pore induced fracture [6, 280]. The generalization of the two-branch σ–G-1/2 be-
havior proposed by Zimmermann and Rödel [279] is a stimulus for further study
but appears limited by the above-noted variations of individual mechanisms, as
well as the complications of various combinations of mechanisms, e.g. of pores,
second phases, and larger grains.
B. Test Condition Effects on Strength–Grain Size Behavior
Effects of test conditions on resulting σ–G-1/2, which entail specimen size and
geometry, and test factors, e.g. uniaxial versus biaxial stress, test environment,
and cyclic stressing, need to be considered. The primary effects of specimen](https://image.slidesharecdn.com/mechanical-properties-of-ceramics-and-composites-120303143122-phpapp01/85/Mechanical-properties-of-ceramics-and-composites-202-320.jpg)
![202 Chapter 3
size, geometry, as well as some aspects of test methodology are due to changes
in the amount of materials being at substantial stress levels and hence the avail-
ability of different flaw types and sizes to cause failure. As noted earlier, use of
flexure specimens of rectangular cross section raises some questions with regard
to the appropriateness of using Gm, since the latter usually represents a volume
flaw distribution, whereas this test configuration favors surface failure. The use
of round versus rectangular cross section flexure rods is even more questionable,
since this presents significantly more surface area of varying stress from which
failure can occur. Binns and Popper [121] showed σ of round rods (1 cm dia.)
averaging 25% higher (ranging from 20% lower, the only case of round rods be-
ing weaker than rectangular rods, to as much as 90% higher) than for 1 cm
square bars of the same materials for 10 different alumina bodies. Similarly, Mc-
Namee and Morrell’s [127] 95% Al2O3 fabricated by various means (G = 3–7.5
µm, P = 0.035–0.05) showed σ of round rods and rectangular bars made by ex-
trusion higher by 40 and 60% respectively than for bars machined from die
pressed, isopressed, or slip cast plates. Further, within an extruded body σ was
greater for fracture perpendicular vs. parallel with the extrusion axis. Although
all three of their direct comparisons showed as-fired strengths 10% higher than
for as-machined surfaces, their machining was with a somewhat coarser [180]
grit transverse to the bar lengths, which gives lower σ. Fractographic determina-
tion of specific failure origins, if sucessful, is the basic solution to this problem.
However, since this is often not done, and is not always practical or feasible, the
next best procedure should be to attempt at least an approximate statistical eval-
uation of the frequency of potential failure sources, e.g. as done by McNamee
and Morrell [127]. They showed the occurrence of larger G (> 70 µm) varying
from 0.01/mm2 to 0.45/mm2 in their samples. Thus three point flexure (prefer-
ably with rectangular cross section bars to avoid large surface areas, at variable
stress) more closely approximates average G dependence of σ.
That statistical effects continue to small size and high σ is shown by the
definitive gauge section dependence of σ in tensile testing fibers [158–165]. This
is consistent with the frequently low Weibull moduli in such tests, e.g. 4–6. The
frequent correspondence of tensile strengths of fibers and corresponding flexure
strengths of small bars (e.g. Figs. 3.17, 3.18, and 3.21) indicate similar volumes
under high stress.
An important question is the effects of stress conditions, e.g. biaxial versus
uniaxial stress, on σ–G-1/2 behavior, both due directly to the differences of the
stress states as well as indirectly on other factors such as slow crack growth and
microcracking. One of the few tests of these issues is data of Chantikul et al.
[131] on biaxial strength as a function of G (Fig. 3.14). Their results cannot be
distinguished from uniaxial results, indicating little or no effect of biaxial load-
ing, but more testing of other materials and microstructures is needed. Another
stress factor is repeated stressing, i.e. mechanical fatigue. Aspects of such tests](https://image.slidesharecdn.com/mechanical-properties-of-ceramics-and-composites-120303143122-phpapp01/85/Mechanical-properties-of-ceramics-and-composites-203-320.jpg)
![Grain Dependence of Ceramic Tensile Strengths at ∼ 22°C 203
were briefly outlined in Chapter 2, Section II.I, but these were focused on large
crack behavior with very little attention to G effects. One exception to this was
Lewis and Rices’ [285] tests of Lucalox Al2O3, which indicated an intrinsic fa-
tigue mechanism due to microcracking from TEA (or EA), which would thus be
G dependent.
Consider next effects of environmentally driven slow crack growth, i.e.
beyond subcritical growth considered below. Environmentally driven crack
growth, which has been evaluated primarily, if not exclusively, by uniaxial
stressing, clearly increases flaw sizes as the rate of crack growth increases,
stressing rate decreases, and strength increases (e.g. with decreasing G). How-
ever, intrinsic increases in SCG as G decreases (Figure 2.7) would, at least par-
tially, if not completely, counter this trend. As G increases down the finer G
branch, the resulting decreased strength will decrease the contribution of slow
crack growth, hence also adding to the slope of the finer G branch. As strengths
approach those of the intersection on with the larger G branch, i.e. with the grain
dimensions approaching those to contain the failure causing flaw in a single
grain, crack growth rates will transition from those for polycrystalline samples to
those of single crystals or of grain boundaries. Besides possibly further changing
crack growth rates, this may result in a change in fracture mode as discussed in
Chapter 2, Section III.A.
Kirchner and Ragosta [281] calculated that small (e.g. 10 µm) flaws
within single Al2O3 grains would not lead to catastrophic failure at single
crystal KIC values unless G was ≥ 100 µm and loading rates high (e.g. 104
MPa/s) to limit environmentally induced slow crack growth. They concluded
that cracks would otherwise be arrested as the grain boundary and failure
would be determined by the polycrystalline KIC. While these calculations
show that large Al2O3 grains could be failure sources at single crystal KIC val-
ues, their assumptions lead to more restricted calculated growth. They as-
sumed that the transition from single to polycrystalline KIC values occurs at
the first grain boundary rather than over a range of e.g. 2–6 grains, as indi-
cated for materials investigated [28] (Figure 2.16). They also assumed that
TEA stresses were not a factor in such slow crack growth, i.e. flaws would not
grow in the absence of external mechanical stressing, which has received lit-
tle direct study. However, McMahon’s [276] and Rice’s [282] Al2O3 studies
show that this either does not occur or readily saturates early in the life of a
specimen. That the latter may be the case is shown by observations of Hunter
et al. [283, 284] that microcracking of pure HfO2 upon cooling in a sealed fur-
nace only began occurring upon opening the furnace to air and continued for
several tens of hours before saturation.
Gruver et al. [128] showed similar 96% Al2O3 origins from isolated large
grains over a range of temperatures. Using 1/2 these Gm values as c for the eight
large grain (of 20) fracture origins in liquid N2 gave KIC 3.9 ± 0.6 MPa·m1/2, and](https://image.slidesharecdn.com/mechanical-properties-of-ceramics-and-composites-120303143122-phpapp01/85/Mechanical-properties-of-ceramics-and-composites-204-320.jpg)
![204 Chapter 3
seven of 20 in the 95% (and two of 20 hot pressed) Al2O3 having large grain ori-
gins at 22°C gave KIC 3.2 ± 0.3 MPa·m1/2. While these all generally agree with
the polycrystalline KIC, all gave at least one value ≥ two standard deviations be-
low the average, suggesting that in those cases the grains were not the complete
flaw, i.e., c extended into the surrounding average grain structure, so plotting σ
value for those Gm values is questionable. Similarly, it cannot be ruled out that
large grains giving the highest calculated KIC values may have resulted in failure
before the flaw reached the full grain size, i.e. the critical flaw size was <G.
Chantikul et al.’s [131] model based on crack bridging is an interesting ex-
tension of the basic fracture mechanics-c/G model. It also predicts two branches,
with branch intersections at c ∼ 2 – 3G. They showed the larger G slope decreas-
ing as G increases, indicating a transition to single (or bi-) crystal strengths. Al-
though it predicts a zero slope for the finer G branches, factors leading to a
nonzero slope in this region could be included. Use of a grain boundary KIC of
2.75 MPa·m1/2 Al2O3 is questionable in view of KIC for many common orienta-
tions of sapphire being ∼ 2 MPa·m1/2, and grain boundary values commonly be-
ing ∼1/2 such values (Chapter 2, Section III.E). However, there are more
fundamental issues concerning their model. It is based on TEA stresses, yet the
same type of σ–G-1/2 behavior is observed for cubic materials not having any
TEA stresses. Although bridging has been observed in cubic as well as noncubic
materials, there are a variety of concerns regarding the applicability of bridging
to normal strength behavior, as discussed earlier and later.
VII. EVALUATION OF THE Σ–G-1/2 MODEL PARAMETERS
A. Overall Review and Assessment
The primary failure mechanism in most ceramics at or near room temperature is
brittle failure from preexisting flaws per Fig. 3.1. The first of two deviations
from this is failure from a substantial density of microcracks that are preexisting,
developing, or both relative to stressing to failure. These lead to rapid initial
strength decreases (commonly closely paralleling those of the elastic moduli)
with increasing G when Gs for substantial microcracking is reached or exceeded.
Presumably strength shows normal G dependence for the preexisting (e.g. ma-
chining) flaw population at finer G (< Gs) with a transition to microcrack deter-
mined failure that depends on the G distribution and TEA, and possibly EA,
specifics. The other deviation is microplastic initiation of flaws and failure in
some ceramics. This becomes more marginal as stresses for microplasticity in-
crease due to intrinsic effects at any temperature, decreasing temperatures, or in-
hibition of the microplasticity by impurities or additives. Higher stress for
microplasticity makes this failure mechanism more dependent on better surface
finish, larger G, and higher temperatures. The G = ∞ strength projection and in-](https://image.slidesharecdn.com/mechanical-properties-of-ceramics-and-composites-120303143122-phpapp01/85/Mechanical-properties-of-ceramics-and-composites-205-320.jpg)
![Grain Dependence of Ceramic Tensile Strengths at ∼ 22°C 205
tercept from microplastic failure is typically the stress to activate the microplas-
ticity, which is usually ∼ the strength of single crystals oriented for easiest acti-
vation of the microplasticity determining failure of polycrystalline bodies. Such
extrapolation of polycrystalline to single crystal strengths, rather than polycrys-
talline strengths falling well below single crystal strengths, is a basic difference
respectively between microplastic and preexisting flaw failure. Increasing com-
petition of preexisting flaw versus microplastic failure as microplastic stresses
increase commonly results in a switch from microplastic to preexisting failure as
strengths increase with decreasing G. The grain size of this transition should in-
crase as the surface finish quality decreases and the stress for the microplasticity
increases, and again appears to occur when c∼ G/2. Thus all three failure mecha-
nisms will commonly have a finer G branch due to preexisting flaw failure.
The primary factors controlling tensile strength in brittle failure are typically
the initial flaw, any slow crack growth, and the toughness controlling its propaga-
tion to failure. Conventional fracture mechanics approaches to the G dependence
of strength have focused on toughness, neglecting possible variations of flaw char-
acter, i.e. size and location relative to the grain structure, and thus does not provide
guidance for understanding or predicting the slopes and intersection(s) of the finer
and larger G branches. The slopes of these branches are important first and fore-
most since this is a primary tool for estimating the benefits of reducing G and sec-
ondarily since most proposing use of Gm assumed (based on limited data) a zero
slope of such branches. However, data clearly shows variable, often substantial,
positive slopes with some possibility of zero or even negative slopes, all of which
are consistent with expectations of varying flaw and other changes with G. A key
factor in the finer G branch slopes is that while, to a first approximation, flaw size
is independent of G, there are second-order variations. These are indicated for ma-
chining flaws by the following representative theoretical equation predicting ef-
fects of material properties on machining flaw sizes [286]:
E 1/ 3 L 2 / 3
c ∝ (3.2)
H K
where E=Young’s modulus, H=hardness, L=load, and K= the appropriate tough-
ness. For c < G the toughness should be the appropriate single crystal or grain
boundary values, while that for c> G should be a polycrystalline value for small
cracks, i.e. typically no R-curve or related effects.
Consider first effects of the above flaw size variations as a function of G.
In a given material E typically has no G dependence, and K often has limited or
no G dependence at finer G but clearly decreases for c approaching G/2. H mea-
surably increases with decreasing G in the finer G region (Chap. 4, Sec. II), thus
indicating some limited reductions in c with decreasing G. These effects increase](https://image.slidesharecdn.com/mechanical-properties-of-ceramics-and-composites-120303143122-phpapp01/85/Mechanical-properties-of-ceramics-and-composites-206-320.jpg)
![206 Chapter 3
strength as G decreases, giving a positive finer G slope. Different materials with
different E and K values would shift flaw sizes, and thus also strengths, some in
the finer G branches, with differing G dependences of K varying finer G branch
slopes. Note also that the minimum in H (Chap. 4) occurs when the indent and
grain sizes are similar, which may be a factor in the grain size where c ∼ G/2.
Similar trends are expected for as-fired surfaces. Thus a decrease in flaw
sizes in as-fired surfaces as G decreases is also expected, since decreasing grain
sizes are typically obtained by reduced temperature–time exposure of the sam-
ple, e.g. of fibers. Such reduced exposure reduces the extent of grain boundary
grooving associated with finer G, and the finer G itself increases the tortuosity of
the sequence of grain boundary grooves acting as a flaw, decreasing severity of
the resultant flaw, often probably more than for machined flaws, indicating
higher positive finer G slopes.
Turning to experimental evaluations of flaw populations, much of this
must be inferred from the G dependence of strength, particularly for as-fired sur-
faces, since there is no independent flaw data for them. This is also partly true for
machined sample, since while there is considerable flaw data for them, detailed
comparisons of different materials for varying G as a function of machining pa-
rameters are limited. However, extensive studies of machining flaws, mainly by
Rice and colleagues [12, 13, 15–22], show that machining flaw sizes for failure
for a broad range of ceramics with typical moderate to finer grit diamond grind-
ing do not vary widely, e.g. c generally is in the 20–50 µm range. However, ma-
terials of higher than normal machined strengths such as WC-Co, TZP, and some
Si3N4 bodies (Fig. 3.34) have finer machining flaw sizes controlling failure, e.g.
more commonly in the 10–20 µm range (Fig. 3.34). Thus such bodies with high
toughness at small crack sizes, typically in finer G bodies with effective toughen-
ing at finer G, have smaller flaw sizes, which are less likely to be affected signif-
icantly by R-curve and other related large crack effects but may experience more
benefit from surface compressive stresses than is typical for most machining.
Besides statistical variations of factors noted above, there are other im-
portant sources of differing flaw dependences on G at finer G. The first of three
to be noted is preferred grain orientation, local or global, especially if it changes
with G. This clearly occurs, e.g. in BeO [169, 170], where extrusion results in
some preferred orientation of substantially nonequiaxed powder particles, with
the orientation then increasing with grain growth, apparently due to preferential
growth of oriented grains. The σ–G-1/2 for such bodies, though limited, indicates
a negative finer G branch slope which is consistent with the data showing orien-
tation increasing with G, which could counter the normal strength decrease as G
increases.
A second source of changing finer G slopes is changing flaw shape as c in-
creases to approach G/2. Strength anisotropy studies as a function of stress ver-
sus machining directions originally did not focus on effects of G on the extent of](https://image.slidesharecdn.com/mechanical-properties-of-ceramics-and-composites-120303143122-phpapp01/85/Mechanical-properties-of-ceramics-and-composites-207-320.jpg)
![Grain Dependence of Ceramic Tensile Strengths at ∼ 22°C 207
FIG. 3.34 SEM fractograph showing the fracture origin (arrow) in a dense hot
pressed, higher strength Si3N4 from a typically smaller than normal machining
flaw (shown at ∼ 10-fold higher magnification in the insert).
flaw elongation parallel with abrasive motion. However, evidence now shows
that flaw elongation is reduced as the largest flaw dimension, its length in this
case, approaches the dimensions of the surface grains being machined [143, 144,
273]. As G increases toward and beyond the flaw dimensions, grains first begin
to constrain flaw elongation, then the smaller flaw dimension, i.e. its depth. Fur-
ther G increase then progressively relaxes these constraints so that anisotropic
strength as a function of machining direction increases with further G increase.
This is extensively shown by studies of strength anisotropy as a function of ma-
chining and stressing directions (Fig. 3.33) and is supported by some direct frac-
tographic evidence. The progressive reduction in flaw elongation as G increases
clearly reduces slopes of finer G branches for specimens tested with the stress
axis normal to the machining direction. Machining studies indicate that finer G
branch slopes for such specimens are often ∼ 0 and may actually become nega-
tive as grain sizes approach the flaw depths [17].
A third possible source of changing finer G slopes is changing mechanisms
involved in the failure process. An example of this is increasing contribution of](https://image.slidesharecdn.com/mechanical-properties-of-ceramics-and-composites-120303143122-phpapp01/85/Mechanical-properties-of-ceramics-and-composites-208-320.jpg)
![208 Chapter 3
microcracking as G increases. Thus, Tomaszewski’s data for Al2O3 [134] shows
evidence of microcracking increasing as G increased via decreased E (from
strength not vibrational measurements). Such increasing microcracking as G in-
creases should increase the finer G slope as indicated by σ–G-1/2 trends for mi-
crocracking materials (Fig. 3.23) as well as similar associated decreases in E.
Such microcrack contribution to the finer G slope could well be the source of the
substantial finer G slopes commonly seen for Al2O3 (Figs. 3.15–3.17). Other pos-
sible combined effects are those due to effects of EA, TEA, or both. While these,
especially TEA, can be important in microcracking, they may also have effects
at grain sizes below those for microcracking, but at reduced failure stress levels,
as is discussed for the larger G branches below.
Consider next the intersections of the finer and larger G branches. While
there can be multiple finer G branches for a given material reflecting different
finer G flaw populations, all will join a single larger G branch for that material
when the flaw dimensions for each finer G branch ∼ equals G/2. Flaw variations
in the finer G branches will lead to corresponding variations of the G range of
each branch intersection. However, there are also intrinsic variations to the G of
such intersections due to statistical effects on forming flaws of about the same
dimensions as those of the grains as discussed earlier. Some variable contribu-
tions due to factors such as EA and TEA may also occur.
A key factor in both the intersection of the finer and larger G branches and
in larger G branch slopes is the extent of subcritical crack growth whether due to
environmental effects or intrinsic growth. As previously noted, Kirchner and
Ragosta [281] calculated that small (e.g. 10 µm) flaws within single Al2O3 grains
undergoing environmentally driven SCG could lead to catastrophic failure at sin-
gle crystal KIC for G ≥ 100 µm and loading rates high (e.g. 104 MPa/s) instead of
arresting at the grain boundary. However, this must be an upper limit, since they
assumed that the single- to polycrystal KIC transition occurs at the first grain
boundary rather than over multiple, e.g. 2–6, grains, indicated experimentally for
most ceramics investigated [28] (Figure 2.16) and that TEA stresses were not a
factor in such slow crack growth, which is contrary to some results [283, 284].
More fundamentally, there is direct experimental support for fracture occurring
from flaws whose initial size is smaller than the grain in which they are located
at or before their reaching the boundaries of this grain. This is shown by cases of
fracture occurring from a single larger grain, with calculations frequently show-
ing that the failure causing flaw size was smaller than the grain dimensions.
More specific demonstration of this is given by results reported for MgAl2O4,
and especially Y2O3, [2, 28] showing that failure frequently became catastrophic
before the flaw reached the first grain boundary. Further, some origins from
larger grains show single crystal mist-hackle features [2, 3, 12, 13, 21] within in-
dividual grains for failure from preexisting flaws (e.g. Figs. 3.7, 3.12) as well as
slip nucleated failure (Fig. 3.4 B–D). Since mist boundary to flaw size ratios for](https://image.slidesharecdn.com/mechanical-properties-of-ceramics-and-composites-120303143122-phpapp01/85/Mechanical-properties-of-ceramics-and-composites-209-320.jpg)
![Grain Dependence of Ceramic Tensile Strengths at ∼ 22°C 209
single crystals are at least 3 to 1, and probably closer to those for glasses and
polycrystals (∼ 10 to 1), these observations set severe limits on the extent of sub-
critical crack growth. Thus fracture had to be critical before the flaw boundary
reached the grain boundaries of the large grains in which failure initialed.
Consider in more detail the slopes of the larger G branches, where it
should again be noted that the slopes of these branches on σ–G-1/2 plots need to
be multiplied by (2)-1/2 ∼ 0.71 to obtain K since G is measured by a diameter and
flaws by a radius. The K values from these slopes should be between those for
easier grain boundary or single crystal fracture at one extreme and the polycrys-
talline values for a given material at the other extreme. Singh et al. [287] consid-
ered the issue of intragrain flaws first propagating at the single crystal KIC then
possibly arresting at the grain boundary without environmental effects. The first
of three regions identified was the very large G region in which growth of the
initial flaw cannot be arrested, and hence failure is determined by the initial flaw
size and the appropriate single crystal KIC, with no dependence on G. The transi-
tion from the larger G to the finer G branch occurs when c ∼ G/2 if there is a step
function change between single and polycrystalline KIC values, and when c = 3G
for a more gradual KIC transition. For the G range between these two extremes,
i.e. the larger G region, they concluded that σ would be controlled by the poly-
crystalline KIC and c>G/2 but with the specific c depending upon the type of KIC
transition. Evans [288] subsequently showed, based on a dimensional analysis,
that the large G region could exhibit an intrinsic G-1/2 dependence (independent
of the original c, but with a slope intermediate between the single and polycrys-
talline KIC values). The conditions cited for this were that the stress–crack length
relationship have a maximum, and polycrystalline KIC have no (or limited) G de-
pendance. Subsequently Virkar et al. [289] combined and refined these two
analyses, noting the need for better definition of the local KIC values e.g. their de-
pendence on c. The more complex case of crack propagation and arrest along
grain boundaries has not been considered, with or without environmental effects.
The portion of the basic model for which there is little data is the transition
from the larger G branch to single crystal strengths. Substantial data exists show-
ing extension of strengths of both cubic and noncubic materials to and well be-
low strengths of single crystals of the same material with the same machining
finish (Figs. 3.10–3.13, 3.16–3.18, 3.20, 3.21, 3.24). Thus there must be some
transition from these larger G strengths to those of the weaker single crystal ori-
entations as sketched in Fig. 3.1. Besides the clear implications of this transition
by strengths of larger G and single crystals, there is some limited data in this
area. Thus there are a few strengths for (mainly fusion cast, optical grade) CaF2
with G in the range of a few hundred to ∼ 1000 µm that are similar or somewhat
< those for comparably finished single crystal specimens [59]. Similarly Gentil-
man’s [92] strengths of specimens from fusion-cast, transparent 2 Al2O3·1MgO
with large (2–5 mm) grains tested with grain boundaries normal to the tensile](https://image.slidesharecdn.com/mechanical-properties-of-ceramics-and-composites-120303143122-phpapp01/85/Mechanical-properties-of-ceramics-and-composites-210-320.jpg)
![210 Chapter 3
surface are close to those of similarly finished single crystals. On the other hand,
while there is no single crystal data, polycrystalline strengths for bars with the
substantially oriented SbSI grains normal to the stress show strengths constant at
low values (∼ 15 MPa) for grains with lengths and diameters respectively of 300,
55 and 6000, 600 µm (Fig. 3.32). Finally, Mar and Scott [290], who fabricated
sapphire bicrystals of controlled orientation, showed that when the c-axis misori-
entation across the bicrystal (tilt) boundary was > 36°, the bicrystals had sponta-
neous fractures from the TEA, hence essentially zero strength, but pure twist
boundaries were mechanically sound.
The above sapphire bicrystal observations, as well as general considera-
tions, clearly show that there can be substantial variations in strengths along
multiple paths, transitioning from larger G to single crystal strengths dependent
on material, specimen/grain size, and test method (Fig. 3.1). Thus specimens of
Al2O3 with specimen-to-grain-size ratios that approximate tests of one or more
bicrystals in series will have strengths ranging from zero to whatever value of
strength the weakest boundary allows due to its TEA stresses. Tests of specimens
with only one grain boundary across the specimen cross section, i.e. a single
bicrystal, will vary from zero strength to higher values than for specimens with
more boundaries along the length of the specimen, but each boundary extending
across the specimen cross section. Similarly, larger specimens that have more
than one grain boundary across a specimen cross section, i.e. have some bound-
aries intercepting parallel stress paths, would have lower maximum strengths,
but less frequent zero strengths, since when some boundaries have zero strength,
others having some strength could carry part of the load giving strengths > 0.
Similar but generally significant effects due to EA are also likely to occur but of-
ten to be less severe than those of TEA.
Besides the above direct experimental evidence of TEA effects on sapphire
bicrystal strengths, there is additional evidence of effects of TEA stresses affect-
ing strengths not only when fracture of a single boundary is involved but also
when fracture involves many grains. Thus Rice et al. [101, 102, 234, 291, 292]
showed that as the flaw-to-grain-size decreased for noncubic materials due to in-
creasing contributions of TEA or transformation stresses to failure, their contri-
bution manifests itself as a reduction of the fracture toughness or energy
calculated from the applied stress at failure and the flaw dimensions, geometry,
and location. These stress contributions extrapolate to or above typical strengths
of ceramics studied (Fig. 3.35) consistent with strengths going to zero in many
sapphire bicrystals. However, effects of TEA stresses can impact strengths where
multigrain flaws are involved, as revealed by measurements of the sizes of frac-
ture mist, hackle, or macrocrack branching boundaries in materials with moder-
ate to high TEA and related stresses, e.g. Al2O3 and B4C to Pyroceram, graphite,
and PZT [102]. This shows that effects of such stresses are manifesting them-
selves in the fracture processes occurring in these materials at ≥10 times the flaw](https://image.slidesharecdn.com/mechanical-properties-of-ceramics-and-composites-120303143122-phpapp01/85/Mechanical-properties-of-ceramics-and-composites-211-320.jpg)
![Grain Dependence of Ceramic Tensile Strengths at ∼ 22°C 211
FIG. 3.35 Plot of TEA and related microstructural (internal) stress contribution to
failure as a function of flaw size extrapolated to the range of the size of the grains.
(From Rice et al. [291, 292], published with the permission of Plenum Press.)
sizes, e.g. starting at crack sizes of 1–4 mm. Again similar, but lesser, effects are
expected from EA, for which observations on other mechanical properties such
as spontaneous fracture and hardness have been indicated (Chap. 2, Sec. III.C
and Chap. 4, Sec. II.D).
B. Quantitative Evaluation of the σ – G-1/2 Model Parameters
Numerical evaluation of the basic fracture mechanics parameters underlying the
c – G relations of the model (Fig. 3.1) based upon the survey σ – G-1/2 data is
summarized in Table 3.1. Using the σ values for failure at the indicated large
G–fine G branch intersections and pertinent toughness (K) values, the c values
are calculated by
c = 0.63(K/σ)1/2 (3.3)
assuming a half penny flaw. About 60% of the resultant c values are within a
factor of 2–3 of the observed G value at the transition, in spite of uncertainties](https://image.slidesharecdn.com/mechanical-properties-of-ceramics-and-composites-120303143122-phpapp01/85/Mechanical-properties-of-ceramics-and-composites-212-320.jpg)
![212 Chapter 3
both of measurement of G values and of which G and K values to use (an aver-
age G was used in most cases). Further, several of the cases where c is >3G at
the intersection based on a half penny crack would be reduced for a more elon-
gated crack (a slit crack reduces the numerical factor in Eq. (3.3) from 0.63 to
0.25, making the majority of these remaining intersections fall within c≤3G).
This transition from larger to finer G branches at c > ∼G/2 is consistent with
Singh et al.’s model and data indicating the single-to-poly-crystal KIC transition
occurs over a few to several grains rather than 1 [287]. The calculated large G
slopes range from somewhat below single crystal to ∼ polycrystalline KIC values
(as do such slopes for other materials, e.g. Cr3C2) HfC, TaC, WC, and ZrC).
While three of these cases are due to investigators using Gm (Alford et al. [27]
and Virkar and Gordon [195]) three are related to studies using an average G.
One of the latter (MgAl2O3) shows the single crystal–polycrystalline KIC transi-
tion over ∼ 1 grain [28], hence consistent with the large G slope being ∼ KIC.
While the range of slopes in part reflects uncertainties in the G values to use, it
is consistent with crack growth modeling noted earlier, especially when the pos-
sibility of grain boundary KIC’s substantially (e.g. twofold) lower than single
crystal KIC’s is considered.
Numerical evaluations corroborate two basic expectations of the model,
namely that larger G branch slopes are < the polycrystalline toughness values,
and that intersections of finer and larger G branches occur when flaw and grain
dimensions are about the same and typically reasonably within the bounds of c∼
G/2 to 3G (Table 3.1). Further, there is no apparent difference in such compar-
isons whether the materials are cubic or noncubic, again arguing against TEA
stresses, which occur only in noncubic materials, determining σ – G behavior.
Thus TEA stresses (and EA stress concentrations) do not determine the basic
behavior of the model, but can impact behavior and model parameters, e.g. pos-
sibly modifying slopes, and especially impacting the transition from larger G to
single crystal behavior. Also there is some indication of the calculated flaw
sizes for failure of bodies with as-fired surfaces being somewhat larger than the
grain dimensions at the larger–finer G branch intersections (e.g. data of Charles,
Hing, and Alford et al. in Table 3.1). While this clearly needs more evaluation,
it is consistent with expectations, since grain boundary grooves are probably
not as severe flaws as cracks, which is consistent with their effective flaw size
typically being a fraction of G, e.g. the calculations in Table 3.1 assume a sharp
flaw which then predicts a flaw size larger than G. Finally, while the TZP and
PSZ data sets, especially the latter, are not as adequate as desired, numerical
evaluations of the limited data suggests that projected larger–finer G branch in-
tersections may give similar results to the other ceramics.
It is important to recall that in calculations concerning large grains as
flaws the small dimension of the grain on the fracture is the flaw size, not the
larger one [which enters via the flaw geometry factor, Y of Eq. (2.2)], again ar-](https://image.slidesharecdn.com/mechanical-properties-of-ceramics-and-composites-120303143122-phpapp01/85/Mechanical-properties-of-ceramics-and-composites-213-320.jpg)
![Grain Dependence of Ceramic Tensile Strengths at ∼ 22°C 213
guing against plotting data versus Gm. For example, Prochazka and Charles [96]
plotted σ (<140 to ∼350 MPa) vs. the length (L) of the large tabular (exagger-
ated) α-grains at fracture origins in the β-SiC matrix, obtaining a slope of 3.9
MPa·m1/2 with a G= ′ intercept at ∼ 70, not 0, MPa). However, use of a G value
based on the equivalent circular area (assuming the grain width ∼ 10% of their
length, per their micrographs) lowers the slope to ∼ 2.3 MPa·m1/2, which is more
consistent with other data.
VIII. CORRELATION OF TOUGHNESS, TENSILE STRENGTH,
AND YOUNG’S MODULUS
A key question to be addressed is the toughness–strength–reliability relations,
the latter as commonly measured by the Weibull modulus. This arises since
toughening mechanisms such as transformation toughening and crack branching,
bridging, and related phenomena, and possibly microcracking, have been cited
as means of increasing reliability, often with limited loss of, or increased,
strength. Unfortunately, many investigators have assumed this is correct, and
thus only measured toughness, neglecting strength or Weibull evaluations or
both. However, there are some studies that provide further information as well as
broader evaluations of self consistancy of toughness and strength that provide in-
sight. These in fact show first that toughness can increase while strength de-
creases. Second and more broadly significant, increased tougheness leads to
increased reliability in only limited cases where significant toughening occurs at
sufficiently fine grain size.
Consider first evaluation of the self-consistency of the microstructural de-
pendence of toughness with that of tensile strength, which provides by far the
largest data base and a clear picture of broad discrepancies. Comparison of the
porosity dependence of toughness and strength has clearly shown that high
toughness from phenomena such as crack bridging associated with large cracks
usually has no relation to strengths typically controlled by much smaller cracks
[5, 6]. Similar comparison of the grain dependence of toughness and strength
shows the same general discrepancy, as can readily be seen by comparing be-
havior in Chap. 2 and this chapter. Consider first noncubic materials, which pro-
vide more opportunity for toughening via crack branching and bridging due to
TEA stresses, which have been cited as a source of such toughening and resul-
tant σ–G behavior [131]. Thus many studies of noncubic materials show KIC,
and especially γ, independent of G at finer G, then rising and passing through a
maximum as G increases [293] (Figs. 2.15 and 2.16). This is basically inconsis-
tent with essentially all σ – G data (except possibly one set of Chandler and col-
leagues [169, 170], extruded BeO data having increasing orientation with
increasing G), since none show the corresponding increasing σ with increasing
G. The resolution of this dilemma is the recognition that much crack complex-](https://image.slidesharecdn.com/mechanical-properties-of-ceramics-and-composites-120303143122-phpapp01/85/Mechanical-properties-of-ceramics-and-composites-214-320.jpg)
![214 Chapter 3
ity (e.g. deflection, branching, bridging and related R-curve effects) that ac-
counts for such KIC and γ increases with G occurs on a substantially larger (e.g.
mm) scale than normal strength controlling flaws, which are commonly a few
tens of microns. Thus there is progressively less opportunity for the crack com-
plexity observed with large cracks to be operative as c → G. Further, since fail-
ure is a weak link process, it wll occur from the flaw having the lowest
surrounding KIC, i.e. the least opportunity for crack complexity. This is consis-
tent with R-curve effects, and other extremes of KIC (e.g. in PSZ) not controlling
the initial σ, but with σ retained after thermal shock [293], i.e. with larger scale
crack propagation.
Consider next cubic materials, where crack bridging has also been re-
ported (Chap. 2, Sec. III.E). Most fracture toughness (KIC) or energy (γ) data for
them shows little or no G dependence over the ranges studied (e.g. > 1 µm to ∼
200 µm) and hence is not necessarily inconsistent with σ–G behavior [293, 294].
However, recent cubic (β) SiC data shows a KIC maximum at G∼0.5 µm [258]
(Figure 2.14), which is consistent with earlier data for very fine (0.01–0.1 µm) G,
CVD SiC (though complicated by residual stresses) indicating a lower KIC than
for normal G SiC (i.e. with G ≥ 1 µm).
The first of two other evaluations of the relation of toughness and strength
is to compare both toughness (K) and strength (σ) to Young’s modulus (E). It is
readily argued that barring some enhancement of toughness beyond simple elas-
tic behavior, i.e. due to effects such as transformation toughening or crack
branching/bridging, toughness will scale with E per Eq. (2.2). Various authors
have shown that most ceramics exhibit such K–E correlation (Fig. 3.36A). Data
points scattered below the average trend (i.e. MgAl2O4, MgO, B, B4C, SiC, and
to a lesser extent TiO2) all reflect extensive transgranular fracture and known, or
expected, easy cleavage on one or more sets of planes that are multiple in occur-
rence, e.g. {100} or {110} representing respectively three and four sets of planes
[295]. This is in contrast to many, possibly all, of the materials above the average
trend having fewer or less easy cleavage planes or both. Thus beta alumina has
only basal cleavage, i.e. only one plane, and Al2O3 and TiB2 are not known to
have any cleavage and to have some, to substantial, intergranular fracture.
The counterpart of the above comparison is evaluation of strength trends
as a function of E. Since σ ∼ KIC(c)-1/2, and polycrystalline KIC values tend to be
proportional to E, comparison of strengths for similar c and G values for each
material should also correlate with E and give insight to σ – KIC relations. Since
the size and shape of machining flaws do not vary much for a given machining
direction, much data satisfies this condition, especially at the same finer G(∼ 4
µm in Fig. 3.36B) where effects of G on flaw geometry are not a factor and the
polycrystalline K is pertinent. Such σ–E correlation is clearly better than the
K–E (Fig. 3.36A). The three low, but not extreme, deviants from this trend,
CaZrO3, BeO, and TiB2, probably reflect less development relative to most of the](https://image.slidesharecdn.com/mechanical-properties-of-ceramics-and-composites-120303143122-phpapp01/85/Mechanical-properties-of-ceramics-and-composites-215-320.jpg)
![Grain Dependence of Ceramic Tensile Strengths at ∼ 22°C 215
FIG. 3.36 Plots showing the correlations of (A) fracture toughness (K) and (B)
tensile strength, both versus Young’s modulus (E) for various ceramics respec-
tively. (From Rice [293]), published with the permission of the Journal of Materials
Science.)
other materials. The extreme high deviant is tetragonal ZrO2 (TZP), which is
consistent with transformation toughening increasing K above levels expected
from those correlating with E. The next highest deviant from the σ – E trend is
Si3N4, which is consistent with the lower, but not the upper, portion of its K – E
trend. Similarly, note that the σ – E trends do not correlate with the higher K val-
ues for TiO2, BeO, Al2O3, and TiB2. Similar issues of basic differences between
σ and K results will be shown for particulate composites, and serious differences
have been shown as a function of porosity [6, 293].
Note that the mechanical properties of highly oriented CVD graphite in
the three directions relative to its orientation (Table 2.4), while falling above
trends of Figs. 3.36A and 3.36B, show similar trends. However, the orientation
with delamination normal to the crack deviates the most, again particularly for
K – E correlation, consistent with much of the higher large crack K not mani-
festing itself in strength.
Per the above theoretical and experimental correlation of strength and
Young’s modulus it is useful to consider σ – G-1/2 data normalized by Young’s
modulus. Doing this using E values in Table 3.2 brings most materials’ σ – G-1/2
behavior closer (Fig. 3.37). This results in no distinction between cubic and non-](https://image.slidesharecdn.com/mechanical-properties-of-ceramics-and-composites-120303143122-phpapp01/85/Mechanical-properties-of-ceramics-and-composites-216-320.jpg)

![Grain Dependence of Ceramic Tensile Strengths at ∼ 22°C 217
TABLE 3.2 Young’s Moduli (E in GPa) Used to Normalize Ceramic σ–G
Relations
Material E Material E Material E Material E
Al2O3 400 TiO2 285 BaTiO3 190 MgAl2O4 294
BeO 395 ThO2 250 β-Al2O3 200 Diamond 1050
CaO 200 UO2 230 CaZrO3 180 SiC (β) 400
MgO 355 ZrO2 230 Li4SiO4 138 ZrC 400
IX. TENSILE STRENGTH VERSUS TOUGHNESS AND RELIABILITY
An important extension of the above evaluations is directly to compare σ as a
function of K for a given material, and hence also usually as a function of G,
which sheds light on important exceptions, at least more extreme ones of TZP
and in situ toughened Si3N4. Such K–σ deviations were first shown by Swain and
Rose [296] for PSZ showing strength increasing with increasing toughness but
then reaching various process (hence microstructure) dependent maxima, be-
yond which strengths decrease despite further increase in K (though this gener-
ally also begins to decrease with increased G, but often at larger G values).
Various portions of such σ–K curves for various TZP materials are shown in Fig.
3.38, and for various dense Si3N4 bodies in Fig. 3.39. In TZP materials there is a
general correlation of strength and toughness till substantial toughnesses are
reached, with similar G dependence of strength (Fig. 3.21). The peaks in
strengths and subsequent decreasing strength with further increase in toughness
may correspond respectively to the intersection of the finer and larger G
branches and the larger G branch itself. However, a study to verify this and to
find whether there are differences from nontoughened bodies has not been done.
Si3N4 σ–G behavior appears consistent with toughening and strengthening in
finer G bodies but is not sufficiently detailed to confirm this. However, it clearly
shows strength increasing as toughness increases, reaching a probable maximum
and then decreasing. A key reason for strengths ceasing to increase with increas-
ing toughness is that a sufficiently stressed region of sufficient scale and weak-
ness will become the origin of failure in tensile stressing as a natural
consequence of its meeting the failure criteria. On the other hand, propagation of
a crack, especialy a larger one, arbitrarily introduced elsewhere in the body into
such a region, can readily result in crack branching, bridging, or other toughen-
ing mechanisms. In toughened zirconia bodies, the decrease in strength may be
precipitated by microcracking, usually of larger size and greater extent due to
larger grain, precipitate size, or both, or by increased grain boundary phase (in
PSZ). In Si3N4, strength maxima are usually the result of failure initiation from
larger isolated or clustered grains, especially in self-reinforced bodies](https://image.slidesharecdn.com/mechanical-properties-of-ceramics-and-composites-120303143122-phpapp01/85/Mechanical-properties-of-ceramics-and-composites-218-320.jpg)
![218 Chapter 3
FIG. 3.38 Flexure strength versus toughness of various TZP bodies [179–181,
183, 302]. Note (1) stabilization (mostly Y2O3) shown in m/o, and (2) that such
curves are similar to those shown for PSZ materials by Swain and Rose [296],
but these for TZP are often stretched out over a larger K range. The three data
points for TZP of Theunissen et al. [303] fall in the same range as the upper por-
tion of the data of Ruiz and Readey [304]. Note similarity to Fig. 3.39.
[297–300]. These observations are consistent with observations of Becher et al.
[301] that uncontrolled development of larger, elongated grains increases tough-
ness but often reduces strength, while control of the development of the larger,
elongated grain structure, e.g. by seeding, results in better toughness and
strength.
Quantitative correlation of such σ–K maxima with grain sizes in Si3N4 is
complicated by the fact that high toughnesses typically occur in bodies with mix-
tures of larger, substantially elongated grains (often with some excess oxide ad-
ditive phase) in a finer, and often less elongated, grain matrix. However, while
specific quantitative characterizations of such grain structures are at best difficult
and uncertain, they have been qualitatively characterized by investigators, as is
shown in Table 3.3, which shows strengths reaching maxima at intermediate G
values, often sooner than the maxima for K. This data further shows strengths
typically reaching a maximum versus toughness, as well as a similar maximum
of Weibull moduli (m). Limited data also indicates a similar but more limited
trend for Al2O3, quite possibly associated with the limited grain elongation [308].
However, again note that this occurrs at relatively modest G values. Similarly
some strength benefits of increased toughnesses in some finer G SiC and TiB2](https://image.slidesharecdn.com/mechanical-properties-of-ceramics-and-composites-120303143122-phpapp01/85/Mechanical-properties-of-ceramics-and-composites-219-320.jpg)
![Grain Dependence of Ceramic Tensile Strengths at ∼ 22°C 219
FIG. 3.39 Flexure strength versus toughness of various Si3N4 bodies [100, 239,
242, 293, 297, 298, 305–307]. Note that such curves are similar to those shown
for PSZ materials (Fig. 3.38)
bodies may be occurring, but much more research is needed. One component of
this should be evaluation of the fracture mode, since, as shown in Chapter 2,
Section III.E, transgranular fracture typically substantially reduces or eliminates
crack branching and bridging effects. Again these observations must be made
over a range of properties, grain sizes, and crack sizes to assess adequately such
effects as were discused above.
The complexity of sorting out the processing-microstructural issues are il-
lustrated by the work of Zhang et al. [309] on α-sialons with varying amounts of
3Dy2O3·5Al2O5 (Dy garnet, DG) addition using either hot pressing or HIPing.
Hot pressing resulted in strength decreasing modestly from 600 to 550 MPa as
the DG content increased from 0 to 5 w/o, while IF toughness showed a similar
decrease from 5.4 to 5.1 MPa·m1/2. Such decreases were accompanied by some](https://image.slidesharecdn.com/mechanical-properties-of-ceramics-and-composites-120303143122-phpapp01/85/Mechanical-properties-of-ceramics-and-composites-220-320.jpg)
![220 Chapter 3
TABLE 3.3 Fracture Toughness, Flexure Strength, and Weibull Moduli Trends with Grain
Structure for Si3N4 and Al2O3a
Fine G Medium G Larger G
Material Investigator K σ m K σ m K σ m
Si3N4 Matsuhiro and 6.5 0.96 8.3 0.81 9.7 0.9
Takahashi [297]
Si3N4b Himsolt et al. [298] 3.2 5.0 8.0
0.5 0.7 0.6
Si3N4 Tani et al. [241] 4.5 0.6 6.0 0.55 6.0 0.55
Si3N4 Kim et al. [300] 7.0c 0.88c 8.0d 0.68d
Si3N4 Hoffmann [299] 1.1 14–20 0.9 46 0.81 18
Si3N4 Li et al. [244] 20 33 22
Al2O3e Price et al. [308] 3.7 0.25 9
4.7 0.26 24 5.1 0.26 13
a
G = grain size, K = fracture toughness in MPa·m-1/2, σ = flexure strength in GPa, and m = Weibull
modulus.
b
K and σ data shown on separate lines to reflect that the two properties were measured on bars from
somewhat different processing, as opposed to all measurements being from bars from the same pro-
cessing, as is the case where all data for a given G range are on the same line.
c
Average grain diameter and length: 1 ± 0.3 and 5.3 µm.
d
Average grain diameter and length: 2 ± 1 and 12 µm.
e
The top line gives results for G = 4 µm and an aspect ratio of 1.5, while the lower line is for bodies re-
spectively with G =4 µm and 5 µm, both with aspect ratios of 2.6 due to slightly different compositions
of the grain boundary glass in these 96% alumina bodies.
modest coarsening of the fine equiaxed grain structure, which was also corrobo-
rated by some decrease in HV (100 N) from 18.6 to 17.6 GPa. On the other hand,
the HIPed bodies showed strength increasing from 420 to 550 MPa and tough-
ness similarly increasing from 5 to 5.3 MPa·m1/2 as the DG content increased
from 0 to 5 w/o. Increased addition, toughness, and strength in these samples
were accompanied by greater coarsening and elongation of the grains, which
was again reflected in lower hardnesses decreasing from 18.3 to 17.3 GPa as the
addition increased. Thus opposite strength and toughness trends occurred for hot
pressing versus HIPing as a function of additive content, showing important dif-
ferences for two densification processes that often give the same results. How-
ever, the changes were consistent with each other, since strengths from both
processes tracked with their toughness and reasonably well with the microstruc-
tural changes, i.e. higher strength from finer grain structure, with some counter-
ing of decreases from coarsening with development of an elongated but still
reasonably fine grain structure. The corroboration of strength and toughnesses
with microstructural changes by H trends is an example of the benefits of more
property measurements.](https://image.slidesharecdn.com/mechanical-properties-of-ceramics-and-composites-120303143122-phpapp01/85/Mechanical-properties-of-ceramics-and-composites-221-320.jpg)
![Grain Dependence of Ceramic Tensile Strengths at ∼ 22°C 221
Turning directly to the issue of reliability, Table 3.3 clearly shows that the
Weibull modulus can reach substantial levels in Si3N4 with development of inter-
mediate grain structures consisting of finer, often more equiaxed, grains of a few
microns diameter combined with similar, or somewhat larger, diameter, but more
elongated, grains. Such m maxima do not correlate with strength maxima, and
probably not with toughness maxima, but do appear to correlate with either pre-
ceding, or the onset of, larger grains or clusters of them acting as fracture ori-
gins. This raises the issue of whether the increase in m is due to crack branching
and bridging or to a more uniform population of grains to initiate failures, or
some combination of these two effects. Detailed study of fracture surfaces may
help resolve this issue, as was previously discussed [293], but detailed study in-
volving correlation with other factors is also needeed.
One of the few other materials for which there is similar, though very lim-
ited, data is Al2O3 (Table 3.3), which suggests similar effects but on a far more
modest scale, especially of strength. The limited strength levels raise some ques-
tion whether such effects are part of the normal σ – G behavior, since, as was
noted earlier, K – G behavior is contrary to the σ – G behavior. No measure-
ments of m as a function of grain size over any significant G range are known,
but m can be calculated from the average strength (A) and the standard deviation
(S) per Ref. 310 as
m = 1.21(A/S) – 0.47 (3.4)
However, σ – G data commonly entails limited (e.g. 5–10 or fewer) measure-
ments per grain size, severely limiting the accuracy of such calculations. Further,
even with more data points, limited shifts in grain structure can shift Weibull
moduli. Thus Ting et al. [133], who directly measured m for their sintered alu-
mina bodies, showed m increasing from 7 to 8 with narrower G distributions
from ∼0.5 to ∼4.5 µm to m ∼ 11 – 13 with G distributions of ∼1 to ∼8 µm. While
this is consistent with data of Price et al., variations in these results again show
the importance of having a reasonable data base for calculations of m as a func-
tion of G whether calculated directly or via Eq. (3.4).
The alumina data set of Tomaszewski [134] (Fig. 3.14) meets the above cri-
teria, consisting of 15–25 measurements per data point for at least eight different
G values, with ∼ four on the finer G branch and four on the larger G branch. These
give an average m of 9 ± 4 for the larger G branch and 26 ± 14 for the finer G
branch, indicating higher m values at finer, not at larger, G where greater toughen-
ing due to branching and bridging should occur. Thus while limited possible ef-
fects of increased toughness increasing reliability have been indicated by Price et
al. [308] and possibly by Ting et al. [133], this clearly is not a large effect and is
not associated with important σ – G changes, especially the change from finer G
branch to larger G branch behavior, e.g. as suggested by Chantikul et al. [131].
Another material in which some data exists on toughness and strength](https://image.slidesharecdn.com/mechanical-properties-of-ceramics-and-composites-120303143122-phpapp01/85/Mechanical-properties-of-ceramics-and-composites-222-320.jpg)
![222 Chapter 3
changes with microstructure changes, especially with elongated grains, is SiC.
Thus data of Cho and colleagues for in situ toughened silicon carbide [311, 312]
shows strengths decreasing with any increase in toughness above the normal
level (∼ 3 MPa·m1/2) (Fig. 3.40) in bodies sintered with 12 and 8 wt% respec-
tively of Al2O3 and Y2O3 with or without 1% of α-SiC seeds. They showed that
5, 10, and 20% amounts of the combined additives, which resulted in the grain
diameter respectively decreasing from 1 to 0.6 µm and aspect ratio increasing
from ∼ 6 to ∼ 11, gave little change of strengths (∼ 600 MPa) or toughness
5.6–5.8 MPa·m1/2), i.e. consistent with the middle portion of the trend in Fig.
3.40. While apparently no direct measurements of Weibull moduli have been
made in such studies of SiC, estimates of m from Eq. (3.4) indicate that if there
are any changes in m as toughness increases, it is for m to decrease not increase
with increased K.
The above review shows that increased toughness can lead to increased
strength and reliability, i.e. increased Weibull modulus in some cases. These are
mainly ZrO2 toughened bodies and in situ toughened Si3N4 bodies, but even in
these bodies improved strengths and reliability become self-limiting with contin-
ued increased toughness, i.e. there is an optimum balance between these proper-
FIG. 3.40 Strengths versus toughness from tests at 22°C of in situ toughened
SiC sintered with respectively 12 and 8 w/o of Al2O3 and Y2O3 with or without 1%
of α- SiC seeds by Cho et al. [311, 312]. (Published with the permission of the
Journal of Materials Science.)](https://image.slidesharecdn.com/mechanical-properties-of-ceramics-and-composites-120303143122-phpapp01/85/Mechanical-properties-of-ceramics-and-composites-223-320.jpg)
![Grain Dependence of Ceramic Tensile Strengths at ∼ 22°C 223
ties that depends on the microstructure and the crack-microstructure scale. Such
benefits are likely to be dependent on both the size and shape of the component
and the nature of the stress-crack situations to be addressed. Further, such effects
show limited or no translation of these benefits to the few other materials investi-
gated, i.e. Al2O3 and SiC, indicating effects that probably depend on combina-
tions of grain boundary phase-grain interactions and of the properties of the
grains, e.g. of their fracture characteristics.
Finally, note two important opportunities to understand better the relation
of crack propagation, especially toughness, tests to normal strength behavior.
The first is the study of composites, addressed in Chapters 8–12, which again
shows some of the same basic differences between toughness and strength, again
questioning the applicability of much large crack data to normal strength. The
second is various aspects of fractography, which is often more successful with
monolithic versus composite ceramics and is probably basic to determining the
apparently limited contributions of bridging and related R-curve effects to nor-
mal strength behavior. One basic aspect is corroboration of microstructural as-
pects of crack propagation in the fracture origin area, such as fracture mode, e.g.
intergranular fracture favorable to bridging, and detailed comparison of match-
ing fracture surfaces, e.g. for evidence of crack bridging. Another potentially im-
portant aspect is comparison of fracture mirror and related dimensions as a
function of flaw, microstructure, and property changes. As noted earlier, such di-
mensions show clear reductions as flaw sizes decrease in bodies with substantial
TEA stresses reflecting their contributions to failure [102]. Since such dimen-
sions also reflect the toughness controlling fracture, they should thus corre-
spondingly show increases with bridging and related R-curve effects, i.e. if these
increase the toughness controlling failure this should be reflected in the mirror
and related dimensions. Though such specific studies have not been conducted,
qualitative evaluation of existing data does not show obvious evidence of such
increases, i.e. no increase in mirror size other than the normal decrease with de-
creasing flaw size. Further, specific comparison of strength–mirror size data for
hot pressed Al2O3 (G∼ 1–2 µm) and commercial sintered aluminas (G∼ 4–10 µm)
shows them being essentially idntical [313], contrary to expected increasing
bridging effects as G increases.
X. SUMMARY, DISCUSSION, CONCLUSIONS,
AND RECOMMENDATIONS
Alkali halides, which even in polycrystalline form often show some macroscopic
yield, have a single σ–G-1/2 branch with a moderately positive σ–G-1/2 slope (de-
pending on material composition and temperature) extrapolating to single crystal
yield stresses at G= ∞. Similarly, some somewhat harder, more refractory mate-
rials with known or expected microplasticity in single crystals such as CaO,](https://image.slidesharecdn.com/mechanical-properties-of-ceramics-and-composites-120303143122-phpapp01/85/Mechanical-properties-of-ceramics-and-composites-224-320.jpg)
![224 Chapter 3
MgO, and BaTiO3 typically show a single branch, at least for large to moderate
G, with σ > 0 extrapolation at G=∞ to ∼ the single crystal failure stress, again in-
dicating microplastically controlled strengths. Limited yield-extrapolated σ dif-
ferences are attributed to purity differences between single crystals and
polycrystalline grains. Other manifestations of microplastic behavior are σ in-
creases with alloying (e.g. as for CaO, MgO, and BaTiO3) and preferred orienta-
tion (e.g. of MgO, despite preferred orientation of {100} for easier fracture), as
well as possible limited increases in strengths and internal failures as a result of
surface work hardening from machining. Strengths, slopes, and intercepts de-
crease with increasing test temperature, moderately at first (reflecting decreases
in both yield stresses and elastic moduli) and then more rapidly (e.g. above
1000°C or more commonly due to increasing grain boundary sliding) (Chap. 6).
Materials of intermediate hardness such as MgO and BaTiO3 clearly show
a change to greatly reduced, possibly zero G dependence of σ at finer G, with
this transition being a function of surface finish. More severe machining, e.g. use
of coarser grits or machining transverse, as opposed to parallel, to the tensile axis
results in lower strengths and a transition to substantially reduced G dependence
of σ at finer G. While there is not yet any direct fractographic evidence, such
finer G failure is attributed to generating flaws sufficiently large to cause failure
at lower stresses than for microplastic induced failure. Microplastic controlled
failure is typically associated with failure initiating from a single grain, implying
a transition to flaw failure when c ∼ G. Such a transition to flaw controlled fail-
ure at finer G from microplastic control of σ at larger G is exactly the opposite of
that proposed by Carniglia [8, 9]. There is also some evidence that very coarse
machining, e.g. sawing, of MgO leads to strengths below the normal large G
σ–G-1/2 trends, possibly due to failure from larger flaws or failure via the slip-as-
sisted crack growth. Fairly extreme finishing is needed to observe such machin-
ing effects, since unless fairly deep cracks are introduced in the surface, their
role in failure is probably limited by surface work hardening. Note that even
with slip-induced failure, mist and hackle are generated within larger grains, e.g.
of CaO (Figs. 3.4B–D) again showing cracks having reached catastrophic propa-
gation before reaching a grain boundary, as in failure from preexisting flaws.
The great bulk of refractory ceramic materials, which are of moderate, and
most commonly substantial, hardness, and which fail from preexisting flaws,
show a two-branch σ–G-1/2 behavior over the normal G range (e.g. ∼ 1–100 µm).
The larger G branch shows a substantial positive slope, which is typically be-
tween single crystal (or grain boundary) and polycrystalline KIC values, reflect-
ing varying extents of subcritical growth of flaws initially < G. Such c < G
subcritical crack growth may be due to environmental effects or simply to propa-
gation starting at single crystal (or grain boundary) KIC values, but being arrested
by surrounding grains, with resultant failure occurring at higher, e.g. polycrys-
talline, KIC. However, even if c does not = G/2 at failure, there can still be mea-](https://image.slidesharecdn.com/mechanical-properties-of-ceramics-and-composites-120303143122-phpapp01/85/Mechanical-properties-of-ceramics-and-composites-225-320.jpg)

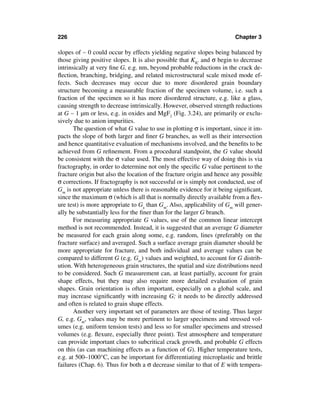
![Grain Dependence of Ceramic Tensile Strengths at ∼ 22°C 227
ture would be expected, e.g. is indicated for microplastic materials, e.g. CaO and
MgO, but for brittle failure there can be a temperature dependence to EA, and
there clearly is for TEA. This can lead to, at least initially, either less decrease of
σ or a limited σ increase with temperature, especially in the G regime where
these effects are most important, as is indicated for several orders.
A variety of other parameters need to be considered in accessing σ–G be-
havior. These include residual porosity (whose effects may not be fully indepen-
dent of G), machining, whose effects can clearly change with G, and other body
constituents. Constituents in solid solution generally have limited effect on fail-
ure from preexisting flaws or microcracks (e.g. via EA or TEA) but can have
substantial effect on failure due to microplasticity. Constituents as second phases
(temporarily or permanently) affect σ mainly via G (often significantly reducing
it) but may have various other positive or negative effects on σ.
In a broader perspective, analysis of σ – G-1/2 behavior and application of
fractography have proved valuable for defining failure mechanisms, especially
when combined with other studies such as of machining and different materials.
Thus the first of two broad basic results are the fundamental differences in primar-
ily the grain size and secondarily the shape and orientation dependence of much
large crack toughness and normal strengths, which are often opposite, i.e. increas-
ing toughness with decreasing strength. This results from two factors, namely from
larger versus small crack effects as discussed in Chap. 2 and from changing c/G ra-
tios (Figure 2.16) and some dependence of flaw sizes, especially from machining,
on G via local values of elastic moduli, hardness, and toughness. This importance
of local properties impacting the introduction of flaws and resultant body strengths
is contrary to the typical focus on explaining ceramic strength behavior based on
large crack toughness values with limited, or often no, attention to flaws causing
failure and their microstructural dependence. This reduced relevance of large crack
toughness values to normal strength behavior is controlling propagation of small
cracks versus the importance of material and microstructure on properties control-
ling machining flaw generation is the second broad result [294]. However, such
tests are relevant to strengths controlled by larger cracks, e.g. from serious thermal
shock (Chap. 6) or impact damage. These basic results are corroborated and rein-
forced by similar evaluation of ceramic composites (Chaps. 8, 9, and 12).
REFERENCES
1. F. P. Kundsen. Dependence of Mechanical Strength of Brittle Polycrystalline
Specimens on Porosity and Grain Size. J. Am. Cer. Soc. 42(8):376–388, 1959.
2. R. W. Rice. Review, Ceramic Tensile Strength: Grain Size Relations: Grain Sizes,
Slopes, and Branch Intersections. J. Mat. Sci. 32:1673–1692, 1997.
3. R. W. Rice. Microstructure Dependence of Mechanical Behavior of Ceramics.
Treatise Mat. Sci. Tech., Properties and Microstructure 11 (R. C. McCrone ed).
Academic Press, New York, 1997, pp. 199–381.](https://image.slidesharecdn.com/mechanical-properties-of-ceramics-and-composites-120303143122-phpapp01/85/Mechanical-properties-of-ceramics-and-composites-228-320.jpg)

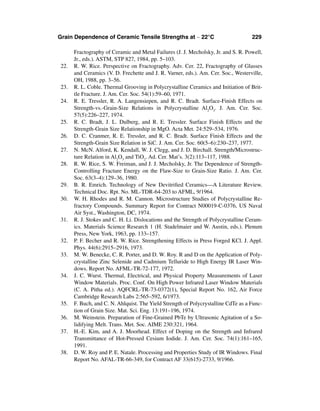


![246 Chapter 4
hardness anisotropy of single crystals as a function of crystal structure orienta-
tion relative to the indenter geometry as a function of the degrees of activation of
differing slip systems [1–5] (Sec. II.E). (Note, in glasses, not addressed here,
other deformation mechanisms, e.g. densification may occur—see Chap. 10.)
The grain size, shape, and orientation dependence of hardness thus results from
the same grain structure constraints on yield stress as given in Eq. (3.1), with two
modifications. First, σf, which is usually slightly > the yield stress for the easiest
activated slip system in testing the strengths of single crystals, and was used as a
convenient approximation for the actual yield stress, is replaced by the yield
stress, σy. Second, σy is the general yield stress for the required deformation and
is not necessarily that for only the easiest activated slip system [6]. Thus a
Hall–Petch type dependence on grain size, G (with some impacts of grain shape
and orientation) is a major, or the total, factor in the G dependence of H. Al-
though much hardness data is given with no grain (or other material or test) char-
acterization, there is substantial data providing support for such an H–G-1/2
dependence, especially at mainly finer G [7], as will be extensively shown.
However, some data did not necessarily show H decreasing with increas-
ing G, mainly at intermediate G, and some results showed the opposite G de-
pendence, i.e. H increasing with increasing G at larger G [7–10]. Thus
Armstrong et al. [8] reported a reverse BeO HV–G dependence, i.e., decreasing
from single crystal values (on {0001} and {10 10} planes) with decreasing G
(Fig. 4.3). Similarly, Sargent and Page [9], though not giving specific H values,
reported MgO single crystal HV higher (on {100} planes) than for dense, hot
pressed polycrystalline MgO (G = 130 or 10 µm). While not encompassing sin-
gle crystal tests, Tani et al.’s [10] HV (2 N, ∼ 200 gm load) data for A12O3 shows
a marked decrease in H with decreasing G (from ∼ 60 to ∼ 6 µm, see Fig. 4.2) in
contrast to the opposite trend for their Y2O3 data, thus showing that the different
H–G trends are not due entirely to differing techniques of different investiga-
tors. Though these variations were limited, e.g. due to the frequently limited G
range covered, especially at larger G, such variations are an underlying factor in
H–G-1/2 data not necessarily extrapolating to single crystal values. Thus some,
e.g. Niihara and Hirai [11], considered a G-1 dependence of H, since this re-
sulted in their fine G polycrystalline values more closely extrapolating to single
crystal data (Fig. 4.13).
A recent review [7] showed that the above variations are manifestations of
a very common, but variable, indent associated deviation below a simple Petch
relation at intermediate G whose recognition was typically seriously restricted
by insufficient H–G data. Thus much more extensive H–G data presented previ-
ously [7] and here clearly shows frequent deviation through an indent-G depen-
dent H minimum at intermediate G, which is attributed to observed indent
associated cracking. While the cracking from indent vertices used for toughness
and strength evaluations (mainly in finer G bodies) may be a factor in this, the](https://image.slidesharecdn.com/mechanical-properties-of-ceramics-and-composites-120303143122-phpapp01/85/Mechanical-properties-of-ceramics-and-composites-247-320.jpg)
![Grain Dependence of Indentation Hardness at ∼ 22°C 247
observed indent associated cracking of interest here is more confined around the
indent, consisting mostly of a number of spall-lateral cracks (Sec. II.D). Such
cracking increases as the indent and grain dimensions approach one another and
decreases as the indent size gets larger or smaller than the grain size. The result
is a material-, body-, and test-dependent lowering of hardness values below
those expected from the Hall–Petch relation as cracking increases, which thus
typically occurs at varying intermediate G values that shift with indent size and
hence material, grain structure, and indent types and loads. Thus hardness first
commonly decreases from single crystal values as G decreases, reaches a mini-
mum, and then progressively increases with further decreasing G at finer G, ∼ as
the Hall–Petch relation at finer G. While there is no quantitative theory for these
deviations, the substantial experimental data showing the trends for indent type,
load, and material dependence is reviewed. Note that as the indent size ap-
proaches the grain size, increased scatter of hardness values is expected, since
there is increased dependence of each value measured on the parameters of indi-
vidual or adjoining grains indented.
The subsequent review of the grain dependence of hardness provides a
more comprehensive data base and perspective than a more limited, earlier sur-
vey of the G dependence of H and related properties [12] by extensively draw-
ing upon and extending a more recent and more extensive evaluation [7]. HK
and HV data are reviewed first for single oxides, then for mixed oxides, then for
borides, carbides, and nitrides, in alphabetical order, giving Knoop results first
if sufficient data is available. Then limited data for spherical indenters and other
materials is briefly addressed. Key trends to observe are that the more limited
data for most softer, less refractory materials indicates a simple Hall–Petch rela-
tion, but almost all harder, more refractory materials (and a few softer, less re-
fractory materials) have a superimposed indent–grain size dependent H
minimum, mostly at intermediate G values. The limited data for bodies with
nanoscale grains is shown to be generally consistent with data for bodies of the
same composition but more normal G (i.e. ≥ 1 µm), but some nanograin bodies
are shown to have H decreasing as G decreases, i.e. opposite from the normal
behavior at finer G.
This review of H–G-1/2 data is followed first by a review of indent char-
acter trends showing that the minimum in H values is associated with increas-
ing local cracking, which is typically a maximum when the indent dimensions
are ∼ those of the grains under and around the indentation. Then observations
of extrinsic effects, mainly grain boundary phases or impurities and indent
type and load on such cracking, are discussed and summarized followed by
discussion of possible contributions of factors such as TEA and EA. [Note
that data also shows the commonly observed load dependence of both HV and
HK, and HV < HK at 100 gm, but the reverse tends to occur at 500 gm (Table
4.1).] This is followed by discussion of the limited data on effects of grain](https://image.slidesharecdn.com/mechanical-properties-of-ceramics-and-composites-120303143122-phpapp01/85/Mechanical-properties-of-ceramics-and-composites-248-320.jpg)
![248 Chapter 4
TABLE 4.1 Approximate Average Hardnesses
(GPa)a
100 gm 500 gm
Material HK HV HK HV
Al2O3 26 23 18 19
MgO 10.5 9.5 8 7
ZrO2 15+ 14 12- 13
MgAl2O4 18 17 13.5 15
SiC 37 34.5 23 27.5
a
Source: After Rice et al. [7], published with the per-
mission of the Journal of the American Ceramic Soci-
ety.
shape and orientation, and especially implications on the latter from substan-
tial single crystal data. Note that additional data on the room temperature
hardness of both single and polycrystals is found in Chapter 7, Section II, on
the temperature dependence of H.
Before proceeding to the data review, it is important to recall some of the
factors that can impact hardness and thus potentially complicate accurate evalua-
tion of its grain size dependence, considering first exclusively body aspects. Be-
sides basic body chemistry, the presence of impurities or additives, as well as
stoichiometry and varying crystal structure, and especially porosity, are com-
monly also important. While stoichiometry may often manifest much of its ef-
fects via its frequent impacts on grain parameters, especially size (as shown
later), typically resultant lattice defects can directly impact dislocation motion to
varying extents, hence directly impacting hardness in view of its basic depen-
dence on local plastic deformation. Additionally, both stoichiometry and impuri-
ties or additives can change grain boundary strengths as well as stresses, e.g.
those from TEA and EA, and thus the extent and impact of local cracking. Exam-
ples of enhanced local cracking due to grain boundary phases from (fluoride) ad-
ditives are illustrated later, and possible impurity effects in some nanograin
bodies are discussed. Changes in or mixes of different crystal structures of the
same composition may have limited to substantial effects, e.g. by up to ∼ 25% in
Si3N4 [13,14] (see Fig. 4.13). Porosity can have varying and substantial effects
on hardness, as is extensively addressed elsewhere [7,15,16] with much of its ef-
fect being due to the amount and character of porosity, e.g. via the exponential,
ebP, dependence of the ratio of H at some volume fraction porosity P to that at P
= 0 over a reasonable fraction of the porosity range, e.g. to P = 0.2–0.5. The pa-
rameter b is commonly in the range of 3–7 for hardness, depending on the type
of porosity.](https://image.slidesharecdn.com/mechanical-properties-of-ceramics-and-composites-120303143122-phpapp01/85/Mechanical-properties-of-ceramics-and-composites-249-320.jpg)
![Grain Dependence of Indentation Hardness at ∼ 22°C 249
Factors dependent both on the body character and on test factors are grain
and hardness measurements. As noted in Chapter 1, Section IV.B, measurement
of grain size is complicated by several factors, including typically neglected
and more difficult to quantify aspects of grain shape and orientation, but also by
both actual measurement, including, even for random equiaxed grain structures,
what the grain size should be, e.g. a two-dimensional one (i.e. the size of the
grains at their intersection with a surface) or their “true” three-dimensional size.
While the latter is probably more pertinent to H, there is no clear guidance, but
these issues are commonly overridden by the very loose measurement of most
G values, including specifics of the measurements and any factors to convert
the common linear intercept values to some “true” G commonly not being
given. These commonly result in uncertainties in G values of ± 50%, and some-
times substantially more. Actual hardness measurements for a given body also
depend on indent load [7,17–19] and on surface character, with the two being
partly interrelated [19]. Thus H values typically increase below indent loads of
∼ 1 to a few kilograms (i.e. ∼ 10 or more N), with the increases being at first
modest, but accelerating as the load decreases. Surface character is important
for its impact on clarity of the indent dimensions, e.g. due to the degree of sur-
face smoothness. However, mechanical surface finishing, which is almost ex-
clusively used, also introduces surface cracks that may impact indent formation,
and more fundamentally introduces extensive deformation in the surface
[19,20]. The latter commonly is sufficient to work harden the surface, to depths
dependent on the material, the grain structure and the nature of the final ma-
chining (commonly polishing), and commonly some on previous machining.
Such surface work hardening is commonly a factor, often an important one, in
the load dependence of H since higher loads cause more indent penetration into
less work hardened material.
II. DATA REVIEW
A. Oxides
Brookes and Burnand’s [3] HK (500 gm load) data for the (100) plane of sap-
1
phire averaging 16 ± 2 GPa is somewhat lower than Rice et al.’s data [7] (Fig. 4.1)
and considerably lower, as expected, than Becher’s [19] HK (100 gm) values of
22–30 GPa for the (0001) basal plane [and 22–35 GPa on the (1120) plane] from
the five-fold higher load. Becher’s data, where most of the variations are due to
different surface finishes, is in good agreement with the current data. The substan-
tial single- and polycrystal data of Rice et al. [7] suggests a limited minimum in
HK (100 gm) at intermediate G (∼ 50 µm) i.e., HK first decreases some, then in-
creases with decreasing G. Their data shows a clearer and larger HK minimum at
G ∼ 50µm for the 500 gm load. Al2O3 HK–G-1/2 (400 gm) data of Skrovanek and](https://image.slidesharecdn.com/mechanical-properties-of-ceramics-and-composites-120303143122-phpapp01/85/Mechanical-properties-of-ceramics-and-composites-250-320.jpg)
![250 Chapter 4
FIGURE 4.1 HK vs. G -1/2 for single crystal (sapphire) and polycrystalline (mainly
hot pressed) Al2O3 of Rice et al. [7] (100 and 500 gm loads, giving typical indent
diagonals respectively of ∼ 8 and ∼ 23 µm) and Skrovanek and Bradt [21] (400 gm
load, sub- or superscripts the number of tests) at ∼ 22°C. Vertical bars = standard
deviation. Note (1) a probable HK minimum in the 100 gm data, at G ∼ 50 µm, and
a definite minimum in the 500 gm load data at G ∼ 50–100 µm (depending upon
the exact trend of the finer G data, e.g., per two alternatives shown by dashed
lines), (2) good agreement between data sets for 400 and 500 gm loads which,
when combined, favors a greater G dependence in the smaller G regime. (From
Ref. 7, published with the permission of the Journal of the American Ceramic So-
ciety.)
Bradt [21] agrees well with that of Rice et al. (500 gm load) but shows a greater H
decrease with increasing G for G > ∼ 5–8 µm (Fig. 4.1).
Kollenberg’s [22] HV (200 and 400 gm) values, averaging ∼ 19 GPa for
three different sapphire planes, are in reasonable agreement with the sapphire Hv
of Rice et al. [7], which in turn is in reasonable agreement with Becher’s data
[19] considering possible surface finish and orientation differences. Rice et al.’s
substantial data versus G does not show a clear minimum for 100 gm load but
could be consistent with one at G ∼ 20 µm. Their data at 500 gm load indicates a
minimum at G ∼ 60 µm. Limited HV data of Lankford [23] for dense sintered
Al2O3 (Lucalox, loads: 200–800 gm) agrees fairly well with Rice et al.’s data for](https://image.slidesharecdn.com/mechanical-properties-of-ceramics-and-composites-120303143122-phpapp01/85/Mechanical-properties-of-ceramics-and-composites-251-320.jpg)
![Grain Dependence of Indentation Hardness at ∼ 22°C 251
the lower (200 gm) load, i.e. falling mainly between the 100 and 500 gm data,
but is high for the higher loads. Tani et al.’s [10] HV (2 N, ∼ 200 gm) data, show-
ing a substantial H decrease from their largest G (∼ 60 µm) to their smallest G (∼
6 µm) and hence a probable H minimum, varies from being consistent in H val-
ues with those of Rice et al. to some substantial difference, but not total disagree-
ment. In view of other data for alumina and other materials, their data implies a
probable HV minimum, but with a shift to finer G relative to other data, which
may well be due to other factors such as G measurement, e.g., if they used as-
measured linear intercept values, these would be less (e.g. ∼ 50%) than the aver-
age (surface) diameters used in the present study.
Alpert, et al.’s [24] HV (10 N, ∼ 1 kg) data for sapphire and dense sintered
larger grain Al2O3 (Vistal) and finer grain but slightly less dense 99.9% Al2O3
agrees with that of Rice et al. [7], but their values for 96% and 90% alumina are
progressively lower (Fig. 4.2). Their three data points for dense Al2O3, by them-
selves, would indicate no G dependence of HV, but they are consistent with the
HV minimum of Rice et al. Similarly, Clinton and Morrell’s [25] earlier as-mea-
sured HV (1 kg) sapphire values are also generally consistent with trends of the
other data, but their values for various commercial sintered (95–99%) aluminas
(with P to ∼ 0.05) are lower. However, approximate correction to dense, pure
alumina values by extrapolation as a function of alumina content and the expo-
nential porosity dependence with a b value of 6 [7,15,16] brings such data into
much more reasonable absolute agreement with data for dense pure aluminas,
e.g. at 500 gm. More recent data of Krell` and Blank extending from ∼ 4 µm
down to ∼ 0.4 µm [26] generally agrees in trend and absolute values with the
other data (recognizing the higher, ≥ 10 N, loads), clearly showing a substantial
increase in H as G decreases.
Turning to other single oxides, Rice et al.’s [7] HV data for the (0001) sur-
face of BeO crystals was essentially identical to that of Armstrong, et al.’s [8],
but the latter’s data on (1 10) is somewhat higher than the former data (Fig. 4.3).
0
Tests on {1 20} and {1 10} were essentially the same as for the {0001} plane
1 0
[7]. While the HV values for both studies are also similar for polycrystalline val-
ues over the G range (∼ 15–100 µm) in common and both studies show HV de-
creasing over the larger G, range, Rice et al. showed HV increasing with
decreasing G at finer G in contrast to Armstrong et al.’s continuous H decrease.
Whether this difference (at the finest two G’s) is due to differences in G or H
measurements or the specific specimens cannot be determined, but H differences
due to differences in porosity could be a factor.
Armstrong and Raghuram’s [2] HK (100 gm) of ∼ 8 ± 3 GPa for {100} sur-
faces of MgO crystals averages below, but clearly overlaps with, the projection
of the data of Rice et al. [7] at G = ∞ (Fig. 4.4A). Rice et al.’s polycrystalline
data [7] clearly indicates similar, limited HK minimums for 100 and 500 gm
loads at G ∼ 15 and 30 µm respectively and an indicated limited HV minimum at](https://image.slidesharecdn.com/mechanical-properties-of-ceramics-and-composites-120303143122-phpapp01/85/Mechanical-properties-of-ceramics-and-composites-252-320.jpg)
![252 Chapter 4
Figure 4.2 HV vs. G -1/2 for single crystal (sapphire) and polycrystalline (mainly
hot pressed) A12O3 of Rice et al. [7] (100 and 500 gm loads, vertical bars = stan-
dard deviation), giving typical indent diagonals respectively of ∼ 9 and ∼ 22 µm)
and other data [24–26] at ∼ 22°C. Note (1) no apparent HV minimum at 100 gm
load, (2) a probable HV minimum at G = 50–100 µm at 500 gm load, (3) reason-
able agreement of data for experimental and commercial bodies [24,25] with gen-
eral trends, and often absolute values (especially with correction for other
constituents and porosity), and (4) Krel` and Blank [26] higher load (≥ 10 N) data
l
extending from ∼ 4 µm down to ∼ 0.4 µm generally agreeing with other data and
showing a substantial increase in H as G decreases. (From Ref. 7, published with
the permission of the Journal of the American Ceramic Society.)
G ∼ 30 µm for the 100 gm load and show a definite and more substantial mini-
mum at G ∼ 20 µm at the 500 gm load (Fig. 4.4B).
TiO2 data is restricted mainly to single crystals and submicron grain sizes
(Fig. 4.5). Becher’s single crystal (rutile) data on {100} surfaces is one of the
most comprehensive, reflecting HV indent loads of 300, 200, and 100 gm (∼ 3–1
N) and chemically polished, sanded, or diamond ground surfaces [19]. Hardness
values increased (with coefficients of variation of < 5%) from averages of 8.7 to
12.9 GPa in the order of loads and surface finishes listed with the greatest in-
creases occurring on going from 200 to 100 gm loads and from chemically pol-
ished, to sanded, to ground surfaces. His data is consistent with the other
comprehensive study of Li and Bradt [27] as a function of load (50, 100, 200,](https://image.slidesharecdn.com/mechanical-properties-of-ceramics-and-composites-120303143122-phpapp01/85/Mechanical-properties-of-ceramics-and-composites-253-320.jpg)
![Grain Dependence of Indentation Hardness at ∼ 22°C 253
Figure 4.3 HV vs. G -1/2 for single and polycrystal (sintered, P ∼ 0.05) BeO at 0.2,
0.5, 1, and 2 kg loads of Armstrong et al. [8] and (1 and 2 kg) loads of Rice et al.
[7] at ∼ 22°C. Respectively vertical and horizontal bars are standard deviation,
and the lower ends of vertical bars represent the average value for the lower
load, and the upper end the higher load value (coefficient of variations varied for
< 1% to ∼ 9%, averaging 3% for 4–6 measurements over all loads). Note the gen-
eral agreement of both single and polycrystalline values between the two studies,
except at finer G. (From Ref. 7, published with the permission of the Journal of
the American Ceramic Society.)
and 300 gm) and orientation on {100}, {110}, and {111} surfaces of rutile crys-
tals with mechanically polished surfaces giving Knoop hardnesses of 10.5 to 16
GPa, mostly ≤ 14 GPa. The estimated HV value of Mayo et al. [28] of ∼ 11 GPa
from nanoindent tests on {100} mechanically polished rutile surface is also con-
sistent with the above data. Data of Averback et al. [29] (see also Andrievski
[30]) for HV (load unspecified) of two TiO2 (mainly rutile) bodies with P = 0.06
and 0.11 with G ∼ 0.15 to 0.5 µm both show H decreasing with increasing G,
with the rate of decrease clearly accelerating above G ∼ 0.35 µm. While the ac-
tual hardness values are mostly below those for single crystals, correcting them
for porosity would bring them at the minimum to about the mean of single crys-
tal values, and more likely mostly somewhat above the upper range for single
crystal values, i.e. very similar to other data (e.g. Figs. 4.1–4.4). (Thus the mini-
mum b value of e-bP for correcting for porosity would move H values for G ∼
0.04 µm to 10–12 GPa. However, Averback et al.’s data indicates a more likely b
value of ∼ 7.5, which appears more consistent with Mayo et al.’s [28] data. This
b value would move the above H values up to ∼ 15 GPa.) The two HV data points
(2 N load) of Guermazi et al. [31] at G ∼ 0.015 and 5 µm (the former with P ∼
0.15 and the latter from further sintering of the former and unspecified P, but](https://image.slidesharecdn.com/mechanical-properties-of-ceramics-and-composites-120303143122-phpapp01/85/Mechanical-properties-of-ceramics-and-composites-254-320.jpg)
![254 Chapter 4
Figure 4.4 Hardness vs. G -1/2 for hot pressed and single crystal MgO of mainly
Rice et al. [7] at ∼ 22°C. (A) HK data (100 and 500 gm load) giving typical indent
diagonals respectively of ∼ 37 and ∼ 97 µm, showing probable HK minima at G
∼ 15 and ∼ 30 µm respectively for 100 and 500 gm loads. (B) HV (100 and 500 gm
loads, giving typical indent diagonals respectively of ∼ 14 and ∼ 39 µm) showing a
probable HV minimum at G ∼ 30 µm for 100 gm load, and (2) definite HV minimum
at G ∼ 20 µm at 500 gm load. Vertical bars = standard deviation. (From Ref. 7,
published with the permission of the Journal of the American Ceramic Society.)
probably ∼ 0) appear to be fairly consistent with the other data, e.g. correction of
the finer G body with P ∼ 0.15 with b = 4–7.5 gives H values of ∼ 10–17 GPa.
Thus the TiO2 data, while having uncertainties of load and porosity character and
correction, appears consistent with data for other materials over more typical G
ranges with P ∼ 0. Whether the greater rate of decrease at G > ∼ 0.35 µm is the
decrease toward a minimum as found for most other materials is somewhat un-
certain, but given the low load–small indent size of the nanoindentations, this
may be a reasonable possibility.
Tani et al.’s [10] HV (2 N ∼ 200 gm) data for dense hot pressed Y2O3 (Fig.
4.6) shows a substantial (> 20%) decrease in H from the finest (∼ 0.2 µm) to the](https://image.slidesharecdn.com/mechanical-properties-of-ceramics-and-composites-120303143122-phpapp01/85/Mechanical-properties-of-ceramics-and-composites-255-320.jpg)
![Grain Dependence of Indentation Hardness at ∼ 22°C 255
Figure 4.5 HV G -1/2 data for single and polycrystalline (rutile) TiO2 [19,29,31],
WC [30,80,81], and TiAl [99] at ∼ 22°C, mostly for submicron grains.
largest (214 µm) G (in contrast to the significant H increase with increasing G
they observed for their dense Al2O3, Fig. 4.2) but is considerably below most of
Rice et al.’s [7] data, and slightly below Fantozzi et al.’s [33] limited (≤ 10 N ∼ 1
kg, G = 1 and 10 µm) data. Limited larger G (∼20–500 µm, 100 gm-30 kg) data
of Rhodes [34] and Cook [35] (which showed little or no load dependence) lies
somewhat (e.g. 10%) above Tani et al.’s data, while the limited (100–1000 gm, G
∼ 2–500 µm) data of the present study lies 15–25% above Tani et al.’s data.
However, some of the materials of these latter three studies contained ∼ 10%
ThO2 or a La2O3 rich second phase (G = 500 µm material) which could increase
H values. Tani et al.’s 200 gm HK data questions any deviations from a simple](https://image.slidesharecdn.com/mechanical-properties-of-ceramics-and-composites-120303143122-phpapp01/85/Mechanical-properties-of-ceramics-and-composites-256-320.jpg)
![256 Chapter 4
Figure 4.6 Hardness–G -1/2 data for single and polycrystalline Y2O3. HK of Rice
et al. [7] (100 and 500 gm loads), and one data point (100 gm load) of Dutta and
Gazza [32] at ∼ 22°C. HV data of Rice et al. (100, 500, and 1000 gm loads, giving
typical diagonals respectively of 14, 32, and 47 µm), Tani et al. [10] (∼ 200 gm),
Fantozzi et al. [33] (∼ 1 kg), Rhodes [34] (100 gm load, dense sintered, optical
material), and Cook et al. [35] (100 gm–30 kg loads). Vertical bars = standard de-
viation. (From Ref. 7, published with the permission of the Journal of the Ameri-
can Ceramic Society.)
Hall–Petch relation. Heavier load data is too limited to be definitive but also
questions deviations from a simple Hall–Petch relationship. This, combined with
the significantly less cracking [and the earlier noted apparent avoidance of grain
boundary fracture [7] (Chap. 2, Sec. II.D)], suggests there can be exceptions to
the general deviations to a minimum below a Hall–Petch relation, especially for
harder materials, based on material character, not just load and indent geometry.
Pajarec et al.’s [36] HK (100 gm ∼ 1 N) data for cubic (9.4 m/o Y2O3) ZrO2
crystals averaging ∼ 14.5 GPa for various orientations on {100} planes agrees
with data of Rice et al. [7] for similar (but generally lower Y2O3 content) crystals
(Fig. 4.7A). Cochran et al.’s [37] HK (100 gm) of 11.8–13.0 GPa for ZrO2 (+ 9.8
m/o Y2O3) crystals of unknown orientation is somewhat lower. The single crystal
HK data shows no clear dependence on G, which may be due to limited differ-
ences of composition and porosity levels but also likely reflects greater plastic ac-](https://image.slidesharecdn.com/mechanical-properties-of-ceramics-and-composites-120303143122-phpapp01/85/Mechanical-properties-of-ceramics-and-composites-257-320.jpg)
![Grain Dependence of Indentation Hardness at ∼ 22°C 257
Figure 4.7 Hardness vs. G -1/2 for ZrO2. at ∼ 22°C. (A) HK (100 and 500 gm
loads, giving typical indent diagonals respectively of ∼ 32 and 74 µm) of Rice et
al. [7] indicate no apparent G dependence, (B) HV data of Rice et al. [7] (100 and
500 gm loads, giving typical indent diagonals of respectively ∼ 12 and ∼ 27 µm)
and others [40–46]. Some data, especially that of Duh and Wan [44], shows a
clear G dependence. Vertical bars = standard deviation. (From Ref. 7, published
with the permission of the Journal of the American Ceramic Society.)
commodation often feasible in (partially stabilized) ZrO2. Pajarec et al.’s [36]
{100} HV of 16.0 ± 0.1 GPa (200 gm ∼ 2 N), independent of indenter orientation
on the plane, is somewhat higher, but it is still in reasonable agreement with the
present data (Fig. 4.7B). Watanabe and Komaki’s [38] HV (30 kg) data for ZrO2
(2–4 m/o Y2O3) crystals of unknown orientation of ∼ 12.0 ± 0.5 GPa is in excel-
lent agreement with the present data and with earlier data of Wu and Rice [39].
Higuchi et al.’s [40] HV (1 kg) data for hot pressed ZrO2 (+ 8 m/o Y2O3 + 0.1–0.2
w/o C) is somewhat higher than, but in reasonable agreement with, Rice et al.’s
[7] and Chiou et al.’s [41] (5 kg) data for sintered bodies (Fig. 4.7B). Data of Ra-
madas et al. [42] for sintered ZrO2 (0.5 to 7.5 mol%) Y2O3 bodies (at 10 kg load),
corrected to zero porosity [16,43], also generally agreed with their data. Higuchi
et al.’s [40] data suggests greater H dependence at fine G, which is probably more
realistic, since their hot pressed samples had constant composition. Rice et al.’s
samples generally increased in Y2O3 content with increasing G and were sintered,](https://image.slidesharecdn.com/mechanical-properties-of-ceramics-and-composites-120303143122-phpapp01/85/Mechanical-properties-of-ceramics-and-composites-258-320.jpg)
![258 Chapter 4
having some (e.g., a few %) porosity (except for the single crystals). Their data
indicates a limited HV minimum at G ∼ 50 µm, but no clear G dependence at finer
G. However, this may be due to limited composition and porosity effects, since
other data suggest HV increasing with decreasing G at finer G. Duh and Wan’s
[44] data (for Y2O3 + CeO stabilizers and high loads) clearly shows the normal
H–G-1/2 dependence and some, but limited, load dependence. Ruiz and Readeys’
data for 3 mol% Y-TZP (0.13–0.33% porosity) also showed a modest decrease
from 12.7 GPa at the finest G (0.3 µm) to 11.3 GPa at the largest G (5 µm) [45].
Ahlborn et al.’s data for dense (transparent) fully stabilized ZrO2 (with 10 mol%
TiO2 + 7 mol% Y2O3) suggested a slight decrease in HV (unspecified load) from
13.1–13.4 GPa for G = 25 and 90 µm to 12.3 GPa at G = 130 µm [46].
Akimune and Bradt’s [47] HK (100 gm) data for stoichiometric MgAl2O4
crystals, {100} planes, averaging 16.5 ± 1.5 GPa for various orientations and just
over 15 GPa for the {111} plane, is quite consistent with data of Rice et al. [7],
while manufactured HK (100 gm) data for commercially produced stoichiometric
crystals, averaging 13.5 ± 1.5 GPa, is somewhat lower but not grossly inconsis-
tent with other data (Fig. 4.8). Rhodes et al.’s [48] HK (100 gm) for polycrys-
Figure 4.8 HK vs. G -1/2 for single and polycrystalline MgAl2O4 at ∼ 22°C. Data of
Rice et al. [7] (100 and 500 gm loads, giving typical indent diagonals respectively
of ∼ 29 and ∼ 71 µm) and of Rhodes et al. [48] (100 gm load). Rice et al.’s 100 gm
data, taken by itself, would suggest a possible HK (probably anomalous) maxi-
mum at intermediate G, especially when effects of increasing (to several %)
porosity with decreasing G are considered. Other data all indicates an HK mini-
mum. Data of Rhodes et al. suggests a definite HK minimum between G ∼ 5 and
20 µm. Vertical bars = standard deviation. (From Ref. 7, published with the per-
mission of the Journal of the American Ceramic Society.)](https://image.slidesharecdn.com/mechanical-properties-of-ceramics-and-composites-120303143122-phpapp01/85/Mechanical-properties-of-ceramics-and-composites-259-320.jpg)
![Grain Dependence of Indentation Hardness at ∼ 22°C 259
Figure 4.9 HV vs. G -1/2 data for MgA12O4 at ∼ 22°C of Rice et al. [7] (100, 500,
and 1000 gm loads giving typical indent diagonals respectively of ∼ 10, 26, and
38 µm). Note data for three principal planes for stoichiometric (Czochralski) and
random planes of alumina rich (Vernulil) single crystals. Vertical bars = standard
deviation. Horizontal bar = G range for Budnikov et al.’s [49] 90 gm data. (From
Ref. 7, published with the permission of the Journal of the American Ceramic So-
ciety.)
talline MgAl2O4 specimens (press forged or hot pressed, typically with about 1%
Li-based additions), is considerably below the present data (Fig. 4.8) but clearly
suggests that hardness first decreases with increasing G and later increases with
increasing G as one approaches single crystal values, i.e., a HK minimum at G
5–15 µm at 100 gm load. While Rice at al.’s 100 gm data is uncertain, their 500
gm data showed a minimum at G ∼ 100 µm, e.g., in view of some porosity in es-
pecially the finest G bodies. The more extensive single crystal HV, including
lower HV of alumina rich versus stoichiometric crystals, and polycrystalline data
of Rice et al. (Fig. 4.9), shows distinct HV minima at G ∼ 50–400, 50, and 20 µm,
respectively for loads of 100, 500, and 1000 gm. Budnikov et al.’s [49] MgAl2O4
HV (∼ 90 gm) data lies below the other data but is reasonably consistent with it.
Note (1) that the greater uncertainty in the degree and extent of G dependence at
finer G is probably due to the limited porosity in finer G specimens, and (2) that
both sets of Rice et al.’s data involve some specimens of varying stoichiometry
(e.g. some of the bodies in Fig. 3.10), which probably adds to the variations.
Okazaki and Nagata’s HV (unspecified load) data for PZT, though covering](https://image.slidesharecdn.com/mechanical-properties-of-ceramics-and-composites-120303143122-phpapp01/85/Mechanical-properties-of-ceramics-and-composites-260-320.jpg)
![260 Chapter 4
only a limited G range (with P ∼ 0.05) [12,50], indicates little or no minimum
(Fig. 4.14).
B. Borides, Carbides, and Nitrides
Limited TiB2 HV data of Rice et al. [7] and the one HV literature data point [51]
agree but are insufficient to indicate whether deviations from a simple Hall–Petch
H–G trend occur, but the limited data indicate HK first decreases substantially and
then increases substantially as G decreases (Fig. 4.10). The 100 gm data of other
investigators substantially reinforces this possible trend, e.g., a HK minimum at G
∼ 10 µm. Although scattered, the 100 gm HK data of Vahldiek and Mersol [53],
Flinn et al. [54], McCawley et al. [55], and Nakano et al. [56] generally agree
with each other, and with Rice et al.’s data, as does the unspecified H (2 N load)
of Miyamoto and Koizumi’s [57] reaction processed TiB2 (G ∼ 5 µm, P ∼ 0.05).
Similarly, 200 N HV data of Watanabe and Kouno [58] for TiB2 processed with
various types and amounts of additives with 0 or a few percent porosity (data
Figure 4.10 Hardness vs. G -1/2 for single- and polycrystal TiB2 at ∼ 22°C. Rice et
al.’s HK data [7] (100, 500, and 1000 gm loads giving typical indent diagonals re-
spectively of 25, 60, and 87 µm). Also shown are limited HK data of Koester and
Moak [52], Vahldiek and Mersol [53], Schlain et al. [54,55], and Nakano et al. [56]
(100 gm load); also HV data of Rice et al. (100 and 500 gm loads), and Zavitsanos
and Morris [51] (200 gm load). Vertical bars = standard deviations. (From Ref. 7,
published with the permission of the Journal of the American Ceramic Society.)](https://image.slidesharecdn.com/mechanical-properties-of-ceramics-and-composites-120303143122-phpapp01/85/Mechanical-properties-of-ceramics-and-composites-261-320.jpg)
![Grain Dependence of Indentation Hardness at ∼ 22°C 261
Figure 4.11 HK vs. G -1/2 for polycrystalline B4C at ∼ 22°C. Data of Rice et al. [7]
(100 and 500 gm loads) and Kalish et al. [59] (200 gm load giving a typical indent
diagonal of ∼ 11µm; numbers above and below this data give the B/C ratio). Verti-
cal bars = standard deviations. (From Ref. 7, published with the permission of the
Journal of the American Ceramic Society.)
corrected to 0 porosity) for G ∼ 2–7 µm giving values of ∼ 21–23 GPa, with a lim-
ited decrease as G increases, is in good agreement with data of Fig. 4.10.
Kalish et al.’s [59] HK (200 gm) data for hot pressed B4C with B/C carbon
ratios ranging from 3.7 to 5.5 is consistent with that of Rice et al. [7], i.e., lying
in the appropriate range between the 100 gm and 500 gm load (Fig. 4.11). Their
data show a general decrease in HK with increasing G over the range observed (∼
2 to 23 µm), indicating that G was a more important factor in changing H than
was the B/C ratio itself (though G was probably highly influenced by the B/C ra-
tio). This data does not show a clear H minimum, but data for B/C = 3.7–3.8 may
indicate one at G ∼ 20 µm. The limited data of Rice et al. [7] would not indicate
an HK minimum at 100 gm load (in fact, if taken literally, it would imply a maxi-
mum) but would indicate an HK minimum at G ∼ 25 µm (500 gm load). Data of](https://image.slidesharecdn.com/mechanical-properties-of-ceramics-and-composites-120303143122-phpapp01/85/Mechanical-properties-of-ceramics-and-composites-262-320.jpg)
![262 Chapter 4
Munir and Veerkamp [60] on their hot pressed B4C showed HV (unspecified
load) decreasing from ∼ 48.5 GPa at G ∼ 2 µm to a minimum of ∼ 42 GPa at G ∼
17 µm in reasonable agreement with HK data of Fig. 4.11.
Niihara’s [61] substantial tests of 6H SiC crystals shows 100 gm HK ∼
24–27.8 GPa as a function of orientation on (0001), 26.9–31.5 GPa on {1 10},
0
and 21.9–29.8 GPa on {1 20} planes, in good agreement with Sawyer et al.’s
1
[62] data for the same α crystal planes of respectively 29.5, 21.3–27.6, and
23.9–27.6 GPa at 100 gm and more limited 300 gm data of Adewoye and Page
[63] of 27.8–31.3 GPa and of Fujita et al.’s [64] 500 gm values of 20–28 GPa
(see also McColm [65] for some values). Page and colleagues’ 1 kg polycrys-
talline SiC data [62,63,66,67] by itself suggests HK first decreases and then in-
creases as G decreases, i.e., an HK minimum at G ∼ 10 µm (Fig. 4.12). The
limited (500 gm) data is consistent with Page’s 1 kg data. While the limited 100
FIGURE 4.12 HK–G -1/2 data for single and polycrystalline SiC at ∼ 22°C. Data of
Rice et al. [7] (100 and 500 gm loads, giving typical diagonals respectively of ∼ 7
and 20 µm) and of Page et al. [62,63,66,67] (1 kg). Vertical bars = standard devi-
ations. (From Ref. 7, published with the permission of the Journal of the American
Ceramic Society.)](https://image.slidesharecdn.com/mechanical-properties-of-ceramics-and-composites-120303143122-phpapp01/85/Mechanical-properties-of-ceramics-and-composites-263-320.jpg)
![Grain Dependence of Indentation Hardness at ∼ 22°C 263
gm SiC HV data is insufficient to show any trend, higher load data of Rice et al.
[7] and the literature [7,23,62] suggest an HV minimum e.g. at G ∼ 30 µm (500
gm). The phase content of some of the polycrystalline bodies varies or is not
specified for some bodies, so some of the variation probably reflects varying α
and β contents, which does not appear to have near as marked H impact as for
Si3N4.
HV SiC data shows similar trends, e.g. 100 gm values on the same crystal
planes of ∼ 27–32 GPa of [68], and 500 gm values of 30.2–32.5 and 37.7–46.7
GPa at 100 gm [69]. The limited 100 gm polycrystalline data of Rice et al. [7]
was again scattered (but in a different fashion from the HK data on the same
specimens indicating specimen variations), but their 500 gm load data indicates
a probable HV minimum, as did data of Page et al., but at uncertain G values.
More recent data on CVD SiC of Kim et al. [70] and Kim and Choi [71], though
complicated by incomplete grain characterization, e.g. of varying degrees and
types of grain orientation and colony structure, supports H increasing as G de-
creases at finer G. Again, more limited effects of α and β contents is indicated.
More recent data at nanoscale G is generally consistent with H for normal G val-
ues (see Sec. III.A).
While TiC data is generally limited in the G range, especially for any one
investigator, collectively there is considerable data (mostly for G ≥ 10 µm),
which is generally reasonably consistent for a given load range and indenter be-
tween different investigators. Collectively, this data is consistent with an HK, and
especially an HV minimum at G ∼ 20 µm). The single crystal HK data of Rice et
al. [7] (for material believed to have a Ti/C ratio of ∼ 1) and the single crystal
data of Rowcliffe and Hollox [72] and Hannick et al. [73] agree fairly well. Also,
the highest Ti stoichiometry (0.93) data point of Miracle and Lipsitt [74] (1 kg
load) agrees reasonably well with the similar G data of Rice et al. [7]. Similarly,
there is reasonable agreement of HV crystal data of Rice et al. with that of Ku-
mashiro et al. [75] and that of Shimada et al. [76] (1 kg load) on {100}, which
gave 26–28 GPa, as well as the large G (∼ 400 µm) data of Cadoff et al. [77].
Data of Yamada et al. [78] also indicate H increasing with the C/Ti ratio and
agrees with HV values of Rice et al. HV data of Yamada et al. and of Leonhardt et
al. [79] both indicate H increasing at finer G, as overall does the other data.
Limited data for pure WC of Lee and Gurland [80] clearly indicates a
marked increase in HV (15 kg load) as G decreases from ∼ 4 to ∼ 1 µm ( Fig. 4.5).
Limited data of McCandlish et al. [81] (see Andrievski [30]) with somewhat
smaller (nanoscale) grains in WC + 10 vol% Co also shows H markedly increas-
ing with decreasing G, consistent with most other materials. Most, and probably
all, of the lower H values for the WC-Co body versus those for pure WC of the
same G are probably due to the effects of the Co, i.e. this data appears consistent
with the model of Lee and Gurland [80] for effects of the Co boundary phase on
the hardness of such bodies.](https://image.slidesharecdn.com/mechanical-properties-of-ceramics-and-composites-120303143122-phpapp01/85/Mechanical-properties-of-ceramics-and-composites-264-320.jpg)
![264 Chapter 4
While there has been extensive development of AlN, hardness data
is limited, especially over a reasonable G range. However, Rafaniello’s more
extensive data clearly shows HV (9.8 N) decreasing with increasing G, e.g.
decreasing ∼ 10% between G ∼ 2+ and 12 µm from ∼ 10+ to ∼ 9- GPa [82]
(Fig. 5.4).
McColm [65] has compiled much of the limited BN data, giving HV for
hexagonal material ∼ 2 GPa versus ∼ 46 GPa for cubic material for loads of ∼
0.25–1.5 N with unspecified G. He also reports values of ∼ 35 and 42 GPa for
bodies with G ∼ 3 µm with respectively 10 and 85% cubic content, thus pro-
viding extreme examples of the impact of phase content on H. He further
compiled HK (∼ 4.9 N load) data on bodies of G = 1–3, 1–5, 3–9, and 10 µm
giving respectively ∼ 39, 34, 33, and 30 GPa, thus implying a typical H de-
crease with increasing G at finer G, but there are uncertainties due to differing
binder compositions and amounts as well as probable variations in residual
porosity. Single crystal values of 43 GPa at the same 4.9 N load again suggest
an H minimum. [This HK value is consistent with another (1 kg load) of 45
GPa [3].]
Polycrystalline (mainly hot pressed) Si3N4 data of Rice et al. [7] is gen-
erally consistent with other data [13,14,23,65,83–85] for similar bodies, i.e.
those with substantial β-Si3N4 content (Fig. 4.13). This data is also consistent
with that of Mukhopadhyay et al. [86,87] (H ∼ 12–15 GPa for G ∼ 1–4µ, data
not shown in Fig. 4.13 to avoid confusion). Niihara and Hirai’s HV (100 gm)
data for CVD (pyrolytic) polycrystalline SiC [11], along with (α) single crys-
tals [62,63,66,88,89], is clearly above almost all hot pressed Si3N4 data. Grain
boundary phases from additives and impurities in hot pressed samples proba-
bly contribute to their lower values. However, significantly lower β- versus α-
Si3N4 polycrystalline or single crystal values are again shown, as previously
reported [13], so variable β contents in hot pressed samples are an important
reason for their lower and variable values. Distinctly lower H for β- vs. α-
Si3N4 was shown by Greskovich and Yeh [13] and more recently by Ueno
[90]. Both the hot pressed and especially the CVD (pyrolytic) data clearly
suggests H first decreasing with increasing G (as also reported by
Mukhopahyay et al. [86,87]) and then subsequently increasing, with single
crystal values being higher than at least most of the range of polycrystalline
values, i.e. a distinct HV minimum at G ∼ 20–100 µm at 100 gm load for CVD
material and also possibly for hot pressed material, since it typically contains
considerable β-phase. This trend for an H minimum provides an alternate ex-
planation for the failure of Niihara and Hirai’s data to extrapolate to single
crystal values, which is consistent with a broad range of behavior of other ma-
terials, seriously questioning their proposed G –1 dependence of H. Note also
that the data collectively indicates a probable H minimum at higher, e.g.,
500–1000 gm, loads.](https://image.slidesharecdn.com/mechanical-properties-of-ceramics-and-composites-120303143122-phpapp01/85/Mechanical-properties-of-ceramics-and-composites-265-320.jpg)
![Grain Dependence of Indentation Hardness at ∼ 22°C 265
FIGURE 4.13 HV vs. G -1/2 for single and polycrystalline Si3N4 at ∼ 22°C. Data of
Rice et al. [7] (100 and 500 gm loads) and other studies at 100, 500, and 1000
gm loads as shown. Note that P indicates pyrolytic, i.e., CVD, Si3N4, H hot
pressed, and α and β the predominance of these respective phases. Where spe-
cific data on additive content for hot pressed material is available, it is shown next
to the data point (one data point for 0% additives is the result of high pressure hot
pressing [84]). Vertical bars = standard deviations. (From Ref. 7, published with
the permission of the Journal of the American Ceramic Society.)
C. Effects of Indenter Geometry and Load, and Other Constituents
and Materials
Pyramidal indenters such as Knoop and Vickers have planar sides that make uni-
formly shaped indentations that vary only in relative size with indent load. How-
ever, such indenters give different hardness values due to differences in
interaction with differing surface layers and microstructures as well as their not
being defined on the same basis, i.e. Knoop and Vickers hardnesses are defined
respectively by the maximum cross-sectional area and the actual surface contact
area of the indenter with the material [91]. Table 4.1 summarizes the approxi-
mate average hardness values for common ceramic materials with substantial
data for Knoop and Vickers hardness for 100 and 500 gm loads. This shows that](https://image.slidesharecdn.com/mechanical-properties-of-ceramics-and-composites-120303143122-phpapp01/85/Mechanical-properties-of-ceramics-and-composites-266-320.jpg)
![266 Chapter 4
while HK > HV at a 100 gm load, often substantially so, the reverse is generally
true at 500 gm loads. Since indent dimensions are inversely related to H values,
and the H minimums commonly observed are related to indent-to-grain-size ra-
tios due to cracking, as discussed in the next section, this indicates some relative
shifts in H minimum with indent geometry and load and related cracking and the
grain sizes at which they occur.
While Knoop and Vickers indentations are dominant for ceramics, some,
mostly older, ceramic data has been taken with spherical indenters due for exam-
ple to wider use of such indenters for metals. Only a fraction of this limited ce-
ramic data is available as a function of G, but spherical indenter tests are
common in metals where a Petch-type relation is generally followed, e.g. Bun-
shah and Armstrong [92]. Floyd’s Rockwell 45N scale data for a 96% alumina
composition with G varying from 6 to 25 µm clearly also follows a Petch-type
relation [93], as does the Rockwell A hardness of WC-12 wt% Co (G ∼ 1–6 µm)
[94]. Given the typical large size of such ball indenters, and the high loads com-
monly used, a possible H minimum could occur with such indents but would be
expected at much larger grain sizes [i.e. use of different size indenters could be
useful in better defining the occurrence and mechanism(s) of such H minima
along with load dependences].
Consider next the effects of other constituents on H, a large subject that
can be only outlined here, highlighting possible impacts on G dependence of H.
(See also Chap. 7, Sec. II for data on temperature dependence of hardness and
Chaps. 10 and 11 for hardness of ceramic composites.) Impurities or additives
that are in solid solution can affect H values. While solid solutions can reduce H,
e.g. as indicated in alumina rich MgAl2O4 crystals (Fig. 4.9), it often increases H,
e.g. as illustrated by alumina data. Thus Belon et al. [95] showed that ∼ 2 mol%
additions of isomorphous single (Cr2O3, Ti2O3,V2O3, or Ga2O3) or mixed oxides
(MgTiO3) individually increased HK values (unspecified load) of A12O3 by
15–25%, while simultaneous additions of Cr2O3 with Ti2O3 or Ga2O3 increased H
values 35–40%. All additions passed through H maxima at 1.5 (Cr2O3) to 3 (Mg-
TiO3) m/o additions (in bodies made via vacuum melting, with additive levels
determined after fusion). These A12O3 results are similar to those of Albrecht
[96] showing an H maximum at ∼ 3 mol% Cr2O3. These Cr2O3 addition results
are in contrast to those of Bradt [97] showing a linear HV (500 gm) increase of
nearly 1% per m/o Cr2O3 to at least 12 m/o in samples hot pressed at various
temperatures (but with the reduced surface layer removed). Shinozaki et al. [98]
showed similar, but varying, results with HV (200 gm) increasing by 10–15%,
peaking at ∼ 20 m/o (with higher H for firing at 1600°C and somewhat lower H
peaking at ∼ 15 m/o for firing at 1700°C, both under reducing conditions). These
different results probably reflect different rates and extents of Cr2O3 solution due
to differing degrees of mixing, reduction, and firing, which have received little or
no attention, but which may impact H directly or via G. However, Shinozaki et](https://image.slidesharecdn.com/mechanical-properties-of-ceramics-and-composites-120303143122-phpapp01/85/Mechanical-properties-of-ceramics-and-composites-267-320.jpg)
![Grain Dependence of Indentation Hardness at ∼ 22°C 267
al.’s results imply a lower H maximum at lower Cr2O3 levels with larger G ex-
pected from higher firing. Bradt clearly showed lower H due to larger G (e.g. ∼
10 versus ∼ 2 µm), but details of composition-processing-microstructure-hard-
ness need further clarification.
The above variations in part indicate two sets of complexities of studying
composition effects on H. The first set is due to additions of other materials im-
pacting both sintering and grain growth, so truly valid comparisons can only be
made by comparing bodies of sufficiently similar microstructures directly or by
correcting results for such effects (e.g. using results of this chapter). These com-
plexities are compounded by the extent of homogeneous mixing achieved, which
is a complex function of the uniformity and scale of initial mixing and the tem-
perature–time (and possibly atmosphere) of densification or additional heat treat-
ment. The firing atmosphere can be important, since the stoichiometry of the
additives, matrix, or both may be altered, impacting the extent and character of
the solid solution. Such effects are closely related to those of stoichiometry of
even a single constituent body, e.g. effects in bodies more susceptible to stoi-
chiometric variations such as Cr, Ti (e.g. note effects on crack propagation, Fig.
2.5), and Zr oxides and B, Ti, and Zr carbides. Thus again note that major effects
of stoichiometry are often primarily via effects on G, but there is some residual
effect of the stoichiometry alone, e.g. B4C (Fig. 4.11) and TiC [7,74]. The second
set of complexities, stoichiometry variations of the body, additive(s), or both,
may often vary with depth from the surface, which may vary with grain size due
to differing temperature giving different G values, and to effects of grain bound-
ary diffusion, which may be dependent on G values. For the above reasons, espe-
cially the latter one, single crystal data for the stoichiometry or composition
considered are a valuable guidepost to compare with polycrystalline results, e.g.
as extensively shown by results reviewed in this chapter. Thus data for carbide
crystals of differing stoichiometry clearly show differing H values.
Effects of additives or impurities on H values as second phases may differ,
often substantially, from those found with solid solution, with two extremes of-
ten having differing results. The first extreme, often with the greatest differences
and variations, is formation of a second phase along grain boundaries. As briefly
noted earlier (Fig. 4.5, see also Chap. 10), a softer bonding boundary phase such
as Co for WC reduces hardness in proportion to both the hardnesses of the two
phases, their volume fractions, and their microstructural character, i.e. grain size
of the matrix and mean free path between binder phase boundary “sheets.” On
the other hand, residuals from LiF additions in MgO (Fig. 4.21) and MgAl2O4
greatly exacerbate cracking around indents due to their enhancing intergranular
fracture, i.e. local indent effects similar and related to the macrofracture and
crack propagation effects noted for such additives (Fig. 2.12). Similarly, the sig-
nificant decrease in H with decreasing G at fine G in the limited TiAl data of
Chang et al. [99] (see Andrievski [30]) indicating opposite trends from almost all](https://image.slidesharecdn.com/mechanical-properties-of-ceramics-and-composites-120303143122-phpapp01/85/Mechanical-properties-of-ceramics-and-composites-268-320.jpg)
![268 Chapter 4
other materials (Fig. 4.5) may reflect grain boundary impurities left from species
absorbed on the nanoparticle similar to those indicated as sources of low
strengths in nanoceramics (Chap. 3, Sec. IV.A).
The other extreme of second-phase distribution, which again reflects a
composite structure (Chaps. 10 and 11), is homogeneous precipitation. Thus
while effects will vary with the amount and the chemical and physical nature of
the precipitate versus those of the matrix, precipitation commonly increases
hardness values over those for solid solutions of the same composition. For ex-
ample, studies of TiO2 precipitation in Al2O3 of Bratton [100], show that the pre-
cipitation of the modest levels of TiO2 solid solution achievable (∼ 0.1 wt%)
increases HK values by 10–20%. Similarly, it is well known that precipitation in
alumina rich MgAl2O4 crystals can increase H values, e.g. by ∼ 15%, but with
varying dependence on heat treatments, e.g. Lewis et al. [101]. However, again
note that in differing polycrystalline compositions varying spinel stoichiometry
has much of its effects on H values via its impact on G.
ZrO2 bodies with varying additives for partial or full stabilization of the
cubic or tetragonal phases can reflect various combinations of the above second-
phase distributions. However, while such effects must be factors in the variations
(and probably the indications of limited G dependence), the data, mainly for dif-
ferent types and levels of Y2O3 stabilization, does not appear to be a large factor
in the H–G dependence, nor of ZrO2-Y2O3 crystals [7,39]. The consistency of the
ZrO2 trends with other data, despite variable Y2O3 compositions, reinforces the
limited effect of Y2O3 content.
Consider now other, primarily softer, less refractory materials, starting
with limited halide data from a previous compilation [12] (Fig. 4.14), where,
while not always specified, loads were commonly ∼ 100 gm. Both the KCl and
the BaF2 HV data, while each consisting of one data set for single crystals and a
few or one for the respective polycrystals (G ∼ 10 µm), indicate little or no op-
portunity for an intervening H minimum. Such proscription of an H minimum is
uncertain for the one HK data set for MgF2 crystals and two data sets for fine-
grain polycrystals.
HV and HK data on various rocks of nominally single-phase composition of
Brace [102,103] all indicate that any intervening H minimum must be at G >
several hundred microns (Fig. 4.14). However, the apparent high loads (to 150
kg) would indicate that any minimum would be at such high G values as would
the lower hardness of most of these materials, especially the limestone. Note that
the higher H values for dolomite in part reflect solid solution effects, since it is a
solution of Mg and Ca carbonates. (Note also that Brace’s data is based on using
the maximum G values (with measurement specifics not given), which increases
the slopes on Petch plots to the extent of the average to maximum G ratio, which
most likely varies some for the different rocks.)
Finally, consider data for cubic ZnS and ZnSe, which have been devel-](https://image.slidesharecdn.com/mechanical-properties-of-ceramics-and-composites-120303143122-phpapp01/85/Mechanical-properties-of-ceramics-and-composites-269-320.jpg)
![Grain Dependence of Indentation Hardness at ∼ 22°C 269
FIGURE 4.14 H vs. G -1/2 for KCl, MgF2, BaF2 [12] and PZT [12, 50], and for some
nominally single-phase rocks after Brace [102] at ∼ 22°C. Note that the latter
used the maximum G values, which increase the slopes by unknown and proba-
bly different amounts.
oped for IR window applications. Most extensive is HV (10 N, ∼ 1 kg and 100 N
∼ 10 kg) data on CVD ZnS [104–106], covering a substantial G range, which
clearly shows H first substantially decreasing with increasing G and then in-
creasing again, so that projected single crystal values would be higher than a
fair range of the polycrystalline values (Fig. 4.15). The projected HV value is in
good agreement with HV values of ∼ 1.8 ± 0.3 GPa from studies of Lendvay and
Fock [107] on single crystals with similar multikilogram loads. This data is also
consistent with limited, previously compiled [12] polycrystalline data (appar-
ently with low, e.g. 100 gm, loads) for G ∼ 3 and 0.8 µm, giving respective HK
values of ∼ 2 and ∼ 3 GPa. More limited HK (50 gm load) data for isostructural
and similarly prepared CVD ZnSe of Swanson and Pappis [108] for G = 30–100](https://image.slidesharecdn.com/mechanical-properties-of-ceramics-and-composites-120303143122-phpapp01/85/Mechanical-properties-of-ceramics-and-composites-270-320.jpg)
![270 Chapter 4
Figure 4.15 H vs. G -1/2 for ZnS. Vickers hardness data for CVD-ZnS [106–108]
at 10 N (∼ 1 kg) and 100 N (∼ 10 kg) loads at ∼ 22°C. Note the distinct HV minima
at G ∼ 20 µm and ∼ 150 µm respectively. (From Ref. 7, published with the permis-
sion of the Journal of the American Ceramic Society.)
µm fit a Petch relation: HK ∼ 0.8 + 1.7G1/2 GPa (for G in µm). It is not clear
whether this data reflects an approach to an H minimum (i.e. at G ∼ or > 30 µm)
or the absence of one given the lower hardness and load of ZnSe and load used.
D. Occurrence and Character of Indent-Related Cracking
Associated with H Minima
As shown earlier, H minima were generally observed with most harder, more re-
fractory ceramics, and also some softer, less refractory materials. It was also
shown that the extent of deviation of the H minima below the normal Petch de-
pendence and the G values of the H minima, while both material dependent, both
generally increased as the indent load increased. It was also noted that these H
minima were associated with a maximum of the amount and complexity of
cracking. This section documents this cracking and its association with H min-
ima and shows that such minima occur when the indent and grain sizes are about
the same; but this cracking can be seriously exacerbated by grain boundary
phases enhancing intergranular fracture. Thus in contrast to a continuous in-](https://image.slidesharecdn.com/mechanical-properties-of-ceramics-and-composites-120303143122-phpapp01/85/Mechanical-properties-of-ceramics-and-composites-271-320.jpg)
![Grain Dependence of Indentation Hardness at ∼ 22°C 271
crease in H with decreasing G, when such H minima and associated cracking oc-
cur, H values first decrease from single crystal values (i.e. at G = ∞) as G de-
creases until the indent size is on ∼ the same scale as the G and then increases as
G decreases further, following a modified Petch relation (i.e. extrapolating to <
single crystal H values at G = ∞).
First consider the G dependence of such minima, which is shown by both
direct correlation with G values, and subsequent direct observations of the crack-
ing associated with the H minima. Correlation with G data is provided by Table
4.2, which shows the ratio of the grain size at the H minima to the indent diago-
nal length (d) for materials having clear minima at one or more test loads. This
shows that, while there is variation (discussed later), the H minima occur when
G/d is ∼ 2–5 for Vickers and ∼ 1 for Knoop indents. (This trend is also indicated
in many of the preceding H–G-1/2 plots, where an average value of d is given for
some of the loads and materials.)
Next consider the character and occurrence of such cracking of interest
here, which is not the commonly reported ∼ linear cracks extending out from one
or more of the indent main diagonals often used for measuring toughness. The
cracking of interest here is instead more localized around the indent, often of a
spalling character, and in polycrystalline bodies it occurs extensively via inter-
granular fracture (Figs. 4.16–4.20). This localized cracking may exist mainly or
exclusively by itself (e.g. Figs. 4.16B–D, 4.17D, 4.18BC, and 4.20), or in combi-
nation with the more commonly reported ∼ linear cracking (e.g. Figs 4.17D and
4.19B). Again, much of the cracking of interest is of a spalling character and is
often intergranular, especially when the indent size is similar to G. As G be-
comes larger than the indent size, cracking again diminishes towards that of sin-
gle crystals, where cracking is generally less than in large grain bodies, and is
TABLE 4.2 Grain Size/Indent Diagonal Ratios at Hardness Minimaa
HV HK
Material 100 gm 500 gm 1 kg 100 gm 500 gm
Al2O3 50–100/23 50/24 50–100/68
BeO 100/26 100/58
MgO 20/14 25/43 15/39 30/100
ZrO2 50/12 50/29
MgAl2O4 50–200/11 50/26 20/37 100/74
TiB2 15/28
ZnS 25/110
Average 5±4 2±1 1 ± 0.9 1 ± 0.9 1 ± 0.5
a
Values in µm. Source: After Rice et al. [7], published with the permission of the Journal of
the American Ceramic Society.](https://image.slidesharecdn.com/mechanical-properties-of-ceramics-and-composites-120303143122-phpapp01/85/Mechanical-properties-of-ceramics-and-composites-272-320.jpg)
![272 Chapter 4
Figure 4.16 Knoop indents in polycrystalline A12O3 at 500 gm with increasing
G. Nominal G was (A) 6 µm, (B) 11 µm, (C) 3, 11 µm (bimodal), and (D) 40 µm.
Note the general tendency for greater cracking, especially locally around the in-
dent as G increases. (After Rice et al., [7], published with the permission of the
Journal of the American Ceramic Society.)
more ordered (i.e., some along preferred fracture on cleavage planes), hence pro-
viding less opportunities for spalling (e.g., Fig. 4.19). Similar indent-induced
cracking in dense sintered Al2O3 (G 20–30 µm) was shown by Lankford [109] at
similar loads (e.g. 0.6 kg) at both room and modest elevated temperatures, and
Anstis et al [110] reported such cracking in a dense Al2O3 with G ∼ 20 µm (50 N
load), but not finer G (∼ 3 µm) or sapphire.
There are three intrinsic factors and one extrinsic factor that vary the above
cracking. The first two and most distinct are test factors of load and indent type.](https://image.slidesharecdn.com/mechanical-properties-of-ceramics-and-composites-120303143122-phpapp01/85/Mechanical-properties-of-ceramics-and-composites-273-320.jpg)
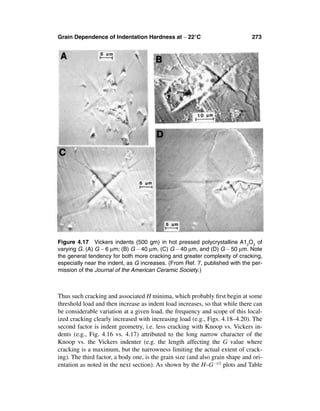
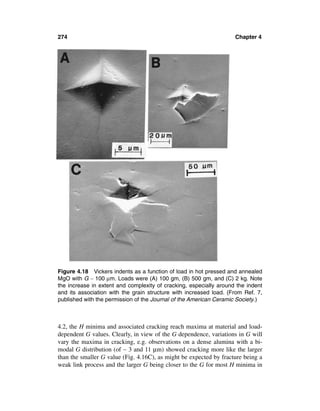

![276 Chapter 4
Figure 4.20 Vickers indents at various loads in MgO hot pressed (with LiF), but
unannealed, having G ∼ 5 µm. Loads were (A) 50 gm, (B) 100 gm, (C) 500 gm, and
(D) 1 kg. Note increasing grain boundary cracking as load increased. (From Ref. 7,
published with the permission of the Journal of the American Ceramic Society.)
with LiF, but unannealed). MgAl2O4 hot pressed with similar additives also
showed distinctly more local cracking and spalling vs. sintered material with no
additive, despite much larger G in both bodies [7]. Such effects in both MgO and
MgAl2O4 are consistent with reduced fracture energies/toughnesses for such
bodies and increased intergranular fracture on a macro scale (Fig. 2.12).
A set of tests performed by Sperisen et al. [111], though limited, are very
suggestive in their results and implications for future testing. They used a Vick-
ers indenter mounted on the cross-head of a conventional testing machine so the
rate of loading and unloading, as well as the loading level and time, could be in-
dependently controlled along with two supplemental testing aspects. The first
was the use of acoustic emission detection during indentation, and second the
use of a specimen holder allowing the surface to be indented to be covered with
a liquid; in their case by oil or water for an inert versus active fluid. Using two
dense, pure hot pressed alumina bodies (G ∼ 1 and ∼ 6 µm) they observed effects](https://image.slidesharecdn.com/mechanical-properties-of-ceramics-and-composites-120303143122-phpapp01/85/Mechanical-properties-of-ceramics-and-composites-277-320.jpg)
![Grain Dependence of Indentation Hardness at ∼ 22°C 277
of these parameters on both cracking from the indent corners (as for toughness
measurements) and local spalling cracks, almost exclusively via intergranular
fracture, in and around indents. While the cracking process was complex and
somewhat variable, there were important trends, one of the most basic being that
acoustic emission showed that most cracking occurred in three stages during
loading, but some limited cracking occurred during two unloading stages. The
nature and extent of these stages varied with G and the fluid environment of the
indent. Indent cracks, e.g. for toughness measurement, which were mostly inter-
granular, appeared to initiate as Palmquist cracks that subsequently joined, with
subsequent crack-to-indent-size ratios being the same for water and oil environ-
ments, reaching a constant level by loads of ∼ 15 N for G ∼ 1 µm, but were still
not fully independent of load for G ∼ 6 µm ∼ 15 N load. The intergranular spall
cracking was found to have no apparent threshold, i.e. observed at the lowest
load tested (∼ 10-2 N), and to be substantially greater for the larger G and with
water versus oil. Though limited and raising issues of the relative effects of the
fluids as chemical species versus lubricants, such tests are suggestive of impor-
tant complexities that have been almost totally neglected and deserve much more
use and evaluation.
E. Effects of Grain Shape and Orientation, and Other Factors
There is very little data directly on the effects of preferred grain orientation on
hardness, and as is unfortunately so common, very limited or no quantitative
characterization of the degree and character of preferred orientation in speci-
mens. This is a serious lack, since local or global orientation (or both ) can fre-
quently be substantial and often, but not necessarily, occur with grain elongation.
While either or both local and global orientation occur in vapor deposited (e.g.
CVD) coatings or bodies [e.g. 68], some orientation can be much more common
than is often noted in a variety of bodies, e.g. various sintered ones. However,
there is substantial data on the effects of indent orientation on various single
crystal surfaces that provides clear and detailed information on the limits of
polycrystalline orientation effects on hardness. Such data is also a major demon-
stration of plastic deformation as the determining factor in hardness indentation
of even the hardest materials. Thus, as noted in the introduction, the dependence
of hardness on differing crystal surfaces and on indenter geometry and its orien-
tation relative to crystal directions on a given crystallographic surface has been
extensively and consistently shown to be due to varying activation of differing
crystal slip systems [1–4]. There are substantially differing effects of different
indenters, but there is a simple approximate interrelation between Knoop and
Vickers [2] (the latter having less pronounced anisotropy). There are also the
usual effects of load on hardness levels, and there may be some changes in the
nature of the orientation dependence with differing loads due to some shifts in](https://image.slidesharecdn.com/mechanical-properties-of-ceramics-and-composites-120303143122-phpapp01/85/Mechanical-properties-of-ceramics-and-composites-278-320.jpg)
![278 Chapter 4
the balance of activation of differing slip systems. (There are also significant ef-
fects of temperature, e.g. Fig. 7.1, and differing effects of tensile versus com-
pressive stresses [3] that can be pertinent to details of the relation of hardness
and compressive strength, Chap. 5, Sect. II.B.) The orientation dependence of
hardness on major, i.e. low index, crystal surfaces, is typically approximately a
sinusoidal wave, often with some modifications, e.g. Fig. 4.21 (see also Fig. 7.1).
As reference for the extremes in the orientation dependence of hardness of
polycrystalline ceramics, an outline of the single crystal orientation dependence
is presented in Table 4.3 showing representative values of the maximum and
minimum hardness and their ratio. Materials with extremely anisotropic struc-
tures (commonly materials with platy structures such as graphite, hexagonal BN,
and mica) have extremes of hardness anisotropy and hence significant effects of
preferred orientation on polycrystalline hardnesses (though these materials also
commonly present challenges in obtaining good hardness values, especially with
the loading direction parallel with the plane of the platy structure). Though not
as extreme, other ceramics often have substantial hardness anisotropy, which of-
ten varies as much as or more for ceramics of various cubic versus those of non-
cubic structures (Table 4.3). Substantial other data is also available, e.g. for TiO2
[27], MgAl2O4 [47], SiC [63,66–69], other carbides [72,73,112], Si3N4 [69,113],
SiO2 [69], MgO and LiF [114], and other oxides [36,115,116]. (Note that Ref.
113 is one of the few articles discussing composition–structure effects that may
vary with details of grain/crystal growth that can be important in some materials
such as SiC and Si3N4.)
These ceramic trends are similar to, but possibly less extreme than, those
Figure 4.21 Knoop hardness anisotropy on a (001) surface of CaF2 (A) and a
(100) surface of Al2O3 (B) (presumably at a 100 gm load) after Brookes and Bur-
1
nand [3]. (Published with the permission of the American Society of Metals.)](https://image.slidesharecdn.com/mechanical-properties-of-ceramics-and-composites-120303143122-phpapp01/85/Mechanical-properties-of-ceramics-and-composites-279-320.jpg)
![Grain Dependence of Indentation Hardness at ∼ 22°C 279
TABLE 4.3 Summary of Hardness Anisotropy of
Some Ceramic Crystalsa
H L H
Material HK (GPa) HK (GPa) H/LH
(A) NaCl Cubic Structure
NaCl 0.20 0.18 1.1
LiF 0.97–.20 0.87–0.96 1.1–1.25
MnS 1.42–1.96 1.19–1.62 1.2
MnO 2.87 2.52 1.14
MgO 8.0 4.0 2.0
TaC 16.5 15.0 1.1
ZrC 22.5 19.8 1.14
HfC 25.0 18.5 1.35
VC0.84 26.0 20.7 1.26
TiC0.80 23.0 20.0 1.15
TiC 27.5 20.2 1.36
(B) Other Cubic Structures
CaF2 1.78 1.57 1.13
Diamond 96.0 69.0 1.39
(C) Hexagonal Structures
Al2O3 18.0 14.0 1.29
Mo2C 15.8 15.4 1.02
SiC 29.5 20.3 1.45
aH
H and LH are respectively the high and low, i.e. maximum
and minimum, values for different Knoop indenter orienta-
tions on differing crystal surfaces; values in GPa. A range of
values reflects two or more differing sets of data.
Source: Ref. 3.
for metals (Table 4.4). Thus single crystal anisotropy in hardness is a basic
guide to the orientation dependence of hardness in polycrystalline bodies, but
the grain size dependence (which may vary some with at least higher levels of
preferred orientation) must be accounted for. An additional complication in the
grain size dependence of ceramic hardness is the grain-related cracking that
commonly occurs, as was extensively shown earlier. This is likely to be affected
more (mainly reduced) by increasing preferred orientation, but no data or mod-
els are available for guidance. Grain shape can also be a factor in the orientation
dependence of H, e.g. Chakraborty and Mukerji [69] showed that HV (100 gm)
on prismatic planes doubled from 20 to 40 GPa as the aspect ratio of the grains
(crystals) increased from 1 to ∼ 5 (beyond which H was ∼ constant). However,](https://image.slidesharecdn.com/mechanical-properties-of-ceramics-and-composites-120303143122-phpapp01/85/Mechanical-properties-of-ceramics-and-composites-280-320.jpg)
![280 Chapter 4
TABLE 4.4 Summary of Hardness Anisotropy of
Some Metal Crystalsa
H L H
Material HK (GPa) HK (GPa) H/LH
(A) Face Centered Cubic (FCC) Structure
Al 0.47 0.14–0.17 1.35–1.47
Cu 0.47 0.34 1.38
Ni 1.15 0.72 1.60
(B) Body Centered Cubic (BCC) Structure
Nb 0.81 0.59 1.37
V 1.03 0.79 1.30
Cr 1.39 1.08 1.47
W 4.09–4.45 3.37–3.6 1.2–1.5
(C) Hexagonal Close Packed (HCP) Structure
Zn 0.44 0.15 2.93
Mg 0.32–0.36 0.13–0.15 2.40
Ti 1.17–1.32 0.36–0.56 1.4–3.0b
Co 2.50 1.80 1.39
Zr 2.71 1.15 2.42
aH
H and LH are respectively the high and low, i.e maximum
and minimum, values for different Knoop indenter orientations
on differing crystal surfaces; values in GPa. A range of values
reflects two or more differing sets of data.
b
Most values 2.4–3.0.
Source: Ref. 3.
HV was independent of aspect ratio at ∼ 20.5 GPa. Another complication, as in
hardness itself, is load dependence of H anisotropy. Though not extensively
documented, Pajarec et al.’s data for the HK anisotropy of cubic ZrO2 crystals
shows the maximum anisotropy decreasing from 1.31 with a 0.5 N load to 1.12
at a 2 N load, indicating an increased role of slip requiring higher stress activa-
tion [36].
Note first additional sources of H anisotropy data and second studies of
Westbrook and Jorgensen [117]. The latter not only are an additional source of
data on H anisotropy of ceramic crystals but also showed that adsorbed moisture
on crystal surfaces can measurably alter their hardness values and thus also the
measured anisotropy (see also Chap. 7, Sec. II). Finally note that, besides effects
of electric fields and poling on cracks and related effects in ferroelectric and
piezoelectric materials (Chap. 2, Sec. III.I), hardness can also be affected. Thus
Park et al. [118] showed that while HK (0.25–1 N) was isotropic for both single-](https://image.slidesharecdn.com/mechanical-properties-of-ceramics-and-composites-120303143122-phpapp01/85/Mechanical-properties-of-ceramics-and-composites-281-320.jpg)
![Grain Dependence of Indentation Hardness at ∼ 22°C 281
and dense polycrystals (G ∼ 60 µm), HK with the long axis of the Knoop indenta-
tion normal to the poling direction resulted in lower H and that parallel to the
poling direction higher H (i.e. 4.42 and 4.69 GPa, which approximately straddle
the unpoled, isotropic value of 4.53 GPa). A similar anisotropy was found in sin-
gle crystals, i.e. respectively 4.06 and 4.35 GPa. Note that single crystal value is
somewhat higher than the large G polycrystalline body, which indicates that H of
BaTiO3 may not have a minimum, e.g. suggesting effects of twinning.
III. GENERAL DISCUSSION
A. Variations, Uncertainties, Consistency, and G Range of Data
The substantial data reviewed earlier clearly shows that a Petch-type, i.e. a G-1/2,
dependence of ceramic hardness occurs over the entire, or more commonly the
finer, portion of the grain size range. The deviation from a pure Petch relation
(i.e where all H values increase from those of the average crystal values in a lin-
ear fashion as a function of G-1/2) is associated with the extensive trend for a
hardness minimum at some intermediate grain size due to cracking. However,
before discussing such cracking it is useful to note variations commonly impact-
ing data, which arise to some extent from test method or more extensively from
the character of the specimen, its preparation, and its characterization.
The primary test factors, indenter type (i.e. shape) and load, which can sig-
nificantly impact H values (e.g. especially for < 500 gm loads, as is well docu-
mented), are respectively usually and commonly given, making substantial data
useful, but some of limited or no value. Loading (and unloading) rate, time, and
environment, which can have some, often varying effects, are widely neglected,
as is resultant indent character, e.g., symmetry and cracking. The latter can be a
particular problem, since irregular indents are typically discarded rather than be-
ing seen as an indication of irregularities in the sample, especially locally around
and under the indents. Such neglect can bias results toward a more favorable
rather than a true hardness evaluation. Use of recording indenters [111] should
be valuable to determine the nature and extent of effects of loading (and unload-
ing) rates, times, environment, and local variations, especially for better docu-
mentation and understanding of indent associated cracking, as was indicated
earlier. A specimen preparation factor impacting test factors is the load depen-
dence of H not only on the final surface finish but also on earlier surface finish
steps if the extent of cracking and especially surface work hardening of earlier
finishing steps are not fully removed by subsequent finishing steps [19].
The first of the more extensive specimen factors impacting hardness is
composition. Beyond the fundamental factor of the basic chemical composition
of the body, e.g. NaCl versus TiC, are variations in composition, due both to sto-
ichiometry and to other (added or accidental) constituents. Though commonly](https://image.slidesharecdn.com/mechanical-properties-of-ceramics-and-composites-120303143122-phpapp01/85/Mechanical-properties-of-ceramics-and-composites-282-320.jpg)
![282 Chapter 4
neglected, it was shown earlier that variations in stoichiometry often have their
major effects via impacts on G, e.g. B4C (Fig. 4.11). However, it appears there is
also an intrinsic effect of stoichiometry beyond that via effects on G. This is
more strongly indicated in TiC, where there is again some tendency for G to de-
crease with increasing C/Ti ratio [74]. A related compositional factor is phase
content, which can be quite important (e.g. in Si3N4, Fig. 4.13), but substantially
less in other materials, e.g. SiC.
The presence of added constituents of the same or different species of the
body can also be important, with the former being an important factor in stoi-
chiometry. Greater effects are indicated when the added constituents result in a
second phase versus being in solid solution. Thus modest effects are indicated by
solid solutions with Al2O3 [95–98], and possible greater effects from precipitates
[100], e.g. due to excess Al2O3 in MgAl2O4 precipitating out in single crystals
[101]; but much more study is needed. Similarly, effects of grain boundary
phases can be significant, e.g. as in Co bonded WC (Fig. 4.5). Note that precipi-
tation may also preferentially occur at free surfaces, as indicated in MgAl2O4
[101] and can also preferentially occur at or near grain boundaries. The above
phenomena may interact with the G dependence of H in different intrinsic and
extrinsic fashions. Thus both stoichiometric variations and second phase versus
solid solution are typically in part (nonuniquely) related to grain size due to in-
teractive effects of starting particle size and temperature on G. Totally unex-
plored is these compositional effects on hardness-related cracking and its G
dependence.
One of the major limitations of H–G data, as in all microstructural prop-
erty dependence, is microstructural characterization beyond that of composition
noted above. Basic to this is the measurement of G itself, which presents three
problems: (1) considerable H data is limited in its use because no specific G val-
ues are given, (2) besides uncertainties of factors such as grain shape, difficulties
arise due to different (often unspecified) measurement methods, and (3) conver-
sions to a “true” grain size, with both the definition of “true” and the conversion
factors commonly not being specified. A fundamental issue is that the slip aspect
of the G dependence of H would indicate use of a true three-dimensional or vol-
ume measurement of G, while the associated cracking may be more consistent
with a two-dimensional surface grain size, requiring more basic understanding.
Whether G represents an average as-measured grain diameter or a linear inter-
cept value, or such values multiplied by a factor to give a “true” three-dimen-
sional G, G values commonly have differences of 50–100% and possibly as
much as 200%. Further, some idea of the G variation, i.e., range or standard de-
viation, is not given. (Ideally, G would be measured where the indent is made.)
Similarly, limits in other microstructural characterization, e.g. of grain
shape and orientation, and of porosity and other constituents, are a probable
source of data variations. Porosity is clearly of importance (e.g. Figs. 4.2 and](https://image.slidesharecdn.com/mechanical-properties-of-ceramics-and-composites-120303143122-phpapp01/85/Mechanical-properties-of-ceramics-and-composites-283-320.jpg)
![Grain Dependence of Indentation Hardness at ∼ 22°C 283
4.5) [12,15,16] but again presents a number of problems of incomplete charac-
terization. While the amount of porosity is often given, its homogeneity, size,
and relation to the grain structure are often not given. These latter issues can be
important, since indents cover small areas, so heterogeneities in porosity can
give “bad” (typically discarded) indents, biasing results. Such problems are more
likely to occur with limited levels of porosity and medium to larger pores.
Most data is in the conventional G range of 1 micron and larger. There can
be contamination problems in obtaining dense bodies with nanoscale grains (e.g.
Chap. 3, Sec. V.A), which often get more severe as G decreases, which may be
the source of H decreasing with decreasing nanoscale G for TiAl (Fig. 4.5).
However, other bodies with such fine G are reasonably consistent with larger G
body data. This is clearly the case for WC+ 10% Co [80,81] with G down to 300
nm (Fig. 4.5) and appears consistent with TiO2 data [29,31] when corrected for
porosity. More recent data of Vaßen and Stöver [119] for SiC (mainly β) with G
down to ∼ 80 nm with limited oxide boundary impurities and > 95% theoretical
density showed HV (10 N) increasing from 23–24 GPa at G ∼ 0.3–5 µm to 24–27
GPa at G ∼ 100 nm (= 0.1 µm) and also supports continuation of H–G trends to
finer G with suitable purity and density. Their earlier data [120] covered a
broader range and clearly followed a G-1/2 dependence.
B. Basic Mechanisms of Cracking
Two closely related key issues are the H minima and related indent cracking as
a function of G. Materials of moderate to high hardness for which the most
comprehensive range of H–G data are available, e.g. Al2O3, (Figs. 4.1 and 4.2),
MgO (Fig. 4.4) , MgAl2O4 (Figs. 4.8 and 4.9), and ZnS (Fig. 4.15), almost al-
ways have an H minimum at intermediate G, e.g., in the 10–50 µm range, espe-
cially as indent load increases. Despite more limited data, this trend for H is
also indicated for hard nonoxides, e.g. TiB2 (Fig. 4.10), SiC (Fig. 4.12), and
Si3N4 (Fig. 4.13) extending the H and bonding range of the minima. Thus as G
decreases from single crystals (G = ∞), H first decreases (instead of a steady in-
crease for a simple Petch relation) and then increases with further decreasing G.
Single crystal or large G values are generally higher in comparison with inter-
mediate and often some finer G values though the single crystal values are
therefore typically obtained on only one or two low index crystallographic
planes, which usually do not represent the highest crystal H values. Such min-
ima tend to be more pronounced with higher loads, and probably Vickers vs.
Knoop indents. The occurrence and nature of such minima thus explain what
were previously seen as anomalous hardness dependence, e.g. of Armstrong, et
al.’s [8] BeO data (Fig. 4.3).
The correlation of cracking with the H minima suggests it causes the min-
ima, e.g. when G ∼ 1–3 times the indent diagonal (Table 4.2), superimposed on](https://image.slidesharecdn.com/mechanical-properties-of-ceramics-and-composites-120303143122-phpapp01/85/Mechanical-properties-of-ceramics-and-composites-284-320.jpg)
![284 Chapter 4
the normal Hall–Petch H–G-1/2 relationship based on microplasticity. Though
there is considerable variation in the scope and character of such cracking, grain
boundary fracture is dominant whenever boundaries are near the indents indicat-
ing varying (statistical) grain misorientation, residual boundary porosity, and
phases being factors. The importance of grain boundaries as well as of impurities
is clearly shown by effects of grain boundary phases known to enhance inter-
granular fracture and lower fracture energy/toughness, i.e. residues from use of
LiF in densifying some MgO and MgAl2O4 greatly enhance grain boundary frac-
turing around indents (Fig. 4.20). The broad ocurrence of such cracking over
various material types and characters, e.g. from some softer oxides to much
harder oxides and nonoxides, further reinforces the roll of cracking, again gener-
ally along grain boundaries. This correlation of cracking, especially along grain
boundaries, is reinforced by such cracking being a maximum when the indent
size is ∼ G, i.e. when indent stresses are high on local grain boundaries of larger
grains. Limited other observations support such cracking, e.g. when the indent
size was ∼ G in Al2O3 [121]. Very limited data indicates cracking occurs mainly
on loading versus unloading, consistent with the former presumably having
greater H effect; but this is another area for further research.
The importance of grain boundaries in such cracking suggests factors af-
fecting grain boundary fracture as basic material properties impacting the process.
In harder materials this suggests factors such as the degrees of elastic anisotropy
(EA) and thermal expansion anisotropy (TEA), and deformation–boundary ef-
fects. Thus the apparent absence of such cracking in Y2O3 may reflect material
property effects (e.g. as suggested by apparent avoidance of intergranular fracture
in it, Chap. 2, Sec. II.D [122]), as does the apparent absence of such cracking in
many softer materials. However, data indicates a probable absence of such crack-
ing in less refractory, much softer materials such as some halides and chalco-
genids, as might be expected from the easier and generally greater plastic flow in
softer materials. While these cannot be fully sorted out, the following evaluation
and summary in Table 4.5 provide some guidance.
Both TEA and EA are probable factors, since they can lead to considerably
varying stress concentrations at grain boundaries. TEA clearly begins at mater-
ial/body-dependent G values, and EA is believed to have similar dependences
[123], explaining the apparent absence of indent-related cracking at fine G. TEA,
which occurs only in noncubic materials and clearly commonly leads to grain
boundary fracture (Chap. 2, Sec. II.C), is probably a factor in conjunction with
local indent-induced stresses. Thus the more extreme H minima indicated for
TiB2 versus Al2O3 and BeO, which have lower TEA, suggest TEA as a factor.
However, αSiC (noncubic) has low TEA and β (cubic) SiC no TEA [121] but a
substantial H minima. On the other hand, SiC and other cubic materials, e.g.
MgO, MgAl2O4, and ZnS, all have substantial EA (as does TiB2) [124,125] and
substantial H minima indicating a nonexclusive role of TEA due to EA impact.](https://image.slidesharecdn.com/mechanical-properties-of-ceramics-and-composites-120303143122-phpapp01/85/Mechanical-properties-of-ceramics-and-composites-285-320.jpg)
![Grain Dependence of Indentation Hardness at ∼ 22°C 285
TABLE 4.5 Hardness Minima, Associated Grain Size, and Related Material
Properties
Hmina H xl/ EAb TEA
a
Material G (µm) H xl (load, kg) H min (%) (∆α max)c
KCl — 0.01 (V) — — 12 0
BaF2 — 0.7 (V) — — 0.1 0
ZnSe — 0.8 (V) — — 11.7 0
ZnS 20–30 1.8 (V) 1.4 (1-10) 0.78 8.4 0
MgF2 ? 4 (K) ? 0.4
}
MgO 12 11 (K) 9.8 (0.1) 0.89
MgO 30 8.5 (K) 7 (0.5) 0.82
2.3 0
MgO 30 10 (V) 9.2 (0.1) 0.92
MgO 25 8 (V) 5.5 (0.5) 0.69
Y2O3 — 7 (V) ? 0
BeO 100 10.8 (V) 8 (1,2) 0.74 0.4 1.1
ZrO2 50 13 (V) 11.5 (0.5) 0.88 6-10 0
}
MgAl2O4 100 14 (K) 13.5 (0.5) 0.96
MgAl2O4 5–14 13.8 (K) 9.6 (1) 0.70
7 0
MgAl2O4 60–400 14.5 (V) 14 (0.5) 0.96
MgAl2O4 20–60 14.5 (V) 13.2 (1) 0.91
}
Al2O3 50 26.6 (K) 24.5 (0.1) 0.92
Al2O3 60–100 19.7 (K) 15.8 (0.5) 0.80
1.7 0
Al2O3 — 22.8 (V) — (0.1) —
Al2O3 100 19.5 (V) 17 (0.5) 0.87
TiB2 14 32 (K) 18 (0.1) 0.56 0.5 3
α-Si3N4 18 40 (V) 36 (0.1) 0.90 ? 0.1 (β = 0.5)
SiC 10 24.5 (K) 20 (1) 0.82 7.3 0 (α - 0.4)
a
Hardnesses of xl = single crystal and min. = polycrystalline minimum, both in GPa, from
Figs. 4.1–4.15.
b
Values from Refs. 124 and 125.
c
Values from Refs 123, 126, and 127.
However, a single direct correlation with EA is questioned by the apparent ab-
sence of an H minimum in ZnSe, which has one of the highest EA levels, e.g. ∼
70% > than for ZnS. However, the lower hardness of ZnSe relative to ZnS may
enhance plasticity in ZnSe relative to ZnS to the extent that it suppresses grain
boundary cracking in ZnSe [whose strength may be controlled by microplasticity
(Fig. 3.2)] but not in ZnS. One further factor that is likely to affect such local in-
dent cracking is the anisotropy of slip itself, since fewer slip systems, i.e. greater
slip anisotropy (e.g. in MgO [6]), usually result in more stress concentration at
blocked slip bands at grain boundaries. This would also be another reason for re-
duced local cracking as G decreases below G values for the H minima. Thus four](https://image.slidesharecdn.com/mechanical-properties-of-ceramics-and-composites-120303143122-phpapp01/85/Mechanical-properties-of-ceramics-and-composites-286-320.jpg)


![5
Grain Dependence of Compressive
Strength, Wear, and Related Behavior
at ∼ 22°C
I. INTRODUCTION
This chapter addresses first the grain (mainly size) dependence of compressive
strength, primarily uniaxial, σC , but data on compressive strengths with superim-
posed hydrostatic compression is also presented. This is followed first by a re-
view of the very limited data on grain effects on ballistic, i.e. armor,
performance; then the more substantial, but still limited, data is presented first on
erosion by impacting particles and resultant body strength and then on sliding
wear. Since there are many manifestations of wear due to the variety of loading
and environmental conditions, the focus will be on basic grain effects rather than
on details of variations in wear tests and use that can occur. Then grain size ef-
fects on abrasive machining of ceramics are also discussed.
The first of two common themes among the properties considered is that
all involve substantial compressive stress with varying local tensile stresses
(which are a factor in differences between the different properties). The second
relation is that all these properties have considerable correlation with hardness,
which has some relation to elastic moduli, e.g. Young’s and bulk moduli [1,2].
The utility of these property correlations is that H is obtained by a simple test
rapidly performed on small samples at moderate cost. While this correlation is
both partly compromised by the often complex and variable dependence of hard-
ness as a function of factors such as surface finish, microstructure, and indenter
295](https://image.slidesharecdn.com/mechanical-properties-of-ceramics-and-composites-120303143122-phpapp01/85/Mechanical-properties-of-ceramics-and-composites-296-320.jpg)
![296 Chapter 5
load and configuration, it can also be an aid in sorting out similar dependences of
wear, erosion, and machining.
Consider now the basic mechanism(s) of the grain dependence of these
properties, i.e. in crystalline materials, since they are the ones having their vol-
ume nearly or fully occupied by grains. A key factor is again local plastic defor-
mation as associated with hardness indentations (Chap. 4). While there is some
uncertainty in the scope and specifics, e.g. changes and details of its occurrence
in compressive strength, erosion, wear, and machining, local plastic flow is
clearly a factor in all of these. While this is known empirically, it also stems from
similar mechanisms of these properties and hardness, since erosion, most ma-
chining, and much wear entail particles or asperities penetrating surfaces. Such
penetration causes local plastic flow and fracture similar to that involved in hard-
ness indentation (Chap. 4), which thus entail local H values and E and K values
respectively, as well as load dependence for both phenomena. While ballistic
performance entails some penetration and compressive strength does not, both
have some correlation with hardness [1–5] (hence also generally with elastic
moduli [1,2]). The correlation of these properties, especially compressive
strength, with hardness stems from the fact that hardness is a measure of the lo-
cal yield stress (Y), which for many materials obeys the simple relation Y = H/C,
where C is referred to as the constraint factor and is typically (for ceramics) 2.5
to 3 [2,6]. (Where there are significant differences in the yield stress for defor-
mation, i.e. slip or twinning systems, that do not allow general deformation, e.g.
do not represent five independent slip systems, then the values of C may be dif-
ferent [2], especially where stresses are limited, e.g. in tension. Also, in materials
such as silicate glasses and polymers, where different deformation mechanisms
may occur, their “yield” stresses also tend to scale with E [6–8]). Thus the H–σc
correlation is attributed to the yield stress ∼ H/3 being the upper limit to the com-
pressive strength of dense crystalline ceramics [3–5]. This correlation and that of
other properties to H is a factor in their G dependence, but there are variations
for each property.
While there is a basic correlation of σc with H, there are potential differ-
ences in their G dependence, as there are substantial differences and some sim-
ilarities of σc with tensile strength, σT, as shown by the general character of the
mechanisms involved. Though not documented or understood in detail, it is
now generally recognized that in well conducted compressive tests, generation
of substantial local tensile stresses occurs due to, and on the scale of, the mi-
crostructure, especially pores and probably grains, and second phase particles
or regions. These local tensile stresses generate and grow cracks but at higher
stresses than in tensile testing since the individual cracks are typically semi-
stable in the macro compressive stress field. The high stresses reached allow
microplastic processes to generate cracks, and possibly contribute some to
their stability, growth, or both, thus providing the basis for correlation with H.](https://image.slidesharecdn.com/mechanical-properties-of-ceramics-and-composites-120303143122-phpapp01/85/Mechanical-properties-of-ceramics-and-composites-297-320.jpg)
![Grain Dependence of Comprehensive Strength, Wear 297
Further, while ultimate compressive failure is typically somewhat explosive due
to the high stored elastic energy of the high stresses involved, the local, stable
tensile cracking leads to cumulative failure, as opposed to much more immediate
catastrophic failure from rapid growth of a single crack in tensile loading. Thus
compressive failure is seen as the progressive generation, growth, and coales-
cence of small, initially micro, cracks, generated and grown by local tensile
stresses due to stress heterogeneities, microplastic processes, or both, culminat-
ing in brittle failure, e.g. as indicated by acoustic emission [5,9–13]. These
processes are the probable source of the G dependence of σc and the similarities
and differences of its G dependence versus those of H and tensile strength, since
these entail respectively more concentrated local deformation, cracking, or both
and a lesser role of larger scale propagation of single cracks. Also, the load de-
pendence of H and its local cracking appear to be sources of differences in the G
dependences of H and σc, e.g. higher load H values are probably more pertinent,
but H minima from local surface cracking probably have limited or no perti-
nence. Note also that there are various parasitic effects, e.g. end crushing or
cracking due to end strain incompatibilities between loading and specimen sur-
faces, that can lead to premature compressive failure in testing and may vary
with G.
The field of ballistic impact on ceramic materials is complicated first by com-
plexities of the process and second by the fact that many of the test results are clas-
sified because of the important application to military armor [14,15]. Complexities
of the process arise most fundamentally from the speed and resultant very high
strain rates of the process that is typically controlled by shock wave phenomena that
alter or preclude more normal mechanical behavior. Further complexities arise since
there are various types of projectile threats that involve different degrees or types of
various mechanisms, with each impacted by how well the ceramic is packaged in
terms of both backing as well as, mainly for the most demanding applications, side
and frontal containment of the ceramic. However, there is one basic aspect of the
process that is clear, namely that there are two basic stages in what happens to the
ceramic. The first stage, which is the key one in defeating the projectile, is the gen-
eration and initial propagation of a compressive shock wave from the projectile im-
pact as both the projectile and the ceramic armor under it are shattered into fine
fragments. The second stage is the propagation of the compressive stress wave
through the ceramic to its boundaries where it reflects as a tensile stress wave that
causes much further damage in the ceramic, which is a dominant factor in the extent
to which there may be some second hit capability of the remaining ceramic in stop-
ping a second projectile. Projectile penetration is defeated by erosion and fragmen-
tation of the receding penetrator nose by the multitude of ceramic microfragments
through which the projectile moves.
Erosive wear also generally correlates with hardness and its G dependence
as well as via indentation cracking effects from the particle impacts. Though not](https://image.slidesharecdn.com/mechanical-properties-of-ceramics-and-composites-120303143122-phpapp01/85/Mechanical-properties-of-ceramics-and-composites-298-320.jpg)
![298 Chapter 5
directly modeled, such G dependence can in principle be at least approximately
obtained from empirical or analytical models via their dependence on underlying
physical properties such as K and H, e.g. an empirical model for the erosive wear
rate of ceramics (WE ) from particle impact gives [16]
WE ∝ v0dReρfKgHh (5.1)
where v0 = particle initial velocity, R = particle radius, ρ = particle density, and
K and H are local values of fracture toughness and hardness of the body being
eroded. For two models the exponents have respective values of d = 3.2 or 2.4,
e = 3.7 (for both), f = 1.3 or 1.2, g = -1.3 (for both), and h = -1.25 or + 0.11.
Thus the G dependence of WE is reflected in the G dependence of fracture
toughness and hardness to the extent that they are suitably accurate in reflecting
the material behavior over the G regime of interest. A review of these models
revealed that while they generally approximately fit data, there were discrepan-
cies, mainly greater than predicted dependence on H and K, which were attrib-
uted to microstructural aspects of erosion not being adequately accounted for in
the models [16].
Similarly, modeling of the introduction of cracks from sharp indentations
has been used as a basis of modeling particle impact damage, wear processes,
and material removal processes in abrasive machining. Resultant models for the
resultant crack size, c, give [17]
2/3
F E 1/ 2
c ∝ (5.2)
K H
where F = the load on the indenter or abrasive particle and E, K, and H are local,
not necessarily global, values of Young's modulus, toughness, and hardness. The
G dependence of the resultant crack size arises via effect of H and K since E nor-
mally does not depend on G.
Wear is even more complex because of the broader diversity of phenom-
ena involved, which typically include varying mixes of indent fracture from as-
perities or abrasive particles, plastic flow (locally around indentations and in thin
surface layers), and chemical reaction. Effects of these phenomena are further
varied by frictional, e.g. stick–slip and heating, effects. A partial separation of
wear behavior is between abrasive and sliding wear, the former involving more
indentation fracture and the latter more frictional and chemical effects.
While the penetration of individual erosive or abrasive particles or of indi-
vidual wear surface asperities would indicate the use of load-dependent H values
reflecting similar penetration, there is substantial uncertainty in this due to both
multiple and varying asperities in wear processes, and generation of new, rough
surface in wear, erosion, and machining versus a single uniform indentation on a](https://image.slidesharecdn.com/mechanical-properties-of-ceramics-and-composites-120303143122-phpapp01/85/Mechanical-properties-of-ceramics-and-composites-299-320.jpg)
![Grain Dependence of Comprehensive Strength, Wear 299
fixed surface for hardness measurements. Even greater uncertainty exists for the
pertinent K values, since in wear, erosion, and machining, the crack scale will
typically be much smaller than for normal fracture toughness testing, the larger
scale of the latter being a major factor in significant variations in K–G relations
(Chap. 2). Local temperature and environmental effects add further uncertainty.
While the diversity of wear presents challenges, it generally reflects im-
portant G dependences stemming from not only correlations with H but also in-
dent-fracture and plastic deformation, as well as possible K–G dependence.
Though such G dependence can depend on grain boundary character and grain
size (and its distribution), shape, and orientation, it may aid in sorting out the
varying mechanisms and is clearly important in developing, selecting, and ap-
plying wear resistant ceramics.
The subsequent sections review the G dependence of the above properties
in the order: compressive strength, ballistic performance (briefly in view of very
limited data) and erosion, wear, and machining. (No data on grain shape and ori-
entation are known.) This review provides a more comprehensive data base and
perspective on the G dependence of these properties (complementing and ex-
tending more limited earlier surveys of their G dependence [3,4,18]. This review
also clearly shows the critical need for more study, especially of a more compre-
hensive nature.
II. GRAIN DEPENDENCE OF COMPRESSIVE STRENGTH
A. Grain Size Dependence
Four previous surveys of the G dependence of compressive strength of ceram-
ics [3–5,18] provide the background for much of the following review, which
addresses first compressive strength without superimposed confining stresses
and then with such stresses. Much, especially earlier, data is for bodies with
some to substantial porosity, especially at finer grain sizes, thus requiring cor-
rection of compressive strengths to P = 0, e.g. as extensively discussed else-
where [1] to expand the limited data base. However, despite the limited data
base, there is a fairly clear G dependence consistent with expectations based
on earlier reviews.
Limited data of Alliegro [18,19] for hot pressed ZrB2 (P∼ 0.01–0.09)
clearly show, even with no or conservative P correction, substantial σc levels
with a simple linear decrease as a function of G-1/2 extrapolating to substantial
values at G-1/2 = 0, i.e. for single crystals (Fig. 5.1). Data for similarly hot
pressed TiB2 of Alliegro [18,19], (corrected for P = 0–0.11, mostly ≤ 0.05),
though of more limited G range, indicate similar G dependence, but at some-
what higher σc levels (> 2 GPa) and is consistent with the one data point of
Mandorf and Hartwig (extrapolated to P = 0) [20]. Other data for TiB2 + 20%](https://image.slidesharecdn.com/mechanical-properties-of-ceramics-and-composites-120303143122-phpapp01/85/Mechanical-properties-of-ceramics-and-composites-300-320.jpg)
![300 Chapter 5
FIGURE 5.1 Compressive strength versus G -1/2 for ZrB2 [19], TiB2 [19,20], and
WC + 10 w/o CoO [23], and cubic BN (cBN) [24] at ∼ 22°C. Note the high strength
levels relative to those for tensile strength, and that despite these values being
low relative to theoretical expectations, they clearly show substantial G depen-
dence; also that some data points reflect more than one test, e.g ∼ 5 for cubic BN.
(From Ref. 3, published with the permission of Plenum Press.)
SiC was reported to be > 3 GPa for G = 5–10 µm [21], but more recent tests of
pure hot pressed TiB2, G∼ 10 µm, giving σc = 5.7 ± 0.2 GPa, are seen as closely
approaching the theoretical compressive strength [14,15,22]. Theoretical com-
pressive strength is commonly taken as ∼ E/10 or H/3, the former not being load
dependent, but not reflecting any G dependence, which is at least partly re-
flected in H/3 (where H should probably be at higher loads where there is little
load dependence, but not reflecting surface cracking effects).
Data for WC + 11 w/o Co with little or no porosity reported by Exner and
Gurland [23] shows very similar G dependence, but at somewhat higher σc lev-
els. Data of Tracy and colleagues [14,15,22] for hot pressed (G∼ 1 µm and sin-
tered (∼ 4 G µm) SiC also indicates some G dependence, since the former had σc](https://image.slidesharecdn.com/mechanical-properties-of-ceramics-and-composites-120303143122-phpapp01/85/Mechanical-properties-of-ceramics-and-composites-301-320.jpg)
![Grain Dependence of Comprehensive Strength, Wear 301
FIGURE 5.2 Compressive strength versus G -1/2 for 94% alumina [4,26], higher
purity aluminas [3], and sapphire (stressed perpendicular and parallel with the c-
axis) [27], and from a more recent test a commercial 94% alumina [22,28], along
with data for UO2 polycrystals [30] and single crystals [31] at ∼ 22°C.
∼ 6.3 and the latter ∼ 4.6 GPa, though respective percent porosities of 1–2 and
3–4 are a factor in this difference. Data of Vereshchagin et al. [24] on cubic BN
is limited but clearly indicates a Petch relation. B4C data of Osipov et al. [25]
shows similar behavior but is bilinear, i.e. very similar to their tensile strength
behavior (Fig. 3.1) but with higher slopes and compressive strengths ∼ 3 times
tensile strengths. The bilinear character and low multiple of compressive versus
tensile strength are consistent, i.e. serious parasitic tensile stresses are the likely
source of both, as are the lower strength levels and scatter in much of the other
compressive strength data.](https://image.slidesharecdn.com/mechanical-properties-of-ceramics-and-composites-120303143122-phpapp01/85/Mechanical-properties-of-ceramics-and-composites-302-320.jpg)
![302 Chapter 5
There is more extensive data for Al2O3. Earlier data of Floyd [4,26] for
commercial 94 and 96% alumina bodies, both as-produced and with added heat
treatment to increase G (which also decreased density some) clearly showed a G
dependence of their compressive strengths that closely paralleled that of their H.
Strengths were somewhat higher for 96 versus 94% alumina as expected, and
Floyd’s tests on the same bodies in flexure clearly showed less G dependence of
tensile versus compressive strengths (especially for tensile strengths of the finer
G branch, Chap. 3), which is also shown by comparing the G dependence of both
strengths for other ceramics). More limited data on mostly purer, e.g. 99.9% alu-
mina bodies, gives higher strengths, which are approached when the 94 and 96%
alumina bodies’ strengths are corrected for limited porosity and silicate-based
glass content. Tests of Tracy et al. [22,28] on 94% alumina are seen as closely
approaching the theoretical compressive strength (again taken as H/3 or E/10 as
noted earlier) for such a body of 3.4 ± 0.2 GPa. These higher strengths are also
consistent with their probable extrapolation between the compressive failure
stresses of ∼ 4.2 and 2.1 GPa for sapphire tested respectively with the stress axis
parallel and normal to the c-axis [27]. Castaing et al. [29] showed apparent yield
of sapphire at compressive stresses of ∼ 6 GPa normal to the c-axis with 1.5 GPa
confining pressure and a strain rate of 2 × 10⁻⁵/s but noted that this was due to de-
layed fracture from creep rupture at 25°C, not dislocation glide till test tempera-
tures ≥ 200°C.
The limited compressive strength data for ThO2 of Knudsen [32] and of
Curtis and Johnson [33] corrected for porosity shows a substantial linear trend as
a function of G-1/2 and a substantial extrapolation of ∼ 1.4 GPa at G-1/2 = 0 [3].
Similarly, UO2 data of Burdick and Parker [30] and Igata et al. [31] extrapolates
to ∼ 0.7 GPa at G-1/2 = 0, consistent with Igata et al.’s compressive strength of
∼ 0.7 GPa for UO2 crystals. The implication of plastic flow in compressive fail-
ure by the extrapolation of polycrystalline compressive strengths to those of sin-
gle crystals is reinforced by observation of slip in UO2 by Yust and Hargue [34].
Paterson and Weaver [35] measured compressive strengths of three MgO bodies
of G ∼ (1) 10–15 µm (P ∼ 0), hot pressed with 3% LiF and then annealed at
1300°C, (2) 30 µm, isopressed and sintered at 1700°C, P = 0.03, and (3)
300–500 µm, core drilled from skull melted ingots. Recognizing that their finest
G body had lower strength (attributed to residue from the LIF addition) than
their two remaining data points for the intermediate and large grains showed
some measurable decrease in σC as G increased, and on extrapolation to G = ∞.
The latter is consistent with it being ∼ the yield stress for single crystals stressed
in the <111> direction, i.e. ∼ 0.4 GPa versus that for <100> stressing ∼ 0.15 GPa
of Copley and Pask [36].
Paterson and Weaver [35] also measured compressive strengths of the
same three above MgO bodies at 22°C, but with superimposed hydrostatic pres-
sure (Fig. 5.3). They used two different types of rubber jackets to prevent fluid](https://image.slidesharecdn.com/mechanical-properties-of-ceramics-and-composites-120303143122-phpapp01/85/Mechanical-properties-of-ceramics-and-composites-303-320.jpg)
![Grain Dependence of Comprehensive Strength, Wear 303
FIGURE 5.3 Compressive strength of MgO versus G-1/2 at 22°C with superim-
posed hydrostatic compressive stresses of 0 (i.e. none), 0.2, 0.5, 0.8, and 1 GPa
from Paterson and Weaver [35] and Auten and Radcliffe [37] along with single
crystal yield stresses (hence ∼ compressive strengths) of Copley and Pask [36]
for <100> and <111> stress axes.
intrusion into cracks, with some differing effects of the two jacket materials. All
tests with the application of such pressure showed higher G dependence of σC,
with higher values for extrapolation to G = ∞ for the two highest confining
pressures. (Note that the finer G specimens, those made with LiF, are much
more consistent with values for the other bodies made without LiF in contrast to
tests with no confining pressure.) Auten and Radcliffe [37] also measured com-
pressive strengths of one polycrystalline MgO material (G ∼ 30 µm) prepared
very similarly to that of Paterson and Weaver’s intermediate G body, but con-
ducted their tests without a rubber jacket on the samples. As shown in Fig. 5.3,](https://image.slidesharecdn.com/mechanical-properties-of-ceramics-and-composites-120303143122-phpapp01/85/Mechanical-properties-of-ceramics-and-composites-304-320.jpg)
![304 Chapter 5
FIGURE 5.4 Compressive strength and hardness, HV(9.8 N) at ∼ 22°C for dense
(< 3% porosity) AlN sintered with different amounts and types of oxide sintering
aids [43]. Note that compressive tests used dumbbell specimens after Tracy and
were conducted at three strain rates (the highest and lowest rates are shown)
with all showing strength increasing as G decreased and strain rate increased.
Also note the similar trend for hardness and its being ∼ 3 times compressive
strength.
their results showed very similar trends with confining pressure but were some-
what higher in fracture or yield stress.
Extrapolation of the polycrystalline data to G = ∞ falls between the values
of Copley and Pask [36] for MgO single crystals stressed in <100> and <111>
directions but closer to the substantially higher value for yield/fracture in the
<111> direction as expected. Both Weaver and Patterson [38] and Auten et al.
[39] measured compressive strengths of MgO single crystals at 22°C along
<100> loading axes as a function of confining pressure using respectively rubber
jackets and no jackets. Both obtained compressive strengths with substantial sin-](https://image.slidesharecdn.com/mechanical-properties-of-ceramics-and-composites-120303143122-phpapp01/85/Mechanical-properties-of-ceramics-and-composites-305-320.jpg)
![Grain Dependence of Comprehensive Strength, Wear 305
gle crystal deformation. Patterson and Weaver’s values for jacketed samples
were ∼ 120 MPa without confining pressure and increasing, mostly modestly,
with increasing pressure. Auten et al.’s values for unjacketed samples were ∼ 80
MPa without confining pressure and decreased modestly with increasing pres-
sure. However, the averages of these two sets of tests were ∼ independent of con-
fining pressure and agreed fairly well with values of Copley and Pask. (Auten et
al. noted that a probable reason for their lower results was surface cracking and
resultant loss of surface chips without jackets versus such cracking and espe-
cially loss of surface chips being constrained with jackets on the specimens.)
Limited data of Brace [3,40,41] for nominally single phase limestone
(CaCO3) and dolomite (CaCO3 + MgCO3) follows a G-1/2 dependence and paral-
lels his data for high load hardness (both using the maximum rather than the av-
erage G (Fig. 4.14) [3]. Fredrich and Evans [42], besides reviewing the limited
compressive data and models for rocks as a function of G (generally showing
Petch-type behavior), also presented their own data for four marble limestones
with G from ∼ 6–1800 µm, which also clearly followed a Petch relation. They
further showed that tests with confining pressures of 5 or 10 MPa resulted in es-
sentially the same relation, except for a possible upward shift of the data by a
few percent as the confining pressure increased.
Finally consider more recent AlN data of Rafaniello [43], which over a
limited G range (∼ 2+ to 12 µm) showed a substantial decrease with increasing G
consistent with a G-1/2 dependence (Fig. 5.4). Note that compressive strength in-
creased with increasing strain rate, which was corroborated by tests at 0.6 sec-1
being in between the two sets of results in Fig. 5.4 but closer to those for the
lowest strain rate.
B. Other Microstructural and Testing Effects, H Correlation, and
Failure Mechanisms
No data specifically on effects of grain shape or orientation on compressive
strength is known. However, the correlation of σC and H, and the substantial data
on the dependence of H on crystal orientation, provide guidance, as does limited
data on effects of grain shape on indentation fracture (Chap. 4, Sec. II.E). There
is also limited single crystal data, e.g. that for sapphire compressively stressed
parallel or normal to the c-axis (Fig. 5.2). There are also some theoretical esti-
mates of some, e.g. diamond structure, crystals that provide some guidance, such
as that of Nelson and Rouff [44] predicting theoretical strengths of diamond of
1.8 GPa for [100] loading and 4.1–4.8 GPa for [111] loading.
The first of two important loading parameters not addressed in the above
review is strain rate. The limited data has been reviewed by Lankford [45,46]
along with presenting his own data for sintered, nearly dense SiC (G∼ 3 µm) and
dense sintered Al2O3 (G ~ 25 µm). He showed that there was an ∼ 30% increase](https://image.slidesharecdn.com/mechanical-properties-of-ceramics-and-composites-120303143122-phpapp01/85/Mechanical-properties-of-ceramics-and-composites-306-320.jpg)
![306 Chapter 5
in compressive failure strength of Al2O3 over the strain rate range of ∼ 10-5 to >
102 sec-1, while there was none for SiC. He observed that in both materials mi-
crocrack nucleation appeared to be athermal. While strain rate effects on slip and
probably twin deformation are typically thermally activated, this may not always
be true at high strain rates, so further study is needed. Lankford also showed a
marked rate of increase in compressive strengths at strain rates > 102 sec-1 indi-
cating a fundamental change in mechanism for both materials for which there is
some theoretical basis in inertial effects on crack initiation and propagation. He
noted that extrapolation of the high strain rate increase in compressive strengths
indicates reaching theoretical strengths (∼ E/10) at rates of ≥ 106 sec-1.
The issue of loading rate also raises the issue of possible environmental ef-
fects, especially of slow crack growth, particularly due to moisture. Lankford
[10] reported that the strain rate dependence of the compressive strength in his
testing of (Lucalox) Al2O3 corresponded to n values for slow crack growth for
tensile strength, i.e. values of ∼ 50 (hence implying a G dependence per Fig.
2.7A). He subsequently noted similar correspondence of compressive and tensile
slow crack growth in SiC and Si3N4, but not in Mg PSZ [12]. Similarly Nash [47]
reported that a 97.5% and a 99.7% alumina (both noted as having average G of a
few microns) showed reductions of σC from respectively ∼ 1.7 and 2.2 GPa to
∼ 1.2 and 1.5–1.7 GPa in air and Ringer’s solution (and other water-based solu-
tions for the 99.7 body) in testing at a strain rate of 0.55 × 10⁻³/sec. However,
Ewart and Suresh [48] ruled out environmental effects in their studies of com-
pressive fatigue crack propagation in Al2O3.
While slow crack growth must be considered in view of the local nucle-
ation, growth, and coalescence of microcracks under local tensile stresses, there
are two sets of issues that raise serious questions about such growth in true com-
pressive failure. The first is the uncertainties in n values in crack propagation un-
der macro tensile stresses, in particular the indicated significant G dependence
(Fig. 2.7A). This for example raises the question of whether there is a similar G
dependence in compression and whether the tensile n values used for compari-
son have sufficiently similar G values for adequate comparison. The second and
more fundamental question is that of the extent and time of environmental access
to the crack tips. While crack propagation of a single surface connected crack al-
lows ready access of the test environment to the crack tip, in well conducted
tests, compressive failure is seen as a process of cumulative nucleation, growth,
and coalescence of microcracks throughout the bulk of the sample. Thus over
much of this process many, probably most, microcracks are not accessible by the
environment over much of the stage of the compressive failure process. This
raises the question of how effective the environment can be in the probably lim-
ited portion of the failure process during which it has considerable access into
the sample and the crack tips. On the other hand, in less well conducted com-
pressive tests, local tensile stresses, e.g. often from end constraints, commonly](https://image.slidesharecdn.com/mechanical-properties-of-ceramics-and-composites-120303143122-phpapp01/85/Mechanical-properties-of-ceramics-and-composites-307-320.jpg)
![Grain Dependence of Comprehensive Strength, Wear 307
result in “compressive” failure due to propagation of one or a few surface con-
nected cracks. Clearly both the surface connected and commonly resultant
macro nature of these cracks and their dependence on substantial parasitic tensile
stresses provide much more opportunity for environmental effects on their
growth and the resultant reduced “compressive” strength. This probable role of
such surface connected cracks also raises the issue of whether there is a speci-
men size effect on compressive failure, since many microcracks appear to form
at the surface, which could allow them to grow preferentially in from the surface.
Thus what might start as a true compressive failure could become dominated by
cracks propagating in from the surface, but with this being increasingly favored
as specimen size decreases. This basic issue of the extent of intrinsic versus ex-
trinsic environmental effects on compressive failure is an important scientific is-
sue. However, it is also potentially a very important one in the engineering
design of ceramic components for substantial compressive loading, since such
loading is likely to be plagued by more parasitic tensile stresses than in most
compressive testing. Another complication in considering environmental effects
on compressive strength is the possibility that the fluids involved may act as lu-
bricants in addition to, or instead of, environmental effects, since crack friction is
seen as playing an important role in compressive strengths.
The second stressing aspect to consider is repeated loading, i.e. compres-
sive fatigue. While this has been studied substantially less than tensile fatigue
(with very limited attention to grain effects in both), there is some limited
guidance mainly in a review by Suresh [49] and especially tests by Ewart and
Suresh [48]. They studied cyclical fatigue crack growth from machined
notches in two high-purity Al2O3 bodies (AD 995 and 999 with respective G of
∼ 18 and 3 µm) and one orientation of sapphire. The latter resulted in no stable
crack propagation, while the two polycrystalline bodies showed similar overall
crack growth characteristics, but the finer G material required ∼ 50% higher
compressive stress for stable crack propagation, i.e. consistent with higher
compressive strengths at finer G. (Note that they observed an enhanced extent
of crack propagation near the machined surfaces pertinent to the issue of sur-
face and related finishing effects on crack propagation discussed in Chap. 2,
Sec. III.B.) The absence of stable crack propagation in sapphire versus stable
propagation in the polycrystalline bodies via almost exclusively intergranular
fracture shows that such crack propagation in polycrystalline bodies is clearly
associated with grain boundaries, and it further questions conventional slow
crack growth (which occurs with tensile loading in sapphire, Chap. 2, Sec.
III.B) in compressive loading. They concluded that large compressive stresses
induce inelastic deformation in the vicinity of notch roots that can result in
residual tensile stresses at the notch tip due to permanent strains left upon un-
loading. They saw their results as not necessarily being consistent with mi-
croplasticity as a mechanism of compressive failure and saw probable](https://image.slidesharecdn.com/mechanical-properties-of-ceramics-and-composites-120303143122-phpapp01/85/Mechanical-properties-of-ceramics-and-composites-308-320.jpg)
![308 Chapter 5
contributions of TEA stress and crack face friction effects (but did not consider
possible effects of EA).
Before considering mechanisms and correlations, consider variations in
compressive strength values. Though almost never, or never, used, Weibull mod-
uli are as pertinent to compressive as to tensile strengths (as they are not only to
other mechanical and nonmechanical properties but also to microstructural para-
meters such as grain size, shape, and orientation). While Weibull moduli (m) val-
ues have not been directly measured, compressive strength data of Tracy and
colleagues [15,22], besides generally being the most free of serious parasitic
stresses, also commonly made several, typically 10, measurements for each ma-
terial, thus providing reasonable data to calculate m values via Eq. (3.4). As
shown in Table 5.1, Weibull moduli calculated for σC (mC) roughly follow trends
for tensile moduli (mT) they directly measured for flexural strengths, σT, but with
mC > mT by ∼ 40–400%. While 10 tests per material is a limited data base on
which to calculate m values, the consistency of mC being > mT , and the fact that
higher mC than mT values were found across six materials indicates a trend that is
highly probable. The higher moduli in compressive failure are consistent with
expectations of Weibull moduli being less sensitive to microstructural hetero-
geneities in compressive loading than in tensile loading, but the differences may
be limited by the greater G dependence of σC versus that of σT.
Consider now the correlation of hardness and compressive strength. Rice,
in his review of ceramic compressive strength [3], showed that it correlated with
hardness, i.e. the upper limit was typically H/3 (Fig. 5.5), though other constraint
factors than three may occur, as also discussed by Lankford [5]. Deviations be-
low this limit were attributed to, roughly in order of decreasing scope, impact, or
both, (1) frequent and often substantial parasitic stresses in testing, (2) material
defects and heterogeneity, and (3) other, lower stress mechanisms of failure, e.g.
twinning. Lankford accepted this H correlation and further documented and ex-
tended it. A summary of results shown in Fig. 5.6 clearly shows that (1) more re-
cent results from generally better conducted tests, often with denser specimens,
TABLE 5.1 Comparison of Weibull Moduli for Flexure (Tensile, m T) and
Compressive (mc) Failure of Ceramicsa
Material mT mc Material mT mc
Al2O3 (94%) — SiC-S 10.8 14
TiB2-HP 29 41 SiC-HP 9.6 31
B4C-HP 5.2 18 Al2O3/SiCw 5.1 25
a
mT values measured in studies published by Tracy and colleagues [15,22], while mc values
were calculated from their compressive strength data per Eq. (3.4). HP = hot pressed, S =
sintered, and SiCw = a SiC whisker composite.](https://image.slidesharecdn.com/mechanical-properties-of-ceramics-and-composites-120303143122-phpapp01/85/Mechanical-properties-of-ceramics-and-composites-309-320.jpg)
![Grain Dependence of Comprehensive Strength, Wear 309
FIGURE 5.5 Compressive strength versus H/3 for various ceramics from a survey
of Rice (previously unpublished) from a variety of sources, including Patterson
and Weaver [35] (circular points).
give a generally closer approach of σC to H/3, and that (2) data for bodies tested
with superimposed hydrostatic loads commonly equal or exceed H/3 as the hy-
drostatic pressure increases. Data of Bairamashvili et al. [51] on hot pressed
B4C, B6O, and SiB4 with P ∼ 0.1–0.04 and G ∼ 1–3 µm may also support the
H–σC correlation, since it appears that their σC values may be shown as 10 times
their true value. If this is the case, their respective values of σC for the above re-
spective order for the materials versus those of the corresponding H/3 values (in
parentheses for H with 1–2 N load) are 7.9 (11.7), 6.3 (10.7), and 5.0 (9.0). This
correlation of σC with H/3 and the typical association of H/3 with the general
yield stress of a material is a strong indicator of yielding as a basic mechanism
controlling compressive strength in well conducted tests of samples of reason-
able to good quality.
The σC–H correlation is quite suggestive, but it does not fully prove a mi-
croplastic mechanism of failure (discussed further below.) Thus the correlation
with H may reflect more basic correlations with elastic moduli in general [1,2],
and shear modulus specifically, e.g the theoretical compressive strength limit](https://image.slidesharecdn.com/mechanical-properties-of-ceramics-and-composites-120303143122-phpapp01/85/Mechanical-properties-of-ceramics-and-composites-310-320.jpg)
![310 Chapter 5
FIGURE 5.6 Compressive strength versus H/3 for various ceramics from better
conducted tests with and without superimposed hydrostatic stress levels (shown
in GPa) at 22°C. (Data from Refs. 5,14,15,22,28,50.)
being ∼ 80% of the shear moduli for [111] loading of crystals of Ge, Si, and di-
amond [44]. Further, the substantially increased data, especially for the G de-
pendence of H, also raises some questions, and the load and indenter shape
dependence of H raises the issue of what H values are appropriate. While higher
load H values appear more appropriate, as noted earlier, there are uncertainties
regarding which indenter shape is more pertinent, e.g. possibly Vickers over
Knoop, but with the merits of spherical indenters relative to these unknown.
Further, the use of any indenter geometry at a fixed load means that the resultant
indents are changing in the number of grains involved as G (or the G range) of a
given sample changes, raising the issue of to what extent such changing grain-
to-microplastic-zone size ratios in measuring H correspond to such ratios of
possible microplasticity in compressive failure. There are also issues raised by
the σC–G data that do not appear to correlate well in detail with H–G data, e.g.
though limited, the σC–G data shows no evidence of σC minima at any interme-
diate G, as H often does. Most likely the H minimum found in more compre-](https://image.slidesharecdn.com/mechanical-properties-of-ceramics-and-composites-120303143122-phpapp01/85/Mechanical-properties-of-ceramics-and-composites-311-320.jpg)
![Grain Dependence of Comprehensive Strength, Wear 311
hensive H testing of a number of ceramics is not directly pertinent to compres-
sive failure, since this entails free surface cracking versus bulk, i.e. much more
constrained, cracking in compressive failure (though the possible mechanisms
of generating the surface cracking–spalling in H testing may be pertinent, as is
discussed below). However, neglecting the H minimum exacerbates another
possible problem in detailed correlation of H–G and σC–G data, namely that
σC–G data often shows more change over the same G range than does H. Thus
while there is a very useful general correlation between H and σC, the specifics
of the mechanisms and their impact on the correlation through factors such as
the G dependences of H and σC are uncertain.
Consider now the evidence for microcrack formation and coalescence as
the basic mechanism of compressive failure. Though again the data is generally
limited, there is considerable support for such cracking, mainly from four
sources, but very limited information on most details, which are generally im-
portant. The first source is extensive modeling showing that compressive loading
results in cracks parallel with the applied uniaxial stress initiating from pores
(see Adams and Sines [52] and Sammis and Ashby [53]). The second source is
direct observation of such cracks from both large artificial pores in glass [53] and
fine natural pores in relatively dense polycrystalline ceramics such as Al2O3 [9]
and SiC [11]. Further and very important is direct observation of individual
cracks or reduced transparency of single crystals of MgO and Al2O3 [29,38,39].
The third source is acoustic emission data, e.g. as for the previous Al2O3 [9] and
SiC [11]. While some emission may be from other sources, much of it, e.g. of
Nash [47], is highly likely to reflect cracking. The fourth source is interrupted
compressive loading followed by subsequent tensile loading normal to the origi-
nal compressive loading axis by Sines and Taira [54]. They did such testing on a
commercial Al2O3, reaction bonded SiC, and HIPed Si3N4 and showed that such
compressive loading prior to tensile testing in the normal direction resulted in
the onset of tensile strength degradation with prior compressive loading above ∼
40% of the compressive strength and further degradation approaching zero ten-
sile strength at ∼ double the level of compressive loading relative to the ultimate
compressive strength in Al2O3 and SiC, which had porosity and coarser mi-
crostructures. However, no degradation from such prior compressive loading
was found in the nominally pore free, finer G Si3N4 tested. Thus there is consid-
erable data showing microcracking from compressive loading, but much remains
to be determined about the specifics of the onset, growth, and coalescence of
such cracking. It is also important to recognize that the extent and cause(s) of
such crack processes may change with material, microstructure, loading, and
temperature. Another indication of crack generation during compressive stress-
ing is the results of Stucke and Wronski [55] showing progressive reductions in
tensile (flexure) strength as superimposed hydrostatic pressure on three MgO,
two Al2O3, and one UO2 bodies was increased.](https://image.slidesharecdn.com/mechanical-properties-of-ceramics-and-composites-120303143122-phpapp01/85/Mechanical-properties-of-ceramics-and-composites-312-320.jpg)
![312 Chapter 5
Turning to the mechanism of microcrack generation, growth, and coales-
cence, it is highly probable that there are multiple mechanisms with varying con-
tributions as a function of which stage of compressive failure is being addressed
and what the material, microstructure, and loading conditions are. While microc-
racking from pores is clearly an important source, there must be other sources of
microcracks for two reasons. First, similar compressive strength behavior is seen
for ceramics with little or no porosity and those with more substantial porosity,
e.g. between sintered and hot pressed Al2O3, but corrected to P = 0. The second
is the extrapolation of polycrystalline compressive strengths with little or no
porosity, or corrected to zero porosity, to the range of single crystal compressive
strengths, e.g. for UO2 and Al2O3 (Fig. 5.2). For other mechanisms of generating
microcracks than from pores it is logical to consider the same candidate mecha-
nisms as for indent-related cracking and resultant H minima due to cracking
from deformation, especially slip anisotropy, and TEA and EA stresses. Clearly
there are important differences between the two microcracking situations, i.e. in-
dent cracking is mostly or exclusively surface connected and occurs at or near
the edge of the zone of ∼ hydrostatic compression, while compressive microc-
racking occurs in conjunction with local tensile stresses in an overall compres-
sive stress field. The latter is the logical cause of compressive microcracking
presumably occurring at much higher stresses. TEA and EA are clearly possible
sources of microcracks, since they can result in significantly increased local
stress that could exceed the local stress for nucleation of microcracks. Some or
all of the G dependence of compressive strengths would thus be due to the prob-
able G dependence of such microcracking from TEA and EA [56,57]. Note that
the stress concentrations due to EA can be substantial, e.g. commonly to 1.5–3
[58]. However, it varies substantially not only with the degree of EA but also in-
teractively and significantly with grain shape, i.e. aspect ratio, and with the ori-
entation of the grain elongation relative to both the stress axis and the relation of
the grains or regions of them with higher versus lower local elastic moduli from
the EA per modeling by Hasselman [58].
While EA and TEA are highly probable factors in compressive micro-
cracking, it is likely that microplastic deformation due to slip, twinning, or both
is also a factor for several reasons. These include the clear occurrence of slip at
similar stress levels under indenters, the implications of yielding at ∼ H/3, and
the correlation of this with σC. Another indicator of plasticity is the G depen-
dence of σC following a Petch relation and thus correlating with single crystal
behavior where there is no TEA or EA. While some might argue that the Petch
relation is misleading, as it was for the finer G branch for tensile strengths (Fig.
3.1), it should be noted that there is no clear evidence for a larger G branch for
σC as for tensile strength, and stresses for σC are much more consistent with
those for plastic deformation than those of the finer G branch for tensile strength.
Two other important, but widely neglected, factors are the transitions from fail-](https://image.slidesharecdn.com/mechanical-properties-of-ceramics-and-composites-120303143122-phpapp01/85/Mechanical-properties-of-ceramics-and-composites-313-320.jpg)
![Grain Dependence of Comprehensive Strength, Wear 313
ure with no to substantial supporting hydrostatic pressure and the changes in H
and especially σC with modest differences in temperature (Chap. 6).
Additional support for plasticity as an important factor in compressive fail-
ure is provided by specific observations. While Nash’s transgranular fracture
mode of what is probably rhombohedrahl cleavage in Al2O3 may be evidence of
twinning, his TEM observations of twins, along with some of the substantial
acoustic emission he observed probably being from twinning, are reasonable in-
dicators of twinning in Al2O3 [47]. An important observation is the demonstra-
tion of deformation accompanying compressive testing of Al2O3, MgO, and UO2
crystals, as well as considerable evidence of this in polycrystalline MgO. An-
other is Lankford’s observation of crack initiation by blockage of slip or twin
bands or both in compressive, as well as tensile, stressing of dense sintered Al2O3
[9,10], and both microscopic and macroscopic evidence of plastic deformation in
compressive testing of PSZ bodies, including a clear yield point and substantial
subsequent plastic strain [12,13]. While it is legitimately argued that each of
these is to some extent a special case, they clearly show that plasticity can occur
in compressive failure. More importantly, they show that there are different op-
tions for plasticity in ceramics at these stress levels, which is a reminder that
thinking of a single mechanism is probably an inappropriate and simplistic ap-
proach. Further, the extent of compressive plasticity in the MgO and especially
PSZ cases clearly implies that other cases of progressively less plasticity are
likely to occur and be a factor.
It should also be noted that some of the arguments raised against microplas-
ticity by some are at best uncertain. Thus the argument that common intergranular
fracture in compressive failure or crack propagation is contrary to microplasticity
is on shaky grounds, since slip and twinning, while sometimes leading to trans-
granular fracture, result in intergranular fracture e.g. in Al2O3 [9,10] and MgO
(Chap. 3, Sec. III). Wiederhorn et al.’s [59] observation via transmission electron
microscopy (TEM) that there are no dislocations associated with tips of cracks in-
troduced into Al2O3 by indents or thermal shock is of uncertain applicability.
These observations are most likely of the tips of arrested cracks rather than of
their initiation, thus showing only that crack growth and arrest was not associated
with slip at or near the arrested crack tips. Further, the argument that such TEM is
necessary to confirm the role of plasticity in compressive failure is potentially
misleading, since it neglects the issue of the number and scale of microcrack nu-
clei that may be needed, especially for earlier stages of ultimate compressive fail-
ure, and the feasibility of finding these by TEM. Thus, for example, crack
nucleation due to blockage of one slip or twin band at the boundary with an adja-
cent grain occurring at one in a thousand grains may well be a substantial num-
ber of crack nuclei in a body, but they clearly provide a very low probability of
suitable detection by TEM. It is much more logical to recognize that there is prob-
ably a substantial range of plastic contributions, many on a very modest scale, so](https://image.slidesharecdn.com/mechanical-properties-of-ceramics-and-composites-120303143122-phpapp01/85/Mechanical-properties-of-ceramics-and-composites-314-320.jpg)
![314 Chapter 5
a variety of self-consistent tests and evaluations are needed to address this issue.
Such more comprehensive evaluations should preferably entail testing of a vari-
ety of materials, with a variety of microstructures, loading conditions, test tem-
peratures, and associated evaluations, e.g. acoustic emission, microscopies, and
radiography.
III. BALLISTIC STOPPING CAPABILITIES OF CERAMIC
ARMOR, GRAIN AND OTHER DEPENDENCE
Ceramics are often used as armor against bullets and other, often heavier, projec-
tiles, since they typically have the best stopping power, especially as a function
of weight. As noted earlier, much of the physics of failure in such impact
regimes is different from that of conventional failure due to the much high load-
ing rates of such impact. This commonly occurs at rates that exceed the speed of
sound in both the impacting and the impacted bodies, so stresses propagate in
both as shock waves, since the normal elastic distribution of stress is exceeded,
which means that any portion of the target does not experience stress until the
shock wave reaches it. Again, the initial shock wave is compressive and then be-
comes tensile on reflection from the ceramic surfaces, with the latter causing
much of the fracturing, e.g. the typical “spider web” crack pattern with normal
bullets and granulation from special armor piercing (i.e. long rod, kinetic energy)
projectiles after the projectile has been destroyed.
At the low end of projectiles in terms of size, hardness, and velocities there
are limited tests indicating some improved stopping power as G decreases and
purity increases in alumina bodies. Thus tests by Ferguson and Rice [60] on alu-
mina bodies of varying G and purity, with limited or no porosity (including sap-
phire, showed some G dependence, especially in less pure bodies (Fig. 5.7).
While these tests were with smaller, softer projectiles (nonarmor piercing, that
were used to simulate energetic metal fragments), they have some value as a
starting point.
Rafaniello’s [43] .30 caliber AP data for dense sintered AlN, though scat-
tered, clearly also shows that ballistic stopping ability, i.e. ballistic limit velocity,
decreases as G increases (Fig. 5.8). However, his data for .50 caliber AP stopping
ability (using depth of penetration into the Al backing material as the measure of
this) is more widely scattered and is at best only somewhat suggestive of de-
creasing stopping ability as G decreases. The apparent progressive decrease in
the clarity, extent, or both of stopping ability increasing as G decreases for the
above .22, .30, and .50 caliber tests is consistent with even less indication of G
effects against heavier projectile threats. Thus as one proceeds progressively to
more serious projectiles ranging from .30 and .50 caliber to various types of ar-
mor piercing projectiles that differ greatly in density, hardness (e.g. of W or
WC), size, and velocity (e.g. ≤ 1000 versus to 2000 m/s) [14,15], correlation](https://image.slidesharecdn.com/mechanical-properties-of-ceramics-and-composites-120303143122-phpapp01/85/Mechanical-properties-of-ceramics-and-composites-315-320.jpg)
![Grain Dependence of Comprehensive Strength, Wear 315
FIGURE 5.7 Ballistic limit velocity (i.e. the velocity at which half the projectiles
penetrate the target and half fail to do so) normalized by the areal density of the
target (i.e. the weight per unit area) versus the inverse square root of grain size
(G) for tests of various alumina bodies at ∼ 22°C with high power .22-caliber duc-
tile bullets used to simulate fragment stopping capabilities of armor. Note the two
lines, the upper one for pure alumina bodies (including sapphire) and the lower
one for less pure aluminas (i.e. with less stopping ability). (From Ref. 60, pub-
lished with the permission of Plenum Press.)
with G reduces significantly. This changes material rankings; B4C is commonly
the most weight efficient ceramic armor against .30 and .50 caliber bullets, but it
is less effective against more severe armor piercing projectiles.
While the specifics of the material properties and hence microstructures
that determine the range of behavior, especially stopping different armor pierc-
ing projectiles, are not fully understood, there are some guidelines [14,15]. The
first and most fundamental one is that ballistic projectile stopping power is prob-
ably dependent on more than one property and changes with the nature of the
projectile, so microstructural needs probably change. Second, properties control-
ling normal tensile fracture, i.e. fracture toughness and tensile strength, have no
positive correlation, and some have negative correlations, with armor perfor-
mance. For example, grain boundary phases that often increase fracture tough-
ness by enhancing intergranular fracture and crack bridging and branching (at](https://image.slidesharecdn.com/mechanical-properties-of-ceramics-and-composites-120303143122-phpapp01/85/Mechanical-properties-of-ceramics-and-composites-316-320.jpg)
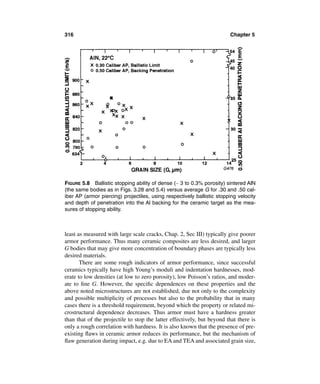
![Grain Dependence of Comprehensive Strength, Wear 317
shape, and orientation, is unknown. The negative effects of preexisting flaws
suggest correlation with Weibull moduli, e.g. some possible rough correlation
with such tensile moduli has been noted [14,15]. However, while there is no
clear correlation with even well measured compressive strengths, it seems more
likely that such moduli for compressive failure, which roughly correlate with
tensile moduli (Table 5.1), may be better candidates to reflect flaw density. Thus
there are likely to be useful correlations of properties and their microstructural
dependences that can benefit ceramic armor selection and fabrication, but they
must require balances between various factors, as was noted above, with the bal-
ances probably shifting with the nature of the ballistic threat. Further testing of
microstructural factors, as addressed in Figs. 5.7 and 5.8, with progressively
higher-velocity and harder threats, with the recognition that various and chang-
ing property correlations are involved, seems needed. While hardness and com-
pressive strength correlations suggest a possible dependence on grain size, i.e.
better ballistic performance, hence “stopping power,” at finer G, there are many
uncertainties and very few tests (especially in the unclassified literature).
Finally it should be noted that while there has been little study of plastic
flow in ballistic impact on ceramics, there is clear evidence of substantial plastic
flow in the debris near the impact zone. Given the complexity of the ballistic im-
pact, including its very short duration and multiple interactions, there is uncer-
tainty as to the extent to which the post-failure tensile shock wave contributes to
this. However, the observed yielding under shock wave conditions, i.e. the
Hugoniot Elastic Limit [10], indicates that such yielding is an important factor in
ballistic stopping power.
IV. GRAIN DEPENDENCE OF EROSION WEAR AND
RESIDUAL CERAMIC STRENGTH
Consider now the grain dependence of both erosion due to impact of particles on
the surfaces of ceramics and the resultant ceramic strength. There is substantial
interest in the effects of solid particles because erosive wear by them is an im-
portant issue in many applications components, e.g. potentially in engines where
particles are ingested or generated, or in equipment to use streams of abrasive
particles, e.g. grit blast nozzles. However, high-velocity impacts of liquid, espe-
cially rain, drops are also important for some aircraft and especially missile com-
ponents, particularly microwave and IR windows and domes. Effects of the
impacts of solid particles or liquid drops is a complex subject, but considerable
modeling and testing has taken place to give at least partial insight into the
mechanisms and parameter dependences. While, as is unfortunately very com-
mon, issues of microstructural, e.g. grain size, effects on erosion and induced
damage of impacted bodies have received limited attention, there is some infor-
mation on grain effects.](https://image.slidesharecdn.com/mechanical-properties-of-ceramics-and-composites-120303143122-phpapp01/85/Mechanical-properties-of-ceramics-and-composites-318-320.jpg)
![318 Chapter 5
Consider first more general information on particle erosion, especially the
general correlation of increasing H with increasing erosion resistance, or con-
versely increasing rates of erosion with decreasing H. As part of their particle
erosion studies of ceramics (which are among the most extensive), Wada and
Watanabe [61] showed that the erosion rate was inversely proportional to the ra-
tio of the hardness of the impacted surface to that of the impacting particle, i.e. a
linear dependence on a log–log plot. Similarly, others have shown correlations of
erosion with H, e.g. of the onset of serious rain erosion with the hardness of the
impacted ceramic [16,62,63]. Both the correlation of erosion with H and the gen-
erally recognized increase of H as G decreases suggest reduced erosion as G de-
creases, as did qualitative observations of lower erosion at finer G, e.g. of Wada
and Watanabe [61] in Si3N4.
Consider now the limited experimental data on G dependence of particle
erosion of ceramic surfaces. A study of SiC erosion using Al2O3 particles
(37–270 µm dia.) at velocities of ∼ 108 m/s by Routbort and Scattergood [64]
provided some direct indication of a grain size effect. They showed that the
erosion rate of reaction bonded (RB) SiC (i.e. with large G, P∼ 0, and excess
Si) progressively increased substantially as the size of the impacting particle
increased, as expected from theory. However, similar tests of hot pressed SiC
(G∼ 2–4 µm), while being ∼ consistent with their RB SiC at small particle
sizes, progressively deviated to less erosion as the size of the eroding alumina
particles increased, with erosion rates for the largest alumina particles being <
for the finer particles, i.e. contrary to all models. They noted however that the
damage zone sizes for single particle impacts was ∼ 0.2–0.3 times the particle
size for normal incidence, so the finer impacting particles created damage on
the scale of individual grains, while larger impacting particles created damage
zones covering more grains as the particle size increased. These observations
were supported by their fractography showing that whole grains were often re-
moved. The implication is that erosion is a function of grain size, with possible
maxima of erosion when the damage zone and G are ∼ equal, i.e. similar to the
conditions for H minima as a function of G.
More quantitative data on the G dependence, though not a focus of the
substantial study of Wiederhorn and Hockey [16], can be extracted from it. They
measured the erosion rate (mass loss of a variety of ceramics using 150 µm SiC
abrasive particles carried at controllable velocities by injection of a particle
stream into an air stream normal to the specimen flat surface. While their data
shows general correlations of erosion rates with inverse functions of hardness
and fracture toughness per Eq. (5.1), they made measurements on two dense,
pure polycrystalline bodies, a sintered one (G∼ 30 µm) and a hot pressed one
(G∼ 3-4 µm), as well as on a {1 11} surface of sapphire. Their data was used to
0
obtain the erosion resistance (the reciprocal of the erosion rate), which has been
here normalized by dividing all resistance values by that for sapphire under the](https://image.slidesharecdn.com/mechanical-properties-of-ceramics-and-composites-120303143122-phpapp01/85/Mechanical-properties-of-ceramics-and-composites-319-320.jpg)
![Grain Dependence of Comprehensive Strength, Wear 319
specified conditions (allowing direct comparison of data at their three test tem-
peratures of 25, 500, and 1000°C). Plotting this normalized erosion resistance
versus G-1/2 for their various particle velocities (37–125 m/s) and test tempera-
tures shows that all data follows the same trend as a function of G (Fig. 5.9).
Breder and Giannakopoulos [65] conducted a narrower study of particle
erosion (and subsequent target strength, discussed below), focusing on five com-
mercial alumina bodies, all ≥ 99.5% purity except for a 90% alumina (with the
second finest G of ∼ 4 µm). They utilized four grit sizes of SiC particles having
average diameters of 360, 460, 550, and 1300 µm and employed a slinger arm to
generate particle velocities of 37–106 m/s at normal incidence. An equation sim-
ilar to that considered by Wiederhorn and Hockey [16] was modified to allow for
a variable toughness due to varying extents of R-curve behavior by introducing
various weightings of a parameter m in each exponent in Eq. (5.1) such that for
m = 0 the toughness was constant, i.e. independent of crack size as in the original
models. They showed, using such a modified equation based on inclusion of
their parameter m in the exponents, that there was no correlation of erosion with
R-curve behavior based on analysis of the slopes of log–log plots of eroded vol-
ume (V ) versus the kinetic energy of the eroding particles (U). However, they
FIGURE 5.9 Relative erosion of sapphire and two dense polycrystalline bodies
versus the inverse square root of the grain size (G) for the various temperatures
and particle velocities shown (at the right of each line in m/s). (Data from Ref. 16.)](https://image.slidesharecdn.com/mechanical-properties-of-ceramics-and-composites-120303143122-phpapp01/85/Mechanical-properties-of-ceramics-and-composites-320-320.jpg)
![320 Chapter 5
did not attempt any correlations of erosion with the grain structure, which pro-
gressed from the above two finer G bodies to ones of 17, 22, and 38 µm (the lat-
ter reflecting a bimodal grain structure averaging ∼ 8 and 60 µm). In further
analysis of their data for indications of a G dependence, this author found none
for the slopes of their V–U curves or of their toughness values but did find a def-
inite correlation of their calculated m values and G. Thus their m values progres-
sively decreased from 0.33 at the largest average G to values of 0.28 and 0.22 for
G ∼ 22 and 17 µm respectively, and m = 0.16 and 0.08 respectively at G ∼ 2 and
∼ 4 µm. The lowest m value at G ∼ 4 µm might suggest a minimum, but this low
value likely reflects the impact of the ∼ 10% glass content of the 90% alumina
body. The exact meaning of the above correlation is uncertain, but it clearly
serves as a reminder that neglect of grain structure in analysis of data can be a se-
rious limitation on understanding. Routbort and Matzke [66] similarly noted ap-
parent failure of available models to reflect accurately the microstructural effects
in their study of erosion of various SiC bodies.
The above study of Wiederhorn and Hockey, which includes data for sap-
phire specimens, illustrates the value of single crystal tests in general and espe-
cially for studying effects of grain structure. Data of mainly Rickerby and
Macmillan [67,68] provides useful detailed studies of MgO crystal erosion. Un-
fortunately there is limited direct comparison of these studies with their study
of a polycrystalline MgO body [69], though some differences are indicated, but
their crystal data provides a basis for future comparisons. Similarly, data of
Schoun and Subramanian [70] on single crystals of LiF, NaCl, KCl, and CaF2
and of Routbort et al. [71] on crystals of Si provide an opportunity for compari-
son to polycrystalline erosion and hence added insight into effects of grain
structure.
Consider now the effects of erosion of ceramic surfaces on the resultant
strengths of the eroded specimens tested with the eroded surface as the tensile
surface in uniaxial or biaxial flexure (the latter for disk or plate samples). Ritter
[72,73] has evaluated the residual strength after erosion of the same five com-
mercial alumina bodies studied by Breder and Giannakopoulos [65], apparently
using the same apparatus, SiC abrasive particle sizes, and velocity range. Biaxial
flexure strengths of eroded and uneroded specimens, the latter with Vickers in-
dents, mainly with 100 N loads, showed that large grain size bodies gave rise to
crack resistance and resultant increased resistance to indent and erosion induced
strength loss. This was based on using a similar analysis to that of Breder and
Giannakopoulos to allow for variable toughness, but in an equation predicting
residual strength rather than erosion rates based on the same underlying inden-
tation–crack concepts giving higher m values, since m correlated very similarly
for both indented and eroded strengths as for the erosion rate, as noted earlier.
However, the actual strengths of both indented and eroded disks were highest at
intermediate G (∼ 17 µm), not at the maximum G, i.e. clearly differing from](https://image.slidesharecdn.com/mechanical-properties-of-ceramics-and-composites-120303143122-phpapp01/85/Mechanical-properties-of-ceramics-and-composites-321-320.jpg)
![Grain Dependence of Comprehensive Strength, Wear 321
both the normal σT–G trend (Fig. 3.1) and the predicted strength trend. Further
confusion arises since Breder and Giannakopoulos concluded that R-curve ef-
fects were not operative in the erosion of these alumina bodies under the same
test conditions. Whether enhanced material removal occurs when the impact
crater is ∼ G is unknown. Similar comparison was made using three commercial
Si3N4 bodies [74], which, though more limited in the range of finer G values and
complicated by bimodal grain structures, showed a similar trend for m to in-
crease with G at finer G.
Besides the obvious very limited data on, and especially attention to, G ef-
fects on erosion and resultant strengths, there are two sets of issues that need to
be noted for further attention. The first set is microstructural, i.e. not only G, but
its variations along with grain shape and orientation. While the effects of G have
been barely addressed, the other grain parameters have not been addressed at all.
As for other properties, single crystal data provides insight to the limits of grain
orientation effects, but such crystal data is very limited for erosion and appar-
ently nonexistent for residual strengths from erosion.
Turning to other erosion studies, there can be added complexity. For indi-
vidual particle impacts there may be a material-dependent velocity threshold for
the onset of strength reduction [75]. For multiple particle impacts, erosion may
not decrease strengths, and in some cases erosion can actually increase strengths.
Thus Wada et al. [76] and subsequently Chakraverti and Rice [77,78] showed
that abrasive grit blasting can measurably increase resultant strengths of TZP
materials. This may be seen as an isolated case due to transformation toughen-
ing, which in part it is (e.g. PSZ bodies also show greater erosion resistance rela-
tive to their hardness, at least partly correlating with their higher relative
toughness). However, Gulden [80] reported that while RBSN eroded with vari-
ous size and velocity quartz particles had reduced strengths, such erosion of a
commercial sintered 95% alumina and especially a commercial hot pressed
Si3N4 showed a probable increase in strength. Similarly Laugier [81] eroded sur-
faces of a sialon, Al2O3 + 4 wt% ZrO2, and an Al2O3 + TiN +TiC cutting tool bod-
ies with Al2O3 grits and then measured fracture toughness via Vickers indents in
the as-eroded surfaces and after polishing various depths of material from the
eroded surfaces. He reports that all three materials showed substantially in-
creased toughness in the eroded surfaces, e.g. respectively nearly fivefold, about
fourfold, and nearly fourfold. However, the increased toughness rapidly dimin-
ished as material was removed from the eroded surface, implying that the sur-
face toughening was due to a fairly shallow layer (e.g. ∼ 20–40 µm) of
compressive stress (e.g. from impact generated slip).
In addition to the complications of the absence of strength degradation, or
more seriously strength improvements as a result of surface erosion, there are
more general issues. These include the transition from a few to many impacts,
i.e. from isolated impacts and damage areas to overlapping impacts, damage ar-](https://image.slidesharecdn.com/mechanical-properties-of-ceramics-and-composites-120303143122-phpapp01/85/Mechanical-properties-of-ceramics-and-composites-322-320.jpg)
![322 Chapter 5
eas, or both, which has been only partially addressed. There is also the issue of
environmental effects on both erosion and subsequent strengths. While strain
rates in impact loading may limit effects of environment, there may still be envi-
ronmental effects in play due to residual stresses, and in subsequent strength test-
ing. The possible G dependence of such environmental effects (Fig. 2.7) is an
added complication that needs to be addressed in a broader evaluation of G ef-
fects. Finally, there is a serious need better to evaluate the nature of erosive im-
pact damage and its impact on both erosion and resultant strengths in terms of
the nature of the cracks, their scale and character relative to the grain size, and
the relevance of macro crack propagation tests to such cracking. Thus impact
cracks are as complex or more complex than many indent cracks, consisting of
various combinations, natures, and extents of cone, lateral, and median cracks.
While such more complex crack patterns are likely to reduce somewhat the
stress intensity on the resultant crack that propagates, e.g. in a post erosion
strength test, there is at best a very uncertain and probably limited relation be-
tween the effect of such stress intensity reduction and toughness increases due to
crack bridging and branching in large scale crack propagation. The latter have
commonly been indirectly asserted via assumed contributions of R-curve effects,
but the issues of both crack scale and their nature (as just noted) need to be rec-
ognized and objectively evaluated.
V. GRAIN DEPENDENCE OF WEAR AND MACHINING
A. Grain Dependence of Scratch Hardness and Abrasive Wear
Two of the common methods of studying wear are its direct study by various
tests of two bodies against one another and by simulating the effects of a single
abrasive particle or surface asperity impressed into and translated over the test
surface under varying conditions. The grain effects on the former test are dis-
cussed in the following section and the latter, which is based on scratch hardness
testing, is the subject of this section.
Wu et al. [82] conducted scratch hardness tests as a function of G for sev-
eral ceramics using a conical diamond point with an included angle of 90° and a
tip radius of ∼ 15 µm with loads of 0.5, 1, and 1.5 kg on the tip as the specimen
is rotated under it at ∼ 0.1 cm/s to make a circle ∼ 1 cm diameter. Such tests are
referred to as diamond pin-on-disk (DPOD) tests. The wear (W) was taken as the
average of the wear track cross-sectional area in planes normal to the wear sur-
face; the reciprocal (1/W), i.e. the wear resistance, was plotted versus G-1/2, since
this is analogous to such plots of indentation hardness. Data for dense hot
pressed polycrystalline Al2O3 of various grain sizes down to ∼ 3 µm was all be-
low the data for sapphire (Fig. 5.10), which may indicate effects of grain bound-
aries and related TEA and EA stresses. Subsequent results for a commercial 85%](https://image.slidesharecdn.com/mechanical-properties-of-ceramics-and-composites-120303143122-phpapp01/85/Mechanical-properties-of-ceramics-and-composites-323-320.jpg)
![Grain Dependence of Comprehensive Strength, Wear 323
FIGURE 5.10 Diamond pin-on-disk scratch tests of hot pressed and an 85% com-
mercial alumina (P-85) Al2O3, as well as three orientations of sapphire with a 0.5
kg load and for Taber wear tests of two similar aluminas at 1000 and 2000 revolu-
tions. Note that both tests clearly show wear resistance decreasing as G in-
creases and that the DPOD results are not only well below the sapphire data but
also extrapolate to a negative intercept at G -1/2 = 0. (From Refs. 82, 83, published
with the permission of Ceramic Engineering and Science Proceedings.)
alumina [83] agreed reasonably well with the hot pressed data. The polycrys-
talline data clearly showed substantial decrease in wear resistance as G in-
creases, not only extrapolating well below those for three orientations of
sapphire but also to a negative intercept at G-1/2 = 0. This suggests that it has a
distinct minimum similar to, but probably more extreme than for, indentation
hardness (e.g. Figs. 4.1,4.2).
Wu et al. [84] also made DPOD tests on several commercial SiC bodies of
varying additive amount and type, and frequently with substantial G ranges,
again plotting 1/W versus G-1/2. Their HV (0.5 kg load) showed similar trends
with their DPOD data at 0.5 and 1 kg (Fig. 5.11). Both the DPOD tests extrapo-
late to positive intercepts at G-1/2 = 0, but the 1 kg load tests cover a reduced
range of 1/W. Both 1/W and HV plots indicate that in bodies with substantial
ranges of grain sizes, their wear behavior is more consistent with data for bodies](https://image.slidesharecdn.com/mechanical-properties-of-ceramics-and-composites-120303143122-phpapp01/85/Mechanical-properties-of-ceramics-and-composites-324-320.jpg)
![324 Chapter 5
FIGURE 5.11 Plot of HV (0.5 kg load) and the reciprocal of the DPOD wear (0.5
and 1 kg loads) versus G -1/2 for the same set of commercial SiC bodies. Note that
both sets of 0.5 kg data extrapolate to positive intercepts at G -1/2 = 0, that the 1 kg
data is consistent with this despite its compression, and that data for bodies with
wide G ranges agree with other data toward or at their larger G values. (After Wu
et al. [84], published with the permission of Ceramic Engineering and Science
Proceedings.)
with narrower G ranges when plotted versus the larger G values, i.e. the larger G
values dominate such wear behavior.
Wu et al. [82] also made DPOD tests on (1) various hot pressed MgO bod-
ies along with data on a {100} MgO crystal surface, (2) various experimental
and commercial PSZ and TZP bodies (all with Y2O3 partial stabilization, except
two with MgO) and on ∼ {110} surfaces of crystals with 20 and 12 wt% Y2O3,
and (3 mostly dense MgAl2O bodies and {100}, {110}, and {111} surfaces of
stoichiometric crystals (Fig. 5.12). Again plots of 1/W versus G-1/2 all showed
1/W decreasing as G increased, with many polycrystalline values substantially
below single crystal values and extrapolating near, or below, the lower end of the
single crystal values. Again, there was compression of the range of wear resis-
tance at higher loads, so polycrystalline values tended to extrapolate closer to](https://image.slidesharecdn.com/mechanical-properties-of-ceramics-and-composites-120303143122-phpapp01/85/Mechanical-properties-of-ceramics-and-composites-325-320.jpg)
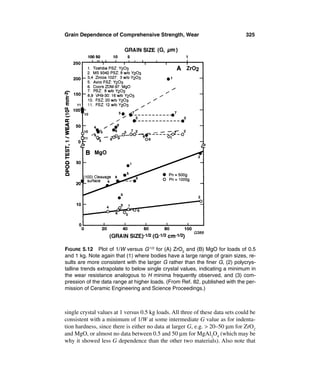
![326 Chapter 5
TABLE 5.2 Diamond POD Wear of Various Nonoxide Ceramics of Varying
Grain Sizes at Three Loads
Diamond POD wear track cross-sectional
Grain
area (m)2 loads
Ceramic Fabri- size
(∼ H)a cationb (G, µm) 0.5 kg 1 kg 1.5 kg
AlN [12] S 6±1 0.06 ± 0.02 0.18 ± 0.06 0.28 ± 0.15
HP 8±3 0.08 ± 0.1 0.18 ± 0.1 0.26 ± 0.15
HP 16 ± 3 0.08 ± 0.07 0.30 ± 0.20 0.59 ± 0.25
Si3N4 [18]c HPd 0.5 — 2.3 ± 0.6 21 ± 2
HP 1.3 — 20 ± 3 48 ± 3
HP 15 — 7±2 45 ± 7
TiC [26] HP 16 8.7 ± 0.9 22 ± 5 39 ± 5
TiB2 [23] HP 0.9 6.7 ± 1.2 24 ± 5 51 ± 12
S 6 11 ± 2 25 ± 5 51 ± 12
S 120 5.8 ± 1.2 52 ± 27 138 ± 75
a
Approximate HV (500 gm load) values.
b
S = sintered, HP = hot pressed, all to low, e.g. ~ 0, porosity.
c
NC 132.
Source: Ref. 82.
separate DPOD and HV tests of ZrO2 crystals as a function of Y2O3 content indi-
cate that both are essentially independent of Y2O3 content until it gets below 5
w/o, i.e. where significant monoclinic content begins to appear, in which case H
progressively decreases and wear substantially increases [82].
More limited data of Wu et al. [83] from their DPOD tests on various
nonoxide materials of low to ∼ zero porosity, though scattered some, also shows
a general trend for increased wear (i.e. decreased wear resistance) as G increased
(Table 5.2). Scatter is attributed to factors such as residual porosity, hetero-
geneities of additive distribution (and possibly to some extent the type and
amount of additive), and variations in grain structure. One important example of
this was the observation of significant relic structure from spray drying in a
sialon body. Microcracking, which is another source of higher wear rates, is sus-
pected in the large G TiB2.
An important question regarding such scratch tests is how similar or dif-
ferent they are relative to both indentation hardness (Chap. 4) and other wear
tests (considered in the next section). Scratch tests are very similar to indent
tests in that a tip, commonly a sharp one, is pressed into the surface to make an
impression, but in the scratch hardness test the tip must also plow through the
material in order to make its track. Direct comparison of both tests is feasible
by plotting scratch hardness versus HV at the same loads on the same or similar
materials and surface finishes for various ceramics for the same G (e.g. for G](https://image.slidesharecdn.com/mechanical-properties-of-ceramics-and-composites-120303143122-phpapp01/85/Mechanical-properties-of-ceramics-and-composites-327-320.jpg)
![Grain Dependence of Comprehensive Strength, Wear 327
∼ 15 µm) where there is more data [82–84]. This comparison shows there is a
general correspondence between the two tests, as might be expected, but with
two sets of deviations. The first and most obvious was two materials having
much higher scratch hardness versus HV than the other materials, i.e. Si3N4 and
especially AlN. Some difference might be expected, since while indent tests
have varying extents of interactions with grain structure and hence with grain
boundaries (Chap. 4), scratch tests inherently have more such interaction. Thus
where impressions in either test are smaller than the grain size, the indent test
will reflect more limited effect of the grain structure, while the scratch test is
literally forced into successive grains and resultant broader interaction with the
grain structure. The combination of the wear track character (considered next),
and the fact that fracture is often a more serious source of wear, suggest that
the deviations of Si3N4 and especially AlN are due to greater plastic flow. The
second difference between indent and scratch tests is that while most materials
compared in the two tests show reasonable correlation, this correlation is not
constant as a function of G, since variations decrease as load increases. Thus
comparison at another G result in different scatter, slopes, or both, as is also in-
dicated by the two tests generally having different slopes as a function of G,
which is again consistent with more interaction of scratch tests with the grain
structure.
SEM examination of the wear tracks showed a broad trend for the track
surface to fall in the range from a relatively smooth surface, with some undula-
tions and striations parallel with the track at fine G, to more, or exclusively,
fractured surface, usually with substantial to exclusive intergranular fracture at
larger G (Figs. 5.13,5.14). The smoother surfaces with striations are typically
interpreted as evidence of plastic flow. A frequent intermediate step between
striations and fracture is the occurrence of partial, then complete, approximately
periodic transverse interruptions of the smooth striated track surfaces as G, or
other parameters presumably enhancing stick–slip conditions, increases, which
again indicates plastic flow. The occurrence of plastic flow is supported by
TEM studies of wear and abraded surfaces, e.g. Hockey et al. [86]. Though not
directly studied, the intergranular fracture mode appears to commence at a finer
G and be more complete at larger G and in bodies with weaker grain boundary
phases, as is probably true for both MgO (Fig. 5.13) and MgAl2O4 (Fig. 5.14).
Further support for the indications of plastic flow in such track formation and
its role in limiting wear rates, and fracture enhancing them, is the greater extent,
smoothness, and persistence to larger G in bodies showing lower wear, e.g.
Si3N4 and AlN.
Mukhopadhyay and Mai [87] did similar scratch tests on three sintered,
dense, pure alumina bodies [G = 0.7, 5, and 25 µm, having HV (500 gm load) of
19, 16, and 11 GPa] using a conical diamond with a 100 µm tip radius with loads
of 8–40 N. Tangential forces increased with load but were mixed as a function of](https://image.slidesharecdn.com/mechanical-properties-of-ceramics-and-composites-120303143122-phpapp01/85/Mechanical-properties-of-ceramics-and-composites-328-320.jpg)

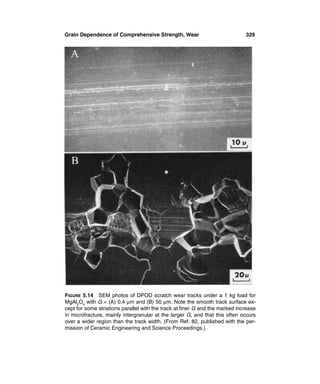
![330 Chapter 5
G, except for a distinctly higher rate of increase with load for the finest G body at
higher load for two passes versus one pass of the diamond tip. Friction coeffi-
cients tended to decrease with increasing load, more so for two passes versus one
pass, except again for the finest G body, where friction markedly increased with
load. Groove widths increased with both load and G, and wear rate initially in-
creased rapidly and then more slowly or not at all as load increased with signifi-
cant G dependence. The finest G body had the greatest changes in, but the
lowest, wear rate, and the two larger G bodies, lower rates of increase (and only
at lower loads) with overall higher wear rates, i.e. the intermediate G body had
nearly, and the largest G body over, an order of magnitude higher wear rate.
Track examination showed that the finest G wear appeared to be mainly plastic
deformation to ∼ 10 N loads, which then transitioned to mixed plastic deforma-
tion and intergranular fracture above 10 N, while the two larger G bodies, espe-
cially the largest G body, was mainly controlled by inter- and transgranular
fracture. They noted that their results did not support the concept of material re-
moval by joining of lateral and radial cracks based on indentation fracture and
attributed the substantial G dependence to a combination of the G dependence of
H and TEA stress effects.
Xu and colleagues [88–90] conducted similar scratch tests, i.e. using a con-
ical diamond tip with an included angle of 120° and a tip radius of ∼ 10 µm under
loads of 10–40 N (i.e. 1–4 kg) on dense sintered Al2O3 bodies of G = 3, 9, 15, 21,
and 35 µm. They reported scratch hardness values with 10 and 40 N loads de-
creasing from ∼ 25 to ∼ 21.5 GPa as G increased from 3 to 9 µm, i.e. similar rela-
tive changes as found by Wu et al. [82]. Xu et al.’s [89] scratch hardness data for
G 15–35 µm was presented as then being constant at ∼ 21 GPa, but their data
would also suggests a possible minimum at ∼ 20 GPa at G = 21 µm. Though scat-
tered, some their data indicated values ∼ 5% lower for 40 versus 10 N loads.
The scratch wear track results of Xu and colleagues [88–90] generally
corroborate and extend those of Wu et al. [82], e.g. increasing intergranular mi-
crofracture as G increases, and provide very useful additional information, e.g.
showing slip or twin bands, or both, involved in both the wear track forming
process and the microfracture process. They showed that for single scratches
the volume of removed material increased as the square of G (Fig. 5.15), and
that the net volume of material removed in sequentially forming two parallel
scratches was distinctly dependent on G. This G dependence resulted from,
first, the extent of lateral damage due to cracking increasing as G increased due
to its increasingly extending beyond the width of the indenter diameter at the
specimen surface and, secondly, the interactions of this lateral cracking as a
function of the separation of two parallel scratches. Thus they clearly showed
that there were critical scratch separation distances for the onset and maximum
of interaction to enhance material removal by microfacture that increased with
both load and G. They showed that the scratch separation for the onset of inter-](https://image.slidesharecdn.com/mechanical-properties-of-ceramics-and-composites-120303143122-phpapp01/85/Mechanical-properties-of-ceramics-and-composites-331-320.jpg)
![Grain Dependence of Comprehensive Strength, Wear 331
FIGURE 5.15 Plot of the volume material removed versus the grain size (G)
squared for dense sintered alumina bodies with a 20 N load on the scratch inden-
ter tip. (Data from Ref. 90, published with the permission of the Journal of the
American Ceramic Society.)
action was ∼ 3+ times G and that for maximum interaction was ∼ 2- times at a
20 N load, with the scratch separations for these interactions increasing linearly
with grain size (Fig. 5.16). (The G multiples are not totally constant for the on-
set and maximum interaction, since the plots of scratch separations for these in-
teraction stages versus G do not go through the origin.) The material volume
removed increased not only as the square of G (Fig. 5.15) but also as the square
of the load. Thus progressively less material is removed as the scratches start to
and then fully overlap. However, they also showed that the volume removed
also increased ∼ linearly as the number of repeat scratches in the same track in-
creases, but with the rate of increase again being a significant function of both
load and G.
Rice [91] summarized many of the known and expected effects of mi-
crostructure, especially G, on ceramic wear, noting for example that grain size
effects on wear can arise not only from the size of the surface indentation rela-
tive to G and the subsequent motion of the indenter across grain boundaries but
also from the depth of penetration into the grain. The probable role of EA and
TEA on wear were noted, and that of the transition of fracture energy and tough-
ness from polycrystalline to single crystal or grain boundary values (Fig. 2.15)
has been previously noted [92], as has the greater influence of TEA (and proba-
bly EA) as the crack size approaches G [93]. Xu et al. [89] also noted probable](https://image.slidesharecdn.com/mechanical-properties-of-ceramics-and-composites-120303143122-phpapp01/85/Mechanical-properties-of-ceramics-and-composites-332-320.jpg)
![332 Chapter 5
FIGURE 5.16 Plot of the separation (d) of two parallel scratches on the surfaces of
a dense sintered alumina for enhanced removal as a function of the grain sizes of
the alumina. Vertical bars are standard deviations. Note the ∼ constant multiple of
separation for initiation and maximum of enhanced removal due to scratch interac-
tions, and that the curves do not go through the origin. (Data from Ref. 90, pub-
lished with the permission of the Journal of Materials Science.)
contributions of TEA to their alumina wear results and cited them as a reason
that use of substantially lower fracture toughness values may be more appropri-
ate than normal polycrystalline values.
Diamond POD tests (2 kg load) of fibrous grain structures and their orien-
tation effects were conducted by Wu [94] on the same jade samples discussed
earlier (Table 2.3). The Guatemalan jadeite with the lowest toughness of ∼ 3
MPa·m1/2, coarser G (dia. ∼ 40 µm with an aspect ratio of ∼ 2), and ∼ random
grains had the smallest width (∼ 64 µm) and cross section of the track from the
diamond, but subsurface crack damage often extended to twice the track width.](https://image.slidesharecdn.com/mechanical-properties-of-ceramics-and-composites-120303143122-phpapp01/85/Mechanical-properties-of-ceramics-and-composites-333-320.jpg)
![Grain Dependence of Comprehensive Strength, Wear 333
The Siberian hornblende with somewhat higher toughness (∼ 3.5 MPa·m1/2) and
finer G (∼ 5 µm with an aspect ratio of ∼ 10) with ∼ random grain orientation had
∼ twice the track cross section and ∼ 20% greater track width, but with a similar
extent of subsurface crack damage. The LB hornblende with finer G (∼ 1 µm dia
with an aspect ratio of ∼ 50), substantial orientation, and associated toughness
anisotropy ranging from ∼ 2–5 times the other jades had anisotropic track char-
acter. This character was similar for any direction of fibers parallel with the plane
of the track, since the diamond tip samples all orientations in the plane of its cir-
cular path. This gave track cross sections ∼ 2 times those for the jadeite, but track
and damage widths ∼ the same as for the other hornblende. However, when the
fibrous direction was normal to the surface and plane of the track, the second
lowest track cross section and track width were obtained, indicating a definite
anisotropy of response. An uncertainty in these tests was the hardness values for
these materials and a measure of the depth of associated damage below the track
(as opposed to the extent of damage near the surface outside of the track). How-
ever, these results show a definite anisotropy due to substantial preferred orienta-
tion, as might be expected, but pronounced effects of whether damage was much
worse for motion normal to the fibers, as might be expected for some fibrous ma-
terials, was apparently not observed.
As with other properties, single crystal wear results are an important refer-
ence point for grain structure, especially orientation, effects. Though used more
in other properties reviewed in previous sections and chapters, there is some data
on friction and wear for single crystals beyond that previously cited. Thus, for
example, Bowden and Brookes [95] showed that sliding friction on {100} sur-
faces of LiF, MgO, and diamond was the greatest in <100> and the least in
<110> directions, with the extent of the anisotropy increasing as the sharpness of
the slider tip increased. This anisotropy was related to the depth of penetration
due to increased activation of slip and resultant cracking, especially in LiF and
MgO, which was consistent with the frictional anisotropy reflecting the hardness
anisotropy (Fig. 4.21 and Tables 4.3 and 4.4), especially as the sharpness of the
slider increased. Buckley [96–98] reported friction coefficients for some planes
on some single crystals, e.g. on sapphire varying from 0.5 to 1 depending on the
surface and direction of motion. Similarly he showed the rate of wear as a func-
tion of crystal plane and direction for rutile similar to that of hardness
anisotropy, but of much greater amplitude, e.g. peak-to-valley ratios of up to 7
for wear rate.
Turning to polycrystalline results, consider first abrasive wear, e.g. mea-
sured by weight loss, of a sample rotated under an abrasive wheel loaded
against the sample by a fixed deadweight load so that the abrasive wheel is free
to rotate about its axis, which is normal to that of the specimen rotation. This
test (a commercial manifestation of which is the Taber Wear Tester) is thus sim-
ilar to a pin-on-disk test with multiple contacts of the abrasive wheel replacing](https://image.slidesharecdn.com/mechanical-properties-of-ceramics-and-composites-120303143122-phpapp01/85/Mechanical-properties-of-ceramics-and-composites-334-320.jpg)
![334 Chapter 5
the single contact of the pin against the rotating disk sample. Wu et al. [82] con-
ducted some Taber tests on two bodies of G ∼ 1 and 50 µm from the same or
similar alumina used for their DPOD tests giving a clear increase in wear as G
increases and hence decreasing wear resistance as G increases, but at a lower
rate than in the DPOD tests (Fig. 5.10). However, again note larger G polycrys-
talline results below those for single crystals. Taber testing of the same SiC
specimens from the DPOD tests (Fig. 5.11) resulted in a separation of the data
into two groups, one of RBSC specimens that had larger G, Si second phase,
higher wear rates for a given G, and a lower slope versus G-1/2, and the other sin-
tered or hot pressed SiC with finer G, lower wear rates at a given G, and a
higher slope versus G-1/2 (Fig. 5.17).
FIGURE 5.17 Wear rate (i.e. inverse of wear weight loss per unit wear area) ver-
sus the inverse square root of grain size for Taber wear tests of various RBSC
and sintered and hot pressed SiC bodies, the same ones as were shown in Fig.
5.11. Note that this wear test separates the bodies into two groups, one of RBSC
with more wear and a lower slope versus G -1/2 and the other the sintered and hot
pressed bodies with a higher slope versus G -1/2, but displaced to the right, i.e. to
lower wear. (From Ref. 84, published with the permission of Ceramic Engineering
and Science Proceedings.)](https://image.slidesharecdn.com/mechanical-properties-of-ceramics-and-composites-120303143122-phpapp01/85/Mechanical-properties-of-ceramics-and-composites-335-320.jpg)
![Grain Dependence of Comprehensive Strength, Wear 335
B. Grain Dependence of Sliding and Related Wear
Turning to predominately sliding wear, Cho et al. [99] conducted some pin-on-
disk tests of three of the same or similar Al2O3 bodies used by Xu and colleagues
where the “pin” was a 12 mm diameter Si3N4 ball (rather than a rod with a spher-
ical end) rotated at 100 rpm under a load of 450 N with paraffin oil lubricant. The
widths of the resultant wear track used as a measure of the wear as a function of
test time showed an incubation period of low wear for all samples and then a
change to a much more rapid wear rate that began at a specific time for each
body, with the time varying inversely with G, i.e. the time for onset of more
rapid wear increasing substantially as G decreased. They observed correspond-
ing wear track development as being only smooth striations before significant
wear onset and microfracture, mostly intergranular after the onset of increased
wear. The occurrence of plastic deformation was confirmed by TEM showing
“severe accumulation of dislocation pileups and twins with strong crystallo-
graphic features, characteristic of abrasion damage in ceramics.” They presented
a model based on TEA stresses and resultant cracking for their observed G de-
pendence of the onset of significant wear, predicting a dependence close to, but
not exactly of, a Hall–Petch form. Liu and Fine [100] also modeled their data
based on microcracking from TEA stresses, with similar agreement between
their model and the data. However, neither group addressed the issue of whether
such wear behavior is unique to noncubic materials, as might be implied by a di-
rect dependence on TEA.
Gahr et al. [101] studied unlubricated sliding and oscillating wear using a
hollow cylinder whose outer surface was rotated against a thin block, or oscil-
lated over a plate, of the same ceramic, using respectively a 10 N load and a
speed of ∼ 0.8 m/s and a 100 N load and a speed of 0.02 m/s at 20 Hz. Both a
dense sintered, pure alumina (G ∼ 0.8–12 µm) and three mol% Y TZP (G ∼ 0.3–2
µm were used. Both H and KIC were measured (10 N load) showing H decreasing
from 19.5 to 16 GPa for Al2O3 and ∼ 13.8 to 12 GPa for the TZP as G increased,
and KIC increasing with G and then being ∼ constant at higher G, i.e. respectively
from ∼ 3.7 to ∼ 4.1 MPa·m1/2 by G ∼ 4 µm and 5 for Al2O3 to nearly 10 MPa·m1/2
by G ∼ 1.2 µm for ZrO2. They also showed that surface roughness was low and
constant over the limited G range for the TZP, and for the alumina started from
the levels achieved for TZP (∼ 0.1+ µm) at fine G but increased to ∼ 0.7 µm at G
∼ 12 µm. They showed that the unidirectional sliding coefficient of friction for
the alumina was nearly independent of G at ∼ 1, while that for the TZP increased
from ∼ 0.5 at the finest G to ∼ 1 by G = 0.6–0.8 µm and constant beyond. For
unidirectional sliding the wear resistance of both the alumina and the TZP varied
as G-1/2, with that for TZP being over an order of magnitude lower, but for recip-
rocating sliding the G dependences were respectively G-2 and G-1/3, so the larger
G wear rates for the alumina were about the same as for the TZP. Their examina-](https://image.slidesharecdn.com/mechanical-properties-of-ceramics-and-composites-120303143122-phpapp01/85/Mechanical-properties-of-ceramics-and-composites-336-320.jpg)
![336 Chapter 5
tion of the wear tracks showed the same general trend, namely more plastic flow
at finer G and more intergranular fracture as G increased, especially in alumina
over its larger G range. Their results clearly showed there is no correlation of
their indent KIC values and wear results.
He et al. [102] conducted similar pin-on-disk tests of fine grain Y-TZP us-
ing a 4 mm diameter SiC ball under a load of 8 N oscillated over the surface at 8
× 10-2m/s in dry N2. They found that wear decreased linearly with G-1/2 to G = 0.7
µm and then transitioned to a higher rate of wear, varying as G-1 for G > 0.9 µm.
The higher wear regime was characterized by delamination, accompanying grain
pullout, and transformation to monoclinic ZrO2.
While the above results all show substantial decrease in wear as G de-
creases, there are tests showing opposite trends. Thus Xiong et al. [103] used a
pin-on-disk test of Al2O3 disks and pins with G = 4, 8, or 12 µm with a 10 N
load on the pin as the disk was rotated or oscillated at 1000 rpm and ∼ 1 m/s in
air. A key difference was that they used flat rather than rounded pin tips. Their
wear rates (based on weight loss) for both the disk and the pin of the same G
clearly showed wear of both linearly decreasing as G increased, e.g. by ∼ 3/4
from G = 4 to G = 14 µm, i.e. opposite of the G dependence in other tests.
They reported that the wear surfaces of the finer G test samples showed severe
damage manifested as extensive intergranular fracture and substantial debris,
while the largest G samples showed some intergranular fracture but no wear
debris. They suggested that the opposite G dependence from that normally
found versus that of their tests resulted from the use of a flat pin generating
more debris at finer G that could not be removed because of the flat versus nor-
mal rounded pin tip.
There is other evidence for an opposite dependence of wear on G, i.e. for
wear to increase rather than decrease as G decreases. A more detailed study of
this is the wear of Ni-Zn ferrite head materials due to the passage of CrO2 or
Fe2O3 recording tapes over them. Thus Kehr et al. [104] showed that the amount
of ferrite wear decreased by 10–20% as G increased from 3+ to ∼ 39 µm for
both tapes, but with about threefold higher absolute wear levels for the CrO2
tape. The wear trends for as-machined or annealed (1 hr in air at 900°C) ferrite
surfaces were the same, though there was a trend for the machined surfaces to
have somewhat lower wear, at least against the Fe2O3, as expected from proba-
ble work hardening of such surfaces. This trend for less wear at larger G oc-
curred with a small reduction in porosity from ∼ 0.3 to ∼ 0.1%, but this was not
seen as sufficient to explain the difference (though there may be an effect of in-
corporating pores within grains with grain growth on wear behavior, as is noted
below). That the amount of porosity decreased by itself is not sufficient to ex-
plain the increase in wear with increased G, but it is consistent with normal de-
creases in both hardness and flexure strength as G increases (both linearly
versus G-1/2, with somewhat higher strengths for annealed versus machined](https://image.slidesharecdn.com/mechanical-properties-of-ceramics-and-composites-120303143122-phpapp01/85/Mechanical-properties-of-ceramics-and-composites-337-320.jpg)
![Grain Dependence of Comprehensive Strength, Wear 337
samples). Note, however, that similar ferrites also showed more transgranular
fracture with SCG and more intergranular fracture in fast fracture than most
materials (Chap. 2, Sec. III.B).
There is further precedence for wear apparently decreasing as G increases
in various industrial wear tests and applications, at least of alumina bodies [105].
For example, many 99% commercial alumina products are sintered with MgO ad-
ditions to control grain size (e.g. to ∼ 8 µm) to give better mechanical perfor-
mance, including wear resistance for various applications. However, for some
wear applications, better performance is found by leaving out the MgO, which
about doubles the grain size from the same or similar firing with MgO additions.
The resulting larger grain bodies of very similar density as those sintered with
MgO gives better wear resistance in some tests (e.g. rotating specimens in a wa-
ter–sand slurry) and applications but worse performance than its finer grain coun-
terpart in other applications and tests, e.g. of grit blast resistance. It has been
suggested that the better performance of the larger G bodies may reflect probable
increased intra- versus intergranular pores, but these results are a clear indication
of the complexities of microstructural interactions in wear, i.e. similar to those,
but possibly even more complex than, for other properties, and the need for more
comprehensive testing and characterization. It should also be noted that such in-
dustrial tests also generally show many of the wear and erosion trends indicated
earlier, e.g. the common superiority of Si3N4 (and some toughened bodies, Chap.
10, Sec. III.C).
Another important mode of wear behavior is rolling contact fatigue
(RCF), since this is the method of selecting ceramics for ball and roller bearing
applications. In such tests a ceramic rod with a high-quality, bearing grade sur-
face finish is rotated at high speed while held between three balls in a plane nor-
mal to the rod axis with high contact pressures between the balls and the rod. In
such tests and applications what is sought are materials and finishes that result
in noncatastrophic failure with long incubation times for formation of small lo-
cal spalls which can in turn lead to more serious damage and vibration. There
has apparently not been any study of G dependence in Si3N4, which dominates
the ceramic bearing field, in part since G commonly does not vary widely in
Si3N4, and, though no clear correlation apparently exists, generally finer G bod-
ies are common in this application. However, Rice and Wu [85] conducted lim-
ited RCF tests on four ZrO2 materials, a PSZ single crystal, and three
polycrystalline TZP bodies. Despite some limited porosity in the latter, they all
showed longer RCF lives than the single crystal, indicating better performance
with finer G, especially at the finest G (∼ 0.25 µm), where the life was over an
order of magnitude higher. Failure was by spalling, which in the polycrystalline
bodies was typically from larger, mostly isolated, pores or pore clusters, indi-
cating further potential advantage of G with improved body quality, especially
less and smaller pores.](https://image.slidesharecdn.com/mechanical-properties-of-ceramics-and-composites-120303143122-phpapp01/85/Mechanical-properties-of-ceramics-and-composites-338-320.jpg)
![338 Chapter 5
FIGURE 5.18 Difficulty of sawing with a standard commercial diamond blade with
a fixed horizontal force moving the specimen into the blade versus the inverse
square root of the grain size for the three ceramics shown. The correlation coeffi-
cients were reported to be 0.99, 0.98, and 0.6 for B4C, Al2O3, and MgO respec-
tively. (From Ref. 106, published with the permission of the Journal of the
American Ceramic Society.)
VI. GRAIN DEPENDENCE OF MACHINING RATES AND EFFECTS
While the preceding sections reviewed material removal and damage by ero-
sion and wear, there is also interest in and need for documenting and under-
standing corresponding grain effects on machining of ceramics. However,
while there is common interest in limiting the extent of surface damage in both
cases, it is desired to have higher machining rates rather than lower ones as
typically sought with wear and erosion. Clearly both fixed and free abrasive
machining involve similar basic mechanisms found in erosion and wear, so the
topics are related.
Rice and Speronello [106] made a fairly comprehensive study of the rate](https://image.slidesharecdn.com/mechanical-properties-of-ceramics-and-composites-120303143122-phpapp01/85/Mechanical-properties-of-ceramics-and-composites-339-320.jpg)
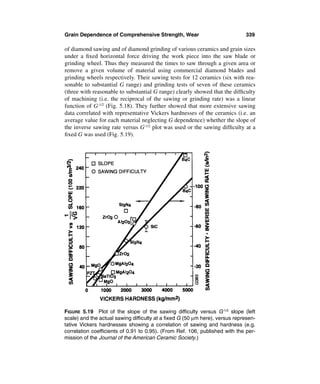
![340 Chapter 5
Earlier work by Goyette et al. [107] showed that the vertical forces in sin-
gle point diamond machining of five dense sintered Al2O3 bodies decreased sig-
nificantly, e.g. ∼ twofold, from the smallest to the largest G (2–40 µm) for a
fixed rpm over the > threefold rpm range used. Similarly, Marshall et al. [108]
showed that normal grinding forces increased with depth of cut as expected and
that for any fixed depth of cut was substantially higher for finer G (∼3 µm) than
coarser G (20 and 40 µm) high purity alumina bodies. However, a 96% alumina
with intermediate G (∼ 11 µm) had higher forces, sapphire still higher, and a
90% alumina (G ∼ 4 µm) still higher forces. Thus they noted that purity was
also a factor: some less pure materials had higher forces. Normal fracture
toughness values from conventional tests, i.e. with cracks large with respect to
most microstructures, showed an inverse correlation with grinding forces
(hence grinding resistance), but there was a better, though scattered, correlation
with toughness values projected to finer crack sizes, some of these approaching
single crystal values.
Xu et al. [89] showed similar effects of G on grinding results in the alu-
mina bodies used in their earlier summarized studies. Normal and tangential
grinding forces both increased with depth of cut in respectively a nearly linear
and a linear fashion, with substantially higher rates of increase for G = 3 µm,
but no significant differences for G = 9–35 µm. Average surface roughness pro-
gressively increased, but with diminishing increases as G increased; the num-
ber, and hence also the area, of microcracks (intergranular) was zero for G = 3
µm, but beginning at G = 9 µm they increased at a substantial, ∼ linear, rate as a
function of G-1/2.
VII. DISCUSSION AND SUMMARY
The properties considered in this chapter are commonly more varied and complex
than those of Chapters 2 and 3, and less well documented, for their dependence on
G and other material, body, and test parameters. All have several aspects in com-
mon, i.e. compressive stresses, as for hardness, and all have at least a general cor-
relation with hardness and involve some degree of plastic deformation, which
varies, often in incompletely known fashions, for the different properties. Grain
parameters play some, commonly an important, role in all of them, but only grain
size has been addressed to any, but still limited, extent (sometimes not explicitly),
so other grain effects offer important opportunities not only for study and under-
standing of their roles in each of the properties but also for better and broader un-
derstanding of the properties themselves. For example, a number of materials and
bodies studied most likely have measurable but varying degrees of grain elonga-
tion, e.g. Si3N4, α-SiC, Al2O3, and TiB2, and various bodies, e.g. hot pressed ones,
commonly have some preferred orientation, so these unaddressed factors are
probably factors in data scatter, and especially uncertainties in property correla-](https://image.slidesharecdn.com/mechanical-properties-of-ceramics-and-composites-120303143122-phpapp01/85/Mechanical-properties-of-ceramics-and-composites-341-320.jpg)


![346 Chapter 5
Room Temperature. Proc. 1st Intl. Conf. on Fracture 2. Japanese Soc. Strength and
Fracture Materials, 1966, pp. 883–898.
32. F. P. Knudsen. Dependence of Mechanical Strength of Brittle Polycrystal-
line Specimens on Porosity and Grain Size. J. Am. Cer. Soc. 42(8):376–388,
1959.
33. C. E. Curtis and J. R. Johnson. Properties of Thorium Oxide Ceramics. J. Am. Cer.
Soc. 40(2):63–68, 1957.
34. C. S. Yust and C. J. Hargue. Deformation of Hyperstoichiometric UO2 Single
Crystals. J. Am. Cer. Soc. 54(12):628–635, 1971.
35. M. S. Paterson and C. W. Weaver. Deformation of Polycrystalline MgO Under
Pressure. J. Am. Cer. Soc. 53(8):463–471, 1970.
36. S. M. Copley and J. A. Pask. Deformation of Polycrystalline MgO at Elevated
Temperatures. J. Am. Cer. Soc. 48(12):636–642, 1965.
37. T. A. Auten and S. V. Radcliffe. Deformation of Polycrystalline MgO at High Hy-
drostatic Pressure. J. Am. Cer. Soc. 59(5-6):249–253, 1976.
38. C. W. Weaver and M. S. Paterson. Deformation of Cubic-Oriented MgO Crystals
Under Pressure. J. Am. Cer. Soc. 52(6):293–301, 1969.
39. T. A. Auten, S. V. Radcliffe, and R. B. Gordon. Flow Stress of MgO Single Crys-
tals Compressed Along [100] at High Hydrostatic Pressure. J. Am. Cer. Soc.
59(1–2):40–42, 1976.
40. W. F. Brace. Dependence of Fracture Strength of Rocks on Grain Size. Penn. State
Univ. Mineral Experimental Station Bull. 76:99–103, 1963.
41. W. F. Brace. Brittle Fracture of Rocks. Intl. Conf. on States of Stress in the Earth’s
Crust—Preprints of Papers (W. R. Judd, ed.). Rand Corp. Report, 1963.
42. J. T. Fredrich and B. Evans. Effect of Grain Size on Brittle and Semibrittle
Strength:Implications for Micromechanical Modeling of Failure in Compression.
J. Geophysical Res. 95:10907–10920, 7/1990.
43. W. Rafaniello. Development of Aluminum Nitride:A New Low-Cost Armor. Dow
Chem. Co. Final Report for US Army Research Office Contract DAAL03-88-C-
0012, 12/1992.
44. D. A. Nelson, Jr., and A. L. Rouff. The Compressive Strength of Perfect Diamond.
J. Appl. Phys. 50(4):2763–2764, 1979.
45. J. Lankford. Mechanisms Responsible for Strain-Rate-Dependent Compressive
Strength in Ceramic Materials. J. Am. Cer. Soc. 64(2):C–33–34, 1981.
46. J. Lankford. High Strain-Rate-Dependent Compression and Plastic Flow of Ce-
ramics. J. Mat. Sci. 15:745–750, 1996.
47. A. Nash. Compressive Failure Modes of Alumina in Air and Physiological Media.
J. Mat. Sci. 18:3571–3577, 1983.
48. L. Ewart and S. Suresh. Crack Propagation in Ceramics Under Cyclic Loads. J.
Mat. Sci. 22:1173–1192, 1987.
49. S. Suresh. Fatigue Crack Growth in Brittle Materials. J. Hard Materials
2(1–2):29–54, 1991.
50. H. C. Heard and C. F. Cline. Mechanical Behavior of Polycrystalline BeO, Al2O3,
and AlN at High Pressure. J. Mat Sci. 15:1889–1897, 1980.
51. I. A. Bairamashvili, G. I. Kalandadze, A. M. Eristavi, J. Sh. Jobava, V. V. Chotu-](https://image.slidesharecdn.com/mechanical-properties-of-ceramics-and-composites-120303143122-phpapp01/85/Mechanical-properties-of-ceramics-and-composites-347-320.jpg)


![352 Chapter 6
This chapter also briefly reviews effects of test environment and (mainly
moderate) temperature on the flexure strength (σ) of polycrystalline ceramics as
a function of grain size (G), in part complementing and extending discussion of
slow crack growth (SCG) in Chap. 2. Additional insight is sought by comparing
these polycrystalline strength trends with the behavior of single crystals (where
available) and of Young’s modulus. This chapter draws substantially on a more
recent review [1] and complements this and other reviews of σ–G-1/2 behavior at
22°C, updating and extending them [1–3]. The purpose of this chapter is to con-
sider these factors as a guide to understand better the grain dependence of mech-
anisms of brittle fracture as a function of T. Thus while some behavior in the
1000–1500°C range is noted, the focus is on the –200 to 1000°C range; creep
and high-temperature stress-rupture are only briefly considered. Similarly, while
environmental effects are further considered, the focus is on their impact on σ–G
relations. While useful information and implications regarding σ–G relations are
obtained, uncertainties and inadequacies are shown that provide guidance for
improved studies.
Properties are treated in the order of crack propagation and fracture tough-
ness followed by tensile strength and then thermal stress and shock failure, for
which there is limited data. This chapter shows that strengths can increase sub-
stantially more at T < 22°C than expected from increases in E due to suppression
of SCG and that there is limited data at T > 22°C and < 800–1000°C, apparently
due to the common assumption that no significant property changes occur in this
temperature range. This is often found to be incorrect by limited more compre-
hensive tests. Comparison of the relative temperature dependence of Young’s
modulus, toughness, and tensile strength is used to indicate mechanisms and
changes. Some important strength changes in this intermediate range are shown,
e.g. especially in Al2O3, where corresponding changes in hardness and compres-
sive strength are shown in the next chapter. In general, more consistency is found
between toughness and tensile strength at T > 22°C.
II. MODELS AND CONCEPTS
A. Young’s Modulus, Toughness, and Tensile (Flexure) Strength
Modeling of properties as a function of temperature is typically based on access-
ing the temperature dependence of the key parameters in the mechanism that is
dominant in the temperature regime considered. Where there is a transition be-
tween mechanisms, some interpolation between the expectations of the different
mechanisms may be sought for guidance. Where other mechanisms become op-
erative, they must be addressed, with creep being a fundamental one, as is dis-
cussed below.
First consider the temperature dependence of elastic moduli, which are ba-](https://image.slidesharecdn.com/mechanical-properties-of-ceramics-and-composites-120303143122-phpapp01/85/Mechanical-properties-of-ceramics-and-composites-353-320.jpg)
![Grain Effects on Thermal Shock Resistance 353
sic parameters, hence correlators, with properties discussed in previous chapters.
While elastic moduli normally do not depend on grain parameters, comparison
of their temperature dependence with that of other mechanical properties can in-
dicate changes in mechanisms. This is particularly so for fracture toughness and
related crack propagation and tensile strength, since they depend directly on
Young’s modulus (E) [Eq. (2.2)]. This comparison with the temperature depen-
dence of elastic moduli is aided by their typically better documented, better un-
derstood, and simpler decrease with increasing temperature due to their
reflecting basic atomic bonding and the resultant decreases of this with tempera-
ture. Decreases of 1 to 2% per 100°C temperature rise are common. Thus Ander-
son [4] showed that Wachtman’s empirical equation [5] for Young’s modulus (E)
at any temperature (T),
E = E0 – ATe–(T0/T) (6.1)
where E0 = Young’s modulus at absolute zero temperature (T0) and A a is con-
stant, was theoretically correct, i.e. could be derived from the Mie–Gruneisen
equation of state if Young’s modulus was replaced by the bulk modulus. The
equation was also theoretically correct for Young’s modulus provided that the
temperature dependence of Poisson’s ratio is small, which is true for some, but
not all, ceramics. Others have corroborated and extended these results, e.g. Ref.
6. Such intrinsic changes in elastic moduli with temperature are an important
factor in the temperature changes of other properties that scale with elastic mod-
uli, so deviations of other mechanical properties from such decreases with tem-
perature are an important indication of changes in mechanisms. Greater
deviations of polycrystalline versus single crystal behavior from the temperature
dependence of E are also an important sign that microstructural effects are
changing with temperature, as is shown in Sec. IV. Thus while grain boundary
sliding (e.g. whose earlier onset may be indicated by internal friction) [7–11]
may also affect the apparent elastic moduli if the stressing period is sufficiently
long relative to the rate of creep such that some measurable nonelastic strain oc-
curs during the stress cycle; such sliding typically has greater effect on other me-
chanical properties.
Other property changes with temperature may cause changes in the tem-
perature dependence of other mechanical properties directly or via effects on
elastic properties. A prime example of the latter is effects of temperature changes
on microcracking from thermal expansion differences, e.g. anisotropy (TEA) be-
tween grains, which decreases as temperature increases and vice versa and also
commonly depends on G, as was discussed in Chap. 2, Sec. III.C. As is discussed
elsewhere [8], the significant decreases that substantial microcracking can make
in elastic and other mechanical (and nonmechanical, e.g. thermal) properties can
be reversed due to microcracks generally decreasing in size, number, or both,
with many closing and partly or fully healing, as temperature substantially in-](https://image.slidesharecdn.com/mechanical-properties-of-ceramics-and-composites-120303143122-phpapp01/85/Mechanical-properties-of-ceramics-and-composites-354-320.jpg)
![354 Chapter 6
creases. Thus the normal decrease of elastic (and other mechanical) properties
with increasing temperature may be temporarily reduced or reversed till further
temperature increases result in the normal decrease in properties, with the re-
verse trend on cooling. Similarly, though less established and understood, elastic
anisotropy (EA) may affect or cause such cracking, aiding or countering effects
of TEA in noncubic materials, or by itself in cubic materials [8]. However, in
contrast to the more consistent temperature dependence of TEA, that of EA may
decrease, be nearly constant, increase, or show combinations of these as temper-
ature increases, making evaluations material specific (Fig. 7.14).
Besides the above effects of temperature on properties via changes under-
lying those of interest, there are also the mobility and activity of water as the
most pervasive sources of slow crack growth (SCG) via chemical effects that
greatly decrease as temperature increases. Thus in materials such as Al2O3,
which experience substantial SCG, their strengths at lower temperatures (e.g.
commonly –196°C in liquid N2) are increased far more than expected from the
1–2% increase in E. Similarly, temperature increases, especially above 100°C,
reduce the amount of moisture at crack tips and hence resultant SCG from it. The
other important change in crack propagation and resultant mechanical properties
arises from grain boundary sliding and its effects on both the crack size and char-
acter at failure and the energetics of propagation including impacts of possible
effects on crack bridging and branching. However, all of these again raise ques-
tions and complications of the impact of crack size effects in crack propagation
tests versus in the properties to be predicted such as tensile strength.
Beyond the above effects of temperature on underlying parameters such as
Young’s modulus and crack size, e.g. the latter due to localized grain boundary
sliding at and near crack tips, there are the broader mechanisms of nonelastic, i.e.
creep or other deformation processes. These become of increasing significance,
commonly on both a broader scale spatially in the sample or component and in
terms of materials as temperatures increase and strain rates decrease. While there
can be important differences between tensile and compressive stressing, for ref-
erence and guidance the following representative equation for the strain rate
(d∈/dt) in creep is
n
dε AMs b σ
m
(6.2)
=
dt kT G Ms
where A = a constant, MS = the shear modulus, k= Boltzmann’s constant, T = ab-
solute temperature, b = the Burgers vector, G = grain size, σ = stress, and m and
n are constants for a given body and condition, which are respectively typically](https://image.slidesharecdn.com/mechanical-properties-of-ceramics-and-composites-120303143122-phpapp01/85/Mechanical-properties-of-ceramics-and-composites-355-320.jpg)
![Grain Effects on Thermal Shock Resistance 355
0–3 and 1–5. Thus even in the case of the least dependence on G, strain rate in-
creases as G–1, i.e. greater than the G dependence for brittle fracture of G–1/2.
Such dependence of creep rate is essentially in the opposite direction from that
of brittle fracture, since higher creep strain rates correspond to failure in faster
times, at lower stresses, or both as G decreases versus increased strength in brit-
tle fracture as G decreases.
B. Thermal Stress, Shock, and Fatigue Failure
The classical way of addressing thermal stress and shock failure was to solve the
boundary value problems, or more commonly use existing compilations of solu-
tions, e.g. Ref. 12. Such solutions almost invariably assumed isotropy of the
body and that properties were temperature independent, since to do otherwise
substantially complicates the problem. Application of these solutions, which are
typically quite dependent on component geometry and boundary conditions, is
by comparing the resulting thermal stresses to the known, or expected, failure
stresses of the material, e.g. via use of Weibull statistics of failure [13]. Such so-
lutions and experimental results yielded a number of thermal stress failure crite-
ria depending on the material parameters and the thermal environment [14–18].
These basically fall into two broad categories of thermal stress failure resistance,
i.e. where (1) no significant crack generation or growth occurs, so there is no loss
of strength, or (2) thermal stresses are so extreme that crack generation, or more
commonly growth, cannot be avoided but can sometimes be limited so that some
reasonable level of strength remains.
The maximum tensile stress σt from a rapid temperature change is
σt = Eα (∆T)(1 – ν)–1 (6.3)
Where E = Young’s modulus of the body, α = its thermal expansion, ∆T = the
temperature difference (typically in quenching), and ν = Poisson’s ratio. Various
modifications of this are made, e.g. to account for time dependence of establish-
ing this stress. Thus a factor reflecting the ratio of the time-dependent maximum
stress to the theoretical maximum stress, i.e. of ≤ 1, is often multiplied into the
right side of Eq. (6.3) to account for this [19]. Similarly, the right side of Eq.
(6.3) may be multiplied by the thermal conductivity to reflect the higher temper-
ature gradients from lower conduction in the body. Such equations are readily
solved for the critical ∆T, i.e. ∆TC, and hence the critical quench temperature, TC,
into a given environment, commonly a water bath, that causes measurable
strength degradation. Thus though there are uncertainties or refinements such as
specifics of the heat transfer from the specimen to the fluid [20] and effects of the
bath temperature on this [21], such standardized quench tests are widely used to
compare and rank materials.
Modeling of thermal stress and shock effects was advanced by analysis of](https://image.slidesharecdn.com/mechanical-properties-of-ceramics-and-composites-120303143122-phpapp01/85/Mechanical-properties-of-ceramics-and-composites-356-320.jpg)
![356 Chapter 6
bodies with arrays of cracks based on previous mechanical analysis of such bod-
ies. Models based on such crack arrays were developed, applied, and extended
by Hasselman [14–18], who showed their consistency with fracture mechanics
formulation [18], providing direct analysis of the effects of microcracks [22,23].
Hasselman also noted that thermal stresses could also cause failure of function
due to excessive buckling or fracture from bending stresses [24], with criteria for
resistance to these being respectively (1) low thermal expansion and a low aspect
ratio of the body, and (2) a high body aspect ratio and value of σ2(αE2)–1. Some
analysis of thermal fatigue has also been made [25].
The changes in mechanisms and underlying mechanical properties with in-
creased temperatures noted earlier can be factors in the thermal stress or shock
failure in ceramics of high resistance to such failure. However, their impact is
typically limited, since thermal stress failure, while determined by the extreme
high temperature involved, is usually controlled by fracture in the cooler regions.
This results from the fact that the main sources of flaws for failure in ceramics
are typically in or near the body surface. Thus in rapid cooling of heated bodies,
or of localized heating of part of a piece of ceramic, the coolest area(s) include
much or all of the free surface, where many of the flaws for failure are located.
Besides the above simpler model and more complex ones, there are now a vari-
ety of computer programs for thermal stress and shock, with some allowing con-
sideration of temperature dependence of properties, which can be important in
some cases.
III. FRACTURE TOUGHNESS AND RELATED CRACK
PROPAGATION AS A FUNCTION OF G AND TEMPERATURE
A. Fracture Toughness as a Function of G and Temperature
This section addresses fracture toughness (and hence also energy) and related
R–curve effects; high temperature SCG due to grain boundary sliding is ad-
dressed in the following section, as are effects of environments such as H2O on
SCG at T < 22°C and possible effects of G on them, since they are typically eval-
uated by flexure measurements. Unfortunately there is very little direct informa-
tion on the G dependence of crack propagation behavior for these two sections
due to combinations of the limited G range of materials available (e.g. SiC to
some extent, and especially Si3N4), the lack of tests on bodies of various G, and
the lack of specifying the G values for bodies studied. However, limited data al-
lowing comparison of single- and polycrystal results exists, as does somewhat
more data comparing fracture toughness and elastic moduli as a function of test
temperature. Such comparison indicates some effects of G, and effects of grain
boundary phases, which are a factor in grain effects, as is also shown by some di-
rect studies.](https://image.slidesharecdn.com/mechanical-properties-of-ceramics-and-composites-120303143122-phpapp01/85/Mechanical-properties-of-ceramics-and-composites-357-320.jpg)
![Grain Effects on Thermal Shock Resistance 357
Consider first the fracture toughness and R–curve effects in Al2O3, for
which there is more data than for other materials. Thus the data and survey for
sapphire of Iwasa and Bradt [26] show considerable variation as a function of
orientation, as does other data [27,28], but with a reduction in toughness
anisotropy as the test temperature increases (Fig. 6.1). Their evaluation showed
much greater decrease in the fracture toughness for basal plane fracture than ex-
pected elastically, indicating an increasing role of nonelastic processes as T in-
creases, so such basal fracture goes from being by far the least preferred to the
most preferred as temperature increases. This is consistent with indicated tough-
ness minima, e.g. due first to increased ease of slip or twinning aiding crack
growth and subsequent crack blunting as such deformation becomes more exten-
sive, and especially direct TEM observations showing increasing slip deforma-
tion as T increases (Wiederhorn et al [29]).
There is a fair amount of fracture toughness data for polycrystalline
FIGURE 6.1 Fracture toughness of sapphire (mainly from indent tests) on various
indicated fracture planes as a function of test temperature. Note that (1) data
could indicate a less rapid decrease in (0001) fracture than shown to ∼ 200°C,
and (2) the indicated expectation for much greater decrease of basal fracture, i.e.
on (0001) planes, is based on the temperature dependence of E (close to results
for the A and M planes). (From Ref. 26, published with permission of the Ameri-
can Ceramic Society.)](https://image.slidesharecdn.com/mechanical-properties-of-ceramics-and-composites-120303143122-phpapp01/85/Mechanical-properties-of-ceramics-and-composites-358-320.jpg)
![358 Chapter 6
Al2O3 to compare with the single crystal results. Most of this shows toughness
nearly constant as a function of T or more commonly decreasing over most or
all of the temperature range, with the rate of decrease increasing at higher tem-
peratures. Kobayashi et al.’s [30] data for a commercial alumina via a wedge
loaded DCB test is an extreme example of the former, showing little change
from 22 to 1000, then to 1600°C. De With’s [31] data for dense alumina sin-
tered with MgO additions showed, via NB tests, ∼ linear toughness (and
strength) decreases to the limits of their tests, ∼ 1200°C, that were ∼ those ex-
pected for E for both G ∼ 23 and ∼ 36 µm (the latter obtained with 40 ppm CaO
addition). He also showed that while toughness levels were lower than data
from other investigators for similar aluminas, they had similar slopes, as was
expected for the temperature dependence of E. The values for the finer G body
were ∼ 15% > for the larger G body, i.e.∼ 3.8 and 3.3 MPa·m1/2 respectively at
22°C, indicating a G dependence different from that of toughness independent
of or increasing with G at 22°C (Chap. 2, Sec. III.F). Also, his more extensive
data for the finer G body would be consistent with a toughness minimum at ∼
700°C and a maximum at ∼ 1100°C.
Dalgleish et al. [32] tested three commercial (95, 97.5, and 97.7%) alumi-
nas in the G range of respectively ∼ 4, 24, and 2 µm and P ∼ 0.06, 0.09, and 0.01
to 1000°C showing toughness minima at 300–600°C and then maxima at ∼
800°C, respectively ∼ 10% below and 10–30% above values at 22°C. No signifi-
cant change in acoustic emissions from each alumina occurred to 650°C, beyond
which emission, attributed to flow of the glassy grain boundary phase, increased
substantially, e.g. as indicated by intergranular fracture increasing with T. The
most probable microstructural correlation was for lower toughness at larger G,
e.g. by 40%, i.e. consistent with de With’s data above. Others also showed
toughness decreasing with increasing T, e.g. Tai and Watanabe [33] by ∼ 30% to
700°C, and Moffatt et al. [34] showed a similar trend with accelerating decreases
of ∼ 70–80% at 1400°C. Jakus et al. [35] evaluated an 85% commercial alumina
(G ∼ 5 µm) from 1150 to 1275°C showing that bridging of the crack by glassy
ligaments occurred.
Xu et al. [36] reported grain bridging of a pure, dense alumina (G ∼ 10.5
µm) based on R–curve effects from indentation cracks (mostly ∼ 100–300 µm)
with modest toughness increases, e.g. ∼ 30%, with increasing crack size, with
similar rates of increase for all test temperatures (25, 400, 700, 1000, and
1300°C). The decrease in toughness of ∼ 35% over the temperature range, which
is somewhat greater than expected from decreases in E (i.e. ∼ 27%), occurred
mostly by 400°C. They analyzed their data based on a bridging model assuming
that toughness is the sum of an intrinsic toughness, K0, and bridging contribu-
tions, giving K0 values decreasing from 2.2 to 1.4 MPa·m1/2 from 25 to 1300°C.
However, such values appear low in comparison to averaging single crystal val-
ues in Fig. 6.1, which would be for transgranular fracture with a crack size of ∼](https://image.slidesharecdn.com/mechanical-properties-of-ceramics-and-composites-120303143122-phpapp01/85/Mechanical-properties-of-ceramics-and-composites-359-320.jpg)
![Grain Effects on Thermal Shock Resistance 359
G rather than much larger cracks used. While fracture mode was not addressed,
intergranular fracture is expected, especially at higher temperatures, which could
lower K0 values, for cracks approaching or on the scale of G, but again such low
values would appear to be low for cracks encompassing 5–10 grains.
Grimes et al. [37] studied toughness and R–curve behavior of a commer-
cial, 99.5 pure (AD-995) alumina made with a SiO2 sintering aid giving G = 19 ±
4 µm (range 2–40 µm). They showed that while there was some variation for the
two NB tests used (chevron and straight notch), as expected, there was little or
no decrease in toughness values from 4 to 4.5 MPa·m1/2 from 22°C to 650°C and
then an accelerating decrease to ∼ 1 MPa·m1/2 at 1400°C. They observed limited
change in the fracture mode of mainly intergranular fracture for G < 15 µm and
mostly transgranular fracture for G > 20 µm to 950°C, except for some reduction
in the transgranular fracture, which accelerates at higher temperatures. By
1200°C, some crack branching was observed, with this increasing as temperature
increased. Renotching of the specimens confirmed that the R–curve effects,
which were similar in relative proportion to the toughness at each test tempera-
ture, were due to effects in the wake zone, which were attributed to bridging (and
at higher temperatures, branching).
As was noted above, individually data of de With [31] and Dalgleish et al.
[32] each indicated toughness decreasing as G increases. These data sets are also
generally consistent with each other as well as other limited data for ≥ 95% alu-
mina bodies where G values are available (Fig. 6. 2). Thus despite differing tests,
limited differences in purity, and residual porosity, these data sets collectively re-
inforce a decrease in toughness as G increases, but with this G dependence de-
creasing as T increases.
Another material for which there is both single- and polycrystal data as a
function of T is MgAl2O4. Stewart and Bradt [38,39] showed that the IF tough-
ness of stoichiometric MgAl2O4 crystals stressed on <100>, <110>, <111> axes
all showed limited decreases similar to, but less than, the expected decrease in E,
to ∼ 900–1200°C, but then increased at an increasing rate with further T in-
creases to the limit of testing (1500°C). White and Kelkar [40] and others
[41–44] showed that the toughness of a large G (∼ 100 µm), transparent
MgAl2O4 hot pressed with LiF additions (that reduce toughness at room temper-
ature, Fig. 2.13) initially decreased from ∼ 2.4 MPa·m1/2 at 22°C slower than E
but then accelerated its decrease as the melting temperature (800+°C) of LiF was
reached and then very modestly increased to the limit of testing at 1500°C (Fig.
6.3). To ∼ 800°C the fracture mode was ∼ 50% intergranular and then increased,
consistent with indicated and expected effects of LiF and possible increased
grain bridging as intergranular fracture increased.
Baudin et al. [43], using MgAl2O4 sintered from 99.6% pure spinel powder
to ∼ 2.5% porosity with G = 1.5 ± 0.8 µm, showed E decreasing from 205 GPa at
22°C to ∼ 170 GPa at 1300°C, i.e. ∼ a 10% decrease. Toughness decreased from](https://image.slidesharecdn.com/mechanical-properties-of-ceramics-and-composites-120303143122-phpapp01/85/Mechanical-properties-of-ceramics-and-composites-360-320.jpg)
![360 Chapter 6
FIGURE 6.2 Fracture toughness versus grain size (G) for ≥ 95% alumina bodies
at 22, 1000, and 1300°C, where G values were available from Xu et al. [36],
Grimes et al. [37], de With [31], and Dalgleish et al. [32]. (Note that the latter data
was corrected for P = 0.01, 0.06, and 0.09 respectively for G = 2, 4, and 24 µm
using e–4P, but trends would still be similar without such corrections.) Despite dif-
ferences in measurement techniques (indicated for toughness, G determinations
not always specified) and some differences in fabrication, purity, and residual
porosity, the data consistently indicates a decrease in toughness as G increases
and an overall decrease in both toughness and its G dependence as T increases.
3 MPa·m1/2 at 22°C to a minimum of 2.3 MPa·m1/2 at 800°C and then increased
to a maximum of 2.8 MPa·m1/2 at 1200°C. Strength behavior was opposite;
starting at 175 MPa at 22°C, it increased to a maximum of 200 MPa at 800°C
and then decreased to 160 MPa at the limit of testing of 1300°C. They also
showed that toughness at 1200°C decreased ∼ 20% (along with increasing
transgranular fracture) with increasing strain rate, similar to the ∼ 30% decrease
for single crystals [38], but the former may reflect more reduction in bridging
than in slip effects, which are the expected source of single crystal decreases.
Baudin and Pena [44] subsequently showed that the 1200°C toughness of a sto-
ichiometric spinel and two alumina rich ones, all having similar microstruc-](https://image.slidesharecdn.com/mechanical-properties-of-ceramics-and-composites-120303143122-phpapp01/85/Mechanical-properties-of-ceramics-and-composites-361-320.jpg)
![Grain Effects on Thermal Shock Resistance 361
FIGURE 6.3 Comparison of the temperature dependences of fracture tough-
nesses of polycrystalline MgAl2O4 hot pressed with LiF additions, G ∼ 100 µm, P
∼ 0 [40], MgAl2O4 sintered without additives, G = 1.5 ± 0.8 µm, P ∼ 0.02 [39] and
stoichiometric crystals of three orientations (dashed lines), along with Young’s
modulus (E) data for a dense polycrystalline body. Note the (1) limited toughness
differences for the two polycrystalline bodies and the highest crystal values mea-
sured in different tests to several hundred degrees, (2) more rapid decrease of
the body made with LiF as the LiF melting point is approached, then little or no
decrease at higher temperatures in contrast to the lack of such a drop for the
body made without LiF, but then a greater decrease for the latter at higher tem-
peratures, and (3) similar initial rates of decrease for the three crystal orienta-
tions, reaching a minimum and then increasing substantially (but presumably
decreasing again at higher temperatures).
tures, exhibited respectively intergranular fracture with bridging and mostly
transgranular fracture.
Inoue and Matzke [45] measured toughness of sintered ThO2 (G ∼ 20 µm
with much of the ∼ 8% porosity being intragranular and a micron or more in dia.)
using Hertzian cracks from spherical indenters of Al2O3 or steel from 22 to
388°C. These indenters gave toughness values of respectively 1.22 and 1.07 at
22°C decreasing to ∼ 0.77 MPa·m1/2 for both at 388°C, i.e. severalfold times the](https://image.slidesharecdn.com/mechanical-properties-of-ceramics-and-composites-120303143122-phpapp01/85/Mechanical-properties-of-ceramics-and-composites-362-320.jpg)
![362 Chapter 6
∼ 5% decrease in E. On the other hand, Ohnishi et al. [46] reported that sintered
(∼ 99% dense) mullite toughness decreased similar to E, i.e. by ∼ 5% from 22 to
500°C, beyond which toughness slowly, and then more rapidly, increased with
increasing T till slowing its increase by the limit of testing of 1400°C (Fig. 6.4).
Strengths showed similar trends, but less, and more complex, increases at higher
temperature (in contrast to no change till 1200°C and then only a slight decrease
for hot pressed mullite). Baudin [47] reported lower E values but with a similar
relative decrease with increasing T, and a similar range of toughnesses and
strengths values, but decreasing ∼ 10% to minima at ∼ 800°C, then increasing to
maxima ∼ 20% > values than at 22°C at ∼ 1400°C. Mah and Mazdiyasni [48] re-
ported fracture toughness calculated from their strengths and fractography of ∼
1.8 MPa·m1/2 at 22°C, decreasing ∼ 20% to a minimum of ∼ 1.5 MPa·m1/2 at ∼
1100°C and then increasing substantially as temperature further increased, ap-
parently due to slow crack growth that was observed beginning at ∼ 1300°C and
was attributed to limited amounts of a glassy grain boundary phase observed in
TEM.
Consider now the behavior of nonoxides, starting with SiC. Henshall et al.
[49] measured toughness of 6H α–SiC crystals using NB tests with the notch
- -
parallel with {1120}for propagation in the <1100> direction, obtaining 3.3
MPa·m from 22°C to 1000 K and then 5.8 MPa·m1/2 at 1773 K. However, Nay-
1/2
lor and Page [50], using an indentation technique, reported toughness decreasing
from 4.6 MPa·m1/2 at 22°C to 2.0 MPa·m1/2 at 800°C for fracture on (0001)
FIGURE 6.4 Young’s modulus, toughness, and two strength curves for mullite
versus test temperature. (From Ref. 46.) See also Figure 6.19.](https://image.slidesharecdn.com/mechanical-properties-of-ceramics-and-composites-120303143122-phpapp01/85/Mechanical-properties-of-ceramics-and-composites-363-320.jpg)
![Grain Effects on Thermal Shock Resistance 363
planes. While such room temperature values are high in comparison to values
from fractography by ∼ 60% and 100% respectively [51] (Chap. 2, Sec. III.D),
the temperature dependences are of prime interest here. Guillou et al. [52] also
measured (Berkovich) indentation toughness of 6H SiC crystals for indents on
-
(0001) planes with cracks in <1010> directions showing ∼ 40% decrease by
600°C and then an ∼ bottoming out at ∼ 1.6 MPa·m1/2, as with Naylor and Page
(Fig. 6.5). Thus there is agreement and there are similarities and differences in
the SiC data.
Evans and Lange [53] showed that the DT toughness of commercial SiC
hot pressed with Al2O3 addition was ∼ constant at ∼ 4 MPa·m1/2 to ∼ 1100°C and
then decreased substantially, i.e. to ∼ 2.8 MPa·m1/2 at 1400°C. Henshall et al.
[54] subsequently evaluated the NB toughness (and delayed failure) of the same
SiC (G ∼ 1.5 µm), giving toughness of ∼ 6.1 MPa·m1/2 to ∼ 1000°C and then de-
creasing to ∼ 4 MPa·m1/2 by 1773 K. While their absolute values are about 50%
higher, the relative change in toughness with temperature were very similar.
These changes correspond to a change from mixed inter- and transgranular frac-
ture mode at 300 K to all intergranular fracture at > 1373 K, and the onset of de-
FIGURE 6.5 Fracture toughness of SiC as a function of test temperature. (A) For
crystals: NB data of Henshall et al. [49] and indent data of Guillou et al. [52] for
different (shown) crystal orientations. (B) Indent data of Naylor and Page [50] for
hot pressed SiC. Note the (1) broad range of values at 22°C, which are some-
what to substantially higher in comparison to single crystal values from fractogra-
phy and from comparison to polycrystalline values [51], (2) differing temperature
trends in (A), limited in crystal values at 22°C, but they are nearly as high as most
polycrystalline values, but with opposite temperature trends, and (3) the unusu-
ally high polycrystalline values in (B).](https://image.slidesharecdn.com/mechanical-properties-of-ceramics-and-composites-120303143122-phpapp01/85/Mechanical-properties-of-ceramics-and-composites-364-320.jpg)
![364 Chapter 6
layed failure at ≥ 1273 K. Naylor and Page’s [50] indent tests of hot pressed SiC
from the same source (and Al2O3 additions), while much higher in values, show a
similar temperature trend.
In contrast to the above SiC hot pressed with Al additions, SiC densified
with B, B+C, or B4C additions (i.e. commonly commercially sintered α=SiC)
shows much less or no change of toughness (and often strength) to temperatures
of ∼ 1500°C. Thus, Evans and Lange [53] showed that DT toughness of com-
mercial sintered α-SiC increased slightly [∼ 10% to the limit of testing (1500°C)
in contrast to SiC hot pressed with Al2O3 additions, as was noted above]. Simi-
larly, Ghosh et al. [55] showed toughness measured by three techniques on the
same commercial sintered α=SiC all being constant between 3 and 4 MPa·m1/2
over the 20–1400°C range. Srinivasan and Seshadri [56] also showed (NB)
toughness constant at ∼ 4.8 MPa·m1/2 over this range when tested unoxidized in
an inert atmosphere, but with varying increases in toughness above 600 –1000°C
depending on testing in air or with prior oxidation of the samples (the latter giv-
ing greater increases). Popp and Pabst [57] corroborated that the toughness of
commercial sintered α–SiC was nearly constant to the limits of their testing of
1200°C (actually showing a few percent decrease from the value of ∼ 3.5
MPa·m1/2 at 22°C) with negligible difference as a function of strain rates in an air
atmosphere. This limited change was noted as correlating with the predominant
transgranular fracture mode reported to at least ∼ 1400°C. However, they
showed that while a reaction-processed SiC with ∼ 13% residual Si had a simi-
larly constant toughness at ∼ 4 MPa·m1/2 over the same temperature range in air
tested at high strain rates (1260 mm/min), it markedly increased by ∼ 200% from
∼ 900–1200°C at low strain rates (0.024 mm/min). These and the above results
are generally consistent with those for high-temperature slow crack growth,
which is discussed in the next section.
Kriegesmann et al. [58] corroborated that sintered and hot pressed SiC
having mainly transgranular fracture at elevated temperatures retains toughness
(and strengths) there, i.e. showed no decrease from values at ∼ 22°C to the limit
of testing of 1400°C. On the other hand, such bodies having mainly intergranular
fracture at elevated temperatures, while showing toughnesses (and strengths) es-
sentially the same as at 22°C at 800°C, showed decreases of 20–40% at 1400°C.
The bodies showing decreases included hot pressed material having the highest
strengths at 22 °C (by 12–16% versus the other two hot pressed materials and by
∼ 70% versus the sintered SiC) and included bodies made from either α= or β=
SiC powder. Bodies derived from either α or β powder showed that the SiC crys-
tal phase was not the determinant of the retention or loss of toughness or
strength. While the specific densification aids used were not disclosed, they did
note that the use of B or B-based aids corresponded with transgranular fracture
and toughness (and strength) retention at elevated temperatures versus alu-
minum-based aids correlated with increased intergranular fracture and toughness](https://image.slidesharecdn.com/mechanical-properties-of-ceramics-and-composites-120303143122-phpapp01/85/Mechanical-properties-of-ceramics-and-composites-365-320.jpg)
![Grain Effects on Thermal Shock Resistance 365
(and strength) decreases at elevated temperatures. These authors briefly dis-
cussed and showed micrographs of the microstructures of the bodies studied,
showing that all four bodies had G values averaging ∼ 4 µm, but with different
distributions of sizes, shapes, or both. Thus of the two hot pressed bodies, both
from α powder and with similar nominally equiaxed toughness (and strengths),
the one with larger isolated, equiaxed grains (e.g. to ∼ 5+ µm) had somewhat
lower toughness (∼13%) but higher strength (∼ 4%) at 22°C and no loss of
toughness (or strength) at elevated temperature. However, the body hot pressed
from β powder that had tabular grains (∼ 2 µm dia. and ∼ 5–10 µm long) had the
greatest strength at 22°C but ∼ 20% loss at 1400°C (toughness not measured).
B4C hot pressed without additives (P ∼ 0.08, G ∼ 5 µm) has been reported
to have toughness decreases of ∼ 30% from 22 to 1200°C by Hollenberg and
Walther [59]. While their toughness values appear low by ≥ 50%, the decrease
with temperature is similar to, but possibly somewhat greater than, the decrease
in E.
Next consider results for dense Si3N4. Naylor and Page [50], using an in-
dentation technique, reported toughness of CVD material (i.e. made without ad-
ditives, but quite possibly having some columnar or oriented grain structure or
both) decreasing by nearly 50%, e.g. from ∼ 5.6 MPa·m1/2 at 22°C to ∼ 2.9
MPa·m1/2 at 800°C, i.e. greater than expected for E. Data for dense sintered or
hot pressed Si3N4 and sialons also generally showed lower toughness at
1000–1100 than at 22°C, usually consistent with decreases in E, i.e. 10–20%
[60,61]. However, tests continued to higher temperatures typically show a subse-
quent increase to toughness maxima at 1200–1400°C [63], with the temperature
and extent of such maxima dependent on the type of toughness test, the strain
rate of the test, and the nature of the material. Ohji et al. [63], using Si3N4 hot
pressed with 3 and 5 wt% respectively of Al2O3 and Y2O3, showed the common
tendency for toughness to decrease little or not at all to > 1000°C and then to
show a modest maximum at ∼ 1200°C (while tensile strength had a small maxi-
mum at ∼ 1000°C); it had a substantial loading rate dependence, e.g. a maximum
at a displacement rate of 10–3 mm/min at 1260°C.
Finally, consider the temperature dependence of toughness of other single
crystals than Al2O3, MgAl2O4, and SiC presented earlier. NB data of Ingel et al.
[64] for Y-PSZ and Y-CSZ showed the former decreasing to a minimum at ∼
1000°C while the CSZ crystals probably reached a minimum at ∼ 600°C, both
subsequently increasing substantially with further temperature increases beyond
the minima (Fig. 6.6). The latter increase was attributed to plastic deformation,
e.g. as shown by macroscopic deformation, especially in the CSZ, and higher
toughness values at higher strain rates at high temperatures. This is in contrast to
a similar but continuing decrease of the toughness of a commercial Mg-PSZ (and
associated intergranular fracture). In all three cases the decreases are more than
expected from E decreases, but possibly more for the two PSZ materials, which](https://image.slidesharecdn.com/mechanical-properties-of-ceramics-and-composites-120303143122-phpapp01/85/Mechanical-properties-of-ceramics-and-composites-366-320.jpg)
![366 Chapter 6
FIGURE 6.6 Fracture toughness (NB) of ZrO2 single crystals partially and fully
stabilized with Y2O3 (stress axis probably ∼ <110>), as well as for a commercial
Mg-PSZ material, versus test temperature. (From Ingel et al. [64], published with
permission of the Journal of the American Ceramic Society.) Also note indent
data of Guillou et al. [52].
must reflect added decreases due to decreasing effects of transformation tough-
ening. Note also (1) Ingel et al. reported DCB tests at 22°C giving toughnesses
of 3–6 and ∼ 1.5 MPa·m1/2 for respectively PSZ and CSZ crystals, and (2) Guil-
lou et al. [52] showed indentation toughness of Ca-CSZ crystals (14 m/o CaO,
-
indented on {111} planes with <110> cracks decreasing from 1.32 to 0.48
MPa·m for T = 22 to 800°C, i.e. consistent in this trend with the Y-PSZ crystal
1/2
data).
Ball and Payne’s [65], NB tests of quartz crystals of differing orientations
showed toughness decreasing from ∼ 0.8 MPa·m1/2 to a minimum of ∼ 0.6
MPa·m1/2 at ∼ 200°C and then increasing with further temperature increase (indi-
cating limited effects of differing orientations, Chap. 2, Sec. III.B). Guillou et al.
[52] also measured Vickers indentation toughness of MgO crystals for
{100}<100> fracture showing a decrease from 1.7 MPa·m1/2 at 22°C to a mini-
mum at ∼ 250°C and then a maximum of ∼ 1.3 MPa·m1/2 at ∼ 250°C and then a
maximum of ∼ 1.9 MPa·m1/2 at ∼ 350°C with an ∼ 20 N load, with less pro-](https://image.slidesharecdn.com/mechanical-properties-of-ceramics-and-composites-120303143122-phpapp01/85/Mechanical-properties-of-ceramics-and-composites-367-320.jpg)
![Grain Effects on Thermal Shock Resistance 367
nounced changes, higher minimum, and lower (e.g. 10%) maximum values at an
∼ 3 N load. Mah and Parthasarathy [66] showed that SENB toughness of YAG
single crystals increased from 2.2 MPa·m1/2 at 22°C to 4.5 and 5.5 MPa·m1/2 at
1600°C respectively in air and vacuum, with most of the increases above 1200°C
and no significant orientation dependence.
The above review shows that crystal toughnesses often increase substan-
tially at high temperatures due to plastic flow and less disparity between differ-
ent fracture toughness tests and some of these with strength results, especially in
their G dependence, as is commonly found in testing at or near room tempera-
ture. However, as is discussed later, this often has little or no relevance to high-
temperature toughness of polycrystalline bodies, where grain effects, especially
grain boundary sliding and failure, dominate, e.g. as indicated by the continued
decrease in polycrystalline PSZ toughness (Fig. 6.6). Toughness and strength
testing of bodies, especially single crystals showing substantial crack tip and
even bulk plasticity (e.g. Fig. 6.6), indicate more consistent agreement regarding
the onset and effects of such plasticity. However, caution and the need for more
comparative testing is indicated by results of Hirsch and Roberts [67], who used
toughness tests to determine the ductile–brittle transition in single crystals of Si.
They found that this transition varied by up to 250°C between DCB and indenta-
tion fracture tests. The presence of dislocations at or near the crack tip due to the
indent was an important factor in lowering the ductile–brittle transition tempera-
ture, e.g. polishing off most of the indent raised the transition temperature 50°C
and abrading the area lowered the temperature 40°C.
B. Crack Propagation as a Function of G and Temperature
Slow crack growth (SCG) measurements at elevated temperatures typically
use the same types of tests as are used for SCG due to environmental effects
at room temperature and the same equation, i.e. Eq. (2.3), with the exponent n
thus again being used as a value to characterize the process, as was discussed
by Evans [68]. However, the first and most general of two aspects of such data
is serious limitations of specific effects as a function of G or other grain para-
meters, and quantitative effects of grain boundary phases. Second is the tran-
sition from one mechanism to another as T increases, which, while aided by
the common use of the same equation for various mechanisms of slow crack
growth, has been widely neglected. Thus data is almost exclusively for room
temperatures or at high temperatures where SCG due to grain boundary slid-
ing dominates. However, Evans and Lange [53] showed that DT toughness of
commercial SiC hot pressed with Al2O3 addition (having room temperature
SCG due to moisture giving n ∼ 80 with activation energies characteristic of
stress corrosion processes) was disappearing, i.e. n > 200, at 600°C. On the
other hand, SCG was again clearly evident by 1400°C (n ∼ 21), but of a dif-](https://image.slidesharecdn.com/mechanical-properties-of-ceramics-and-composites-120303143122-phpapp01/85/Mechanical-properties-of-ceramics-and-composites-368-320.jpg)
![368 Chapter 6
ferent sort, i.e. characterized by much higher activation energies characteris-
tic of plastic flow via grain boundary sliding.
The above high-temperature SCG is a highly thermally activated process,
as is indicated in Fig. 6.7, which shows the range of commonly encountered n
values. A greater degree of oxidation in more oxidizing atmospheres for oxidiz-
able materials also increases the rate of crack growth. The substantial changes
with temperature, and sometimes atmosphere, commonly mask effects of G and
related parameters, especially when they do not encompass substantial changes.
However, the extent of slow crack growth in a given specimen can often be
clearly revealed by the predominant intergranular fracture mode on the subse-
quent fracture surface where the remaining fracture mode is partly, often mostly,
transgranular. Some of this demarcation by fracture mode change may be visible
on elevated temperature fracture, if not obscured by oxidation of nonoxide frac-
tures. However, it is commonly particularly pronounced on fractures that were
later completed at lower, especially room, temperature after the high-tempera-
ture slow crack growth [63]. Fig. 6.8 gives examples of this for SiC. Note also
FIGURE 6.7 Plot of high-temperature slow crack growth n values [per Eq. (2.3), v =
AKn] versus the inverse test temperature (in K). Note the effect of test atmosphere,
mainly the degree of its oxidation potential (solid symbols for simulated turbine at-
mosphere, others for non-oxidizing atmosphere). (Original data from Evans [68] and
Henshall et al. [54]).](https://image.slidesharecdn.com/mechanical-properties-of-ceramics-and-composites-120303143122-phpapp01/85/Mechanical-properties-of-ceramics-and-composites-369-320.jpg)
![Grain Effects on Thermal Shock Resistance 369
FIGURE 6.8 Examples of high-temperature slow crack growth in true tensile
tested hot pressed SiC. SEMs showing regions of high temperature SCG
(rougher areas outlined by dashed white lines) exposed by subsequently com-
pleting fracture at room temperature, with indicated temperatures and
stresses. (From Ref. 69, published with permission of Brook Hill Publishing
Company.)
that examining specimen surfaces after high-temperature stressing can also re-
veal other sites and approximate extents of high-temperature slow crack growth.
Turning to specific cases, static and cyclic crack growth studies of a com-
mercial (AD-998) alumina (G ∼ 5 µm) at 1200°C by Lin et al. [70] again showed
mainly intergranular fracture, usually along a single crack due to SCG, but under
some conditions growth of more than one crack was indicated. They also indi-
cated some contribution of glassy phase bridging despite the very low level of
such material in this 99.8% pure body. Horibe and Sumita [71] studied high tem-
perature static and dynamic crack propagation fracture stress of two SiC bodies
densified with B + C additions for two powders differing mainly in their contents
of SiO2 (0.34 vs. 0.53 w/o) and Al (0.03 vs. 0.39 w/o). While some results are
complex, their overall conclusion was that the higher Al content correlated with
greater creep and lower strength at 1500°C, i.e. consistent with effects of Al2O3
additions in the previous section.
Baumgartner reported SCG of dense sintered TiB2 in molten Al at ∼ 970°C
(of interest for possible use of TiB2 as electrodes for Al refining) based on both
DT [72] and dynamic fatigue [73] tests (see Fig. 20 for σ–G–1/2 data). DT tests
showed no SCG in purer, finer G (< 10 µm, P ∼ 0.01) but definite SCG in larger
G (∼ 20 µm, P ∼ 0.02) with more impurities (especially ∼ 0.3 w/o oxygen),
where the intergranular penetration of Al was accompanied by cell impurities of](https://image.slidesharecdn.com/mechanical-properties-of-ceramics-and-composites-120303143122-phpapp01/85/Mechanical-properties-of-ceramics-and-composites-370-320.jpg)
![370 Chapter 6
Fe, Si, and P. Dynamic fatigue tests conducted on higher purity TiB2 [74] as a
function of a wider range of G showed limited intergranular penetration of
molten Al into the TiB2, but no intergranular crack growth, i.e. transgranular
fracture from surface connected, e.g. processing, flaws. However, dynamic fa-
tigue tests were consistent with changing behavior as a function of G, showing
generally increasing negative n values [i.e. of Eq. (2.3)] of ∼ 30–80–100 as G in-
creased from ∼ 1–3 µm and then becoming increasingly positive values of 44
and 53 as G increased to ∼ 10 and then 17 µm. Baumgartner argued that the fail-
ure process was liquid metal embrittlement, i.e. a lowering of strength due to
lowered toughness from the presence of liquid Al at the crack tips, instead of
stress corrosion, which entails lowering of strength due to SCG. He also sug-
gested that the trend in n values could be explained by possible competition of
plastic blunting of cracks decreasing as G increased, i.e. mainly in finer G,
stronger bodies, versus liquid metal embrittlement via reduced toughness at the
crack tip. Thus the latter would be mainly operative in the absence of crack tip
blunting in larger G bodies, where microcracking from TEA stresses was also
present and probably contributing, especially in the largest G body.
Of the few studies of crack propagation and fracture energy and toughness
in graphite, one examined crack propagation as a function of temperature and
environment (e.g. atmospheres of H2O, CO, or He). Thus Freiman and Mechol-
sky [75] showed that both an isotropic (POCO-AXF-5Q) and an anisotropic
(ATJ-S) graphite exhibited stable crack propagation to respectively ∼ 800 and
1600°C in H2O, CO, or He atmospheres. Above these temperatures crack propa-
gation was catastrophic. They attributed the stable crack propagation to stress
corrosion due to H2O in the pores (hence explaining no influence of the external
test atmosphere, and consistent with strength results). They showed fracture en-
ergies in both materials increasing by of the order of 50% and fracture tough-
nesses by about 20% from 22 to 1400–1600°C. Similarly Sato et al. [76] showed
fracture toughnesses of their three ∼ isotropic (molded) and one anisotropic (ex-
truded) graphites increasing by respectively ∼ 50 (for the anisotropic, extruded
material) and > 80% to maxima at ∼ 2100°C or at, or beyond, their maximum
test temperature of 2600°C. These changes are substantially more than they
found for Young’s modulus of these same graphites (and about the same or inter-
mediate for tensile strength), but similar in overall trend. Extruded material had
the lowest toughness and the least increase, consistent with its measurement be-
ing with the oriented grains versus those of the molded graphites being across
the grain orientation.
Turning to discussing the grain structure dependences of toughness and
crack propagation as a function of temperature, there is limited data on the basic,
intrinsic factors of this, namely grain size (G), as well as shape and orientation.
Further, such possible grain effects are compromised by the frequent dominant
effect of grain boundary effects, since small amounts of grain boundary phases](https://image.slidesharecdn.com/mechanical-properties-of-ceramics-and-composites-120303143122-phpapp01/85/Mechanical-properties-of-ceramics-and-composites-371-320.jpg)

![372 Chapter 6
exclusively transgranular, or (2) extrinsic, due to grain boundary character, usu-
ally phases, if the failure initiating flaw (and also possibly surrounding) fracture
mode is mainly or exclusively intergranular as shown by Rice and Wu [77]. Thus
they showed that such tests, while corroborating SCG in silicate glasses and
Al2O3, showed increasing SCG in CeO2, Y2O3, ZrO2, and TiO2 respectively,
while no SCG occurred in refractory borides, carbides, and nitrides such as TiB2,
ZrB2, SiC, TiC, ZrC, AlN, and Si3N4, which in pure form (e.g. from CVD) exhib-
ited more or exclusive transgranular fracture, unless there was sufficient oxide
containing grain boundary phase and resultant substantial to exclusive intergran-
ular fracture. There can also be special cases where there are environmental in-
teractions with slip or twinning that may affect strengths, but these are mostly
uncertain and limited.
Turning to specific σ–G–1/2 data, Figure 6.9 summarizes much alumina
data at –196 versus 22°C [2,3,31,78–85], which while scattered shows a trend
for higher strengths at –196°C, especially when data from the same investigators
and bodies are compared, e.g. that of Charles [86] and Gruver et al. [84]. Overall
this shows (1) the same two-branch σ–G–1/2 behavior, (2) both with finer grain
size σ–G–1/2 slopes > 0. (3) single crystal strengths > many polycrystalline sam-
ples with similar surface finishing [2,78–82], and (4) greater single- and poly-
crystal strengths at –196°C versus 22°C. While some data, e.g. for press forged
Al2O3 [3,83], does not clearly show increases at –196°C vs. 22°C due to scatter
and the limited extent of the data, specific comparisons more clearly show sin-
gle- and polycrystal strength increases. Thus Heuer and Roberts [80,87] showed
sapphire strength increasing ∼ 35–50% in liquid N2 (–196°C) vs. 22°C in air for
various surface finishes. Other investigators [89–91] showed similar increases,
but Charles [86] showed a 75% increase. For dense hot pressed Al2O3 tested at
–196°C, Rice [2] showed a 30% strength increase for most grain sizes but a 45%
increase for G = 1–2 µm. Similarly, Charles showed ∼ 20% strength increase for
lamp envelope Al2O3 (G ∼ 6–150 µm), Neuber and Wimmer [81] a ∼ 30% in-
crease for 99.5% Al2O3 (porosity, P, ∼ 0.05, G ∼ 35 µm), Davidge and Tappin
[82] a ∼ 25% strength increase for 95% Al2O3, P ∼ 0.07, G ∼ 8 µm, and Gruver et
al. [84] a ∼ 30% increase for 96% Al2O3, P ∼ 0.05, G ∼ 7 µm (Fig. 6.9) in liquid
N2 vs. air at 22°C. Overall the polycrystalline strength increase is probably less
than for sapphire (except possibly at G ∼ 1–2 µm), reinforcing sapphire strengths
being even > many polycrystalline values at –196°C versus 22°C. Tests in the
absence of H2O at 22°C (e.g. in vacuum) showed that much, but not all, of the in-
crease in strength at –196°C is due to the elimination of slow crack growth
(SCG). Thus Charles showed sapphire strength increased only ∼ 17% at –196 vs.
22°C but decreased ∼ 50% in wet air vs. vacuum at 22°C, while lamp envelope
Al2O3 (G ∼ 40 µm) showed only about an 8% increase and an ∼ 44% decrease re-
spectively; i.e. indicating less increase in liquid N2 but similar decrease in wet air
to that of sapphire. He also showed an ∼ 20% increase in 22°C (air) strength for](https://image.slidesharecdn.com/mechanical-properties-of-ceramics-and-composites-120303143122-phpapp01/85/Mechanical-properties-of-ceramics-and-composites-373-320.jpg)
![Grain Effects on Thermal Shock Resistance 373
FIGURE 6.9 Comparison of σ–G–1/2 data, mainly for hot pressed and pressed
forged, Al2O3, at (A) – 196°C and (B) 22°C. For reference, the range of data from
an earlier survey [1] of data at 22°C is shown in (A) and the mean trend line for
actual data at –196°C from (A) is shown in (B) as a dashed line. Note the (1) gen-
erally lower strengths of the author’s specimens made from Linde B versus Linde
A powders, (2) greater scatter and possible lower strength level of the pressed
forged vs. hot pressed Al2O3 , the latter mainly at finer G (∼ 10 µm), (3) single
crystal strengths being higher than much of the polycrystalline data at –196 and
22°C, and (4) direct comparison of Charles [86] and Gruver et al.’s [84] data (the
latter labeled Kirchner) at both temperatures. (From Rice [1], published with per-
mission of the Journal of Materials Science.)
a substantial G range (∼ 6–150 µm) at a strain rate of 2.7 × 10⁻⁴ vs. 1.4
×10–2/min. The lower strengths of bodies made from Linde B powder may reflect
more anion impurities [1], while some lower strengths and greater scatter of
press forged specimen strengths probably reflects more variation in grain size
shape and orientation, and possibly of residual stresses.
Assessing whether the absence of SCG at –196°C shifts the G depen-
dence of strength, e.g. due to possible effects of G on SCG (Fig. 2.8), is difficult
due to the variations noted above, as well as complexities of the actual SCG.
Thus the occurrence of SCG in single crystals, at rates generally similar to those
of polycrystalline Al2O3 [92] (Chap. 2, Sec. III.B) indicates that transgranular](https://image.slidesharecdn.com/mechanical-properties-of-ceramics-and-composites-120303143122-phpapp01/85/Mechanical-properties-of-ceramics-and-composites-374-320.jpg)
![374 Chapter 6
SCG can occur in polycrystalline materials and thus may not impact the sin-
gle–polycrystal strength balance. While SCG occurs in sapphire, the first of two
complications is that sapphire SCG has been measured on only a few fracture
planes, and the extent of less, or no, SCG on other planes is not known. Second
and more basic is that SCG in polycrystalline Al2O3 is mainly or exclusively by
intragranular fracture (which may reflect the preceding complication), espe-
cially at finer grain sizes (Fig. 2.6) in contrast to more transgranular fracture
commonly observed in fast fracture, and may decrease with decreasing G (Fig.
2.8). Changing SCG as a function of G could change the intersection and slopes
of the two branches of the σ–G–1/2 behavior.
McMahon [93] showed strength of sintered, high Al2O3 bars at 22°C being
a function only of surface finish and relative humidity (to 70%) during the test,
and not of prior humidity exposure. He showed that the relative level of strength
and its decrease due to H2O varied as follows for different specimen surface con-
ditions: (1) as-fired surfaces gave the lowest strength and the least (∼ 5%)
strength decrease, (2) surfaces ground perpendicular to the specimen axis gave
intermediate strengths and the greatest (∼ 15%) decrease, and (3) surfaces
ground parallel with the specimen length gave the highest strength and an inter-
mediate strength decrease with increasing relative humidity. Thus the relative
strength decrease with increasing humidity was a function of surface finish as
well as moisture content. Rice [80] showed that dense, hot pressed Al2O3 aver-
aged ∼ 20% strength decrease on testing in distilled H2O vs. air at 22°C, but that
retesting in air of bar sections previously tested in H2O (after drying) returned
them to their original air strength. These two studies show that strength degrada-
tion due to SCG occurs during actual loading and is a function of the environ-
ment only during stressing. This implies that SCG either does not occur due to
microstructural (e.g. thermal expansion anisotropy, TEA) stresses or that it satu-
rates (at least for typical multigrain size flaws) after initial exposure.
SCG also occurs in polycrystalline BeO [94] where the specifics of the
SCG fracture mode are poorly documented (the overall fracture mode for tests in
air at 22°C is predominantly transgranular). While SCG does not occur in some
single crystals such as MgO and apparently ZrO2 [77], it can occur intergranu-
larly in MgO, as shown by Rhodes et al. [95]. More SCG in finer versus larger
grain MgO (∼ 25 µm vs. ∼ 45 µm) is uncertain because of impurity differences
but may imply a grain size effect in view of there typically being thicker grain
boundary phase as grain size increases. Whether there are intrinsic differences in
SCG rates between materials exhibiting only intergranular versus at least some
transgranular SCG is unknown. In contrast to the above oxides, fast fracture in a
Mn-Zn ferrite [96] was mainly by intergranular fracture, while SCG occurred
mostly by transgranular failure, especially with G ∼ 45 µm and somewhat less
with G ∼ 35 µm with more grain boundary (e.g. Ca) phase, again suggesting pos-
sibly greater effects at finer grain size (Chap. 2, Sec. III.B and Chap. 2 end note).](https://image.slidesharecdn.com/mechanical-properties-of-ceramics-and-composites-120303143122-phpapp01/85/Mechanical-properties-of-ceramics-and-composites-375-320.jpg)
![Grain Effects on Thermal Shock Resistance 375
Li ferrites show SCG, which has also been reported to be sensitive to losses of Li
on firing [97], which may imply gradients of stoichiometry between grain
boundaries and the rest of the grain, which could be a factor in changing fracture
modes and in possible grain size effects. Significant decreases in Young’s modu-
lus and internal friction increases of HfO2 [98] occurred upon opening the vac-
uum furnace (after sintering or heat treating for grain growth), saturating after
only ∼ 2 days; thus indicating microcracking from TEA stresses alone and SCG
saturates in limited time in the absence of an applied stress.
Though noted in Chap. 2, Sec. III.B, it is again worth noting that corroding
species which do not lead to SCG may also reduce strengths. Thus CaO and
MgO crystals do not exhibit SCG due to H2O, which attacks them independent
of stress to produce hydroxides, whose expanded volume, when this occurs in
constrained locations, especially pores or cracks, results in fracture due to re-
peated stages of stress buildup and release by cracking over days to weeks for
CaO and much longer for MgO. Similar effects occur in polycrystalline bodies,
where pores accessible from the surface are also important sources of this hydra-
tion damage. Possibly more extreme is the substantial to complete degradation
of some TZP bodies over certain ranges of Y2O3 contents and G (Fig. 2.9).
Regarding nonoxides, SCG has been shown in some halide single crys-
tals, e.g., AgCl and CaF2, the latter also showing probable effects of slip limit-
ing the extent of SCG, e.g. via easier arrest of cracks [92]. SCG in
polycrystalline MgF2 and ZnSe being 100% intergranular (whereas fast frac-
ture is essentially 100% transgranular) indicates grain boundary control of
SCG in these materials. McKinney et al. [99] reported essentially no SCG with
large-scale cracks, e.g. DCB or DT tests, in various Si3N4 materials and no
small-scale SCG (i.e., no delayed failure in pure Si3N4, made by either CVD or
reaction sintering), but clear delayed failure in Si3N4 made with oxide addi-
tives (with the extent of SCG generally increasing with the amount of oxide
additive) via all intergranular fracture. They attributed this large vs. small
crack behavior to oxide distribution along grain boundaries, i.e. maintaining
that of the many flaws available on the surface for SCG, at least one could al-
ways be found that had sufficient contiguity of grain boundary oxides for suffi-
cient SCG to lower strength. On the other hand, large cracks, as used in a DCB
test, covered too broad a range of grain boundaries, many of which may not
have sufficient contiguity of oxide content to allow continuous SCG. Recently
SCG has been reported (via essentially 100% intergranular fracture) in AlN
[100,101] on a similar or lower level than in Al2O3, with the extent of SCG ap-
parently correlating with the residual oxide grain boundary content [92]. While
there appears to be intrinsic SCG in carbon materials [75,92], SCG does not
appear to occur in carbides, e.g. B4C, SiC, TiC, and ZrC (or borides, e.g., TiB2
and ZrB2) unless sufficient grain boundary phase (e.g. oxide) is present to pro-
vide the material and path for SCG [77,99]. Thus SiC made with oxide addi-](https://image.slidesharecdn.com/mechanical-properties-of-ceramics-and-composites-120303143122-phpapp01/85/Mechanical-properties-of-ceramics-and-composites-376-320.jpg)
![376 Chapter 6
tives shows SCG, but not SiC made with B-C additions or by CVD (i.e. with-
out additives), i.e., paralleling the Si3N4 results. This is corroborated by such
materials showing no SCG exhibiting predominant to exclusive.
As test temperatures increase, e.g. to and beyond a few hundred degrees C,
the amount of active species such as H2O is commonly reduced, reducing the
amount of SCG. However, in some cases active species may be contained in
pores, causing SCG at high temperatures independent of the external test envi-
ronment, as was indicated earlier in graphites. On the other hand, at higher tem-
peratures other species may cause corrosive damage or SCG, e.g. due to their
liquefaction (hence mobility), increased reactivity, or both. As noted in the previ-
ous section, oxidation of nonoxide materials can be an important manifestation
of this, especially if either there is a grain boundary phase that will combine with
the oxidation product, e.g. to form a softer, more reactive glass, or the nonoxide
produces oxide liquid or glassy phases, e.g. B2O3 or SiO2.
B. Effects of Grain Size on Strength of Al2O3 (and Ice) at Elevated
Temperatures
Increasing temperatures above 22°C in air generally decreased sapphire strength
[26,29,85–91,102–104] often drastically, e.g. losing 1/3 to 3/4 of its strength at
22°C upon reaching a minimum at 400–600°C depending on orientation (Fig.
6.1), surface finish, and test environment. Hurley [103] observed a rapid strength
-
decrease from 22 to ∼ 400°C for both, <1120>and c-axis (<0001>) filaments and
then a plateau to ∼ 700 and 900°C respectively before rapidly decreasing again.
(However, compression testing of sapphire rods of the same orientations showed
respectively a slow decrease, similar to that for Young’s modulus, and then a
very rapid decrease starting at ∼ 800°C.) The level and especially the tempera-
ture of the strength minimum can be affected by other parameters. Charles [86]
showed a strength minimum at ∼ 900°C for sapphire tested in air as-annealed
(1200°C) vs. 400–600°C for mechanically finished surfaces. These tests in vari-
ous atmospheres showed sapphire strength decreasing by ∼15% to a minimum at
∼ 600°C in vacuum with less decrease in dry or wet H2 (but strength ∼ 20%
lower in dry H2 than in vacuum and ∼ 20% lower for wet versus dry H2) before
all merging together at ∼ 900°C. Iwasa and Bradt’s [26] (indentation-fracture)
fracture toughness tests of sapphire oriented for basal or rhombohedral fracture
showed similar trends; i.e. decreasing ∼ 25 and 75% to minima at ∼ 800 and
1000°C respectively (Fig. 6.1). (Their KIC tests of sapphire oriented for fracture
on A or M planes follow the decreases of Young’s moduli with increasing tem-
perature.) Less strength decrease, i.e. a higher minimum strength (but at a some-
what lower temperature) was indicated in one [89] but not another [91] test of Cr
doped sapphire. However, Sayir et al. [104], who observed strength minima at
300°C and maxima at 900°C in undoped sapphire, reported that 500 ppm MgO](https://image.slidesharecdn.com/mechanical-properties-of-ceramics-and-composites-120303143122-phpapp01/85/Mechanical-properties-of-ceramics-and-composites-377-320.jpg)
![Grain Effects on Thermal Shock Resistance 377
or TiO2 (separately or combined) doping eliminated the minima and maxima.
Carniglia’s surveys [105,106] of the σ–G–1/2 behavior of Al2O3 showed
strengths of finer grain size, dense bodies at 400°C ∼ the same as at 22°C and
then decreasing at a moderate rate up to 1000–1200°C and more rapidly beyond
1200°C. Differentiation of strength as a function of temperature in the larger
grain size region was even more moderate. (Correcting for Carniglia’s failure to
plot all data at 22°C and erroneously plotting some data at higher strength re-
duces the limited differentiation his plot showed between fine grain bodies at 22
and 400°C.) Charles’ [86] testing of lamp envelope Al2O3 (G ∼ 40 µm) showed
strength ∼ constant from ∼ 200–600°C and then dropping gradually (e.g. ∼
5%/100°C) in vacuum, while tests in dry and wet H2 (the latter again at lower
strength levels as for sapphire) showed a strength minimum at ∼ 400°C and a
maximum at ∼ 1100°C. Neuber and Wimmer’s [81] air testing of a ≥ 99.5%
Al2O3 (P ∼ 0.05, G ∼ 35 µm) showed distinct strength minima (at ∼ 400°C) and
maxima (at ∼ 800°C, Fig. 6.12) for each of four sets of rods having diameters of
2–8 mm, with the strength levels slightly lower for each increase in diameter.
Kirchner et al. [107,108] also showed a definite strength minimum at ∼ 400°C
for their dense hot pressed Al2O3, tested as-polished, or strengthened by surface
compression from quenching in silicone oil. The quenched material also
showed a strength maximum at ∼ 800°C; however, there was substantial scatter
in both the maxima and minima for their bodies. While Jackman and Roberts
[91] clearly showed such maxima and minima for single crystals, their tests of a
99.3+% Al2O3 (P ∼ 0.05, G ∼ 50 µm) showed only an uncertain indication of a
strength minimum at ∼ 500°C. Mizuta et al.’s [109] HIPed, transparent Al2O3
(uniform G ∼ 1–2 µm) showed no maxima or minima; instead strength was ∼
constant at ∼ 780 MPa to > 1000°C and then dropped to ∼ 700 MPa at 1100°C.
Thus such minima, maxima, both, or a plateau at intermediate temperatures are
shown in almost all [80,87,88,90,110] (Fig. 6.12) but not all [80,103] Al2O3
studies.
Al2O3 σ–G–1/2 data [84,85,88,89,111–113] at 1200–1315°C (Fig. 6.10)
shows similar two-branch behavior but with lower strength (e.g. ∼ 50%, possi-
bly more at fine grain size) than at 22°C, with reasonable agreement between
different studies. Again, higher single crystal than many polycrystalline
strengths are seen, as is a σ–G–1/2 slope > 0 at finer grain size. While
strength–temperature data for bodies of various grain sizes shows the overall
expected strength decrease with increasing grain size, there is commonly a lim-
ited maximum, or at least ∼ a strength plateau over a significant intermediate
temperature range (Fig. 6.11).
Impurities or additives may or may not have significant effects in this tem-
perature range. Thus there was no effect of AlON additions (other than via grain
size) on strength (or KIC) to at least 800°C [114] nor of CaO [31]. Crandall et al.
[85] showed similar trends for Al2O3 hot pressed with or without 3% SiO2 (Fig.](https://image.slidesharecdn.com/mechanical-properties-of-ceramics-and-composites-120303143122-phpapp01/85/Mechanical-properties-of-ceramics-and-composites-378-320.jpg)
![378 Chapter 6
FIGURE 6.10 σ–G–1/2 data, mainly for hot pressed and pressed forged Al2O3 , at
1200–1315°C. Note the general consistency of data from different sources and its
indication of a two-branch σ–G–1/2 relationship with the finer G branch having pos-
itive slope, and the generally lower strengths relative to those for single crystals.
(Published with permission of the Journal of Materials Science.)
6.11). However, typical commercial (sintered) Al2O3 having an SiO2-based (usu-
ally) glass phase commonly shows an intermediate (strain-rate-,composition-
and possibly P-dependent) strength maximum at 700–1100°C, and then greater
strength decreases [83,110] at higher temperature.
Al2O3 based polycrystalline fibers show similar strength–temperature
trends. Tests of pure α–Al2O3 (Dupont FP) and Al2O3-SiO2 fibers show the same
strengths at 22° and 800°C, only moderate (∼ 10%) decrease by 1000°C, and
then a more rapid decrease [115-117] (Fig. 6.12). Al2O3-20% ZrO2 fibers show ∼
10% higher strength at 800°C before dropping back to the same strength of 22°C
at ∼ 1000°C (and more rapid decrease at higher temperatures. Neither set of
fibers was tested at 22°C < T > 800°C).
The above strength changes with increasing temperature (T) are put in
broader perspective by comparing single- and polycrystal Al2O3 (including fiber)
strength normalized by their values at 22°C, along with similar Young’s modulus
(E) and KIC normalization (Fig. 6.12). This shows the well-known steady E–T](https://image.slidesharecdn.com/mechanical-properties-of-ceramics-and-composites-120303143122-phpapp01/85/Mechanical-properties-of-ceramics-and-composites-379-320.jpg)
![Grain Effects on Thermal Shock Resistance 379
FIGURE 6.11 Flexure strength versus test temperature for different Al2O3 bodies
reflecting primarily different grain sizes and secondarily some composition and
processing differences. Note that the solid symbol of Crandall et al. [84] is for
Al2O3 + SiO2, and that the open symbol is for pure Al2O3, as is all other data ex-
cept that of McLaren and Davidge [110]. (From Rice [1], published with permis-
sion of the Journal of Materials Science.)
decrease of 10–20% for both single- and polycrystals by 1200°C [108–120].
This is in marked contrast to a typically much faster initial decrease of both rela-
tive crystal KIC and strength (typically oriented for basal or rhombohedrahl frac-
ture), toward minima at ∼ 400–800°C and then rising to pronounced strength
maxima that can be ≥ to that at 22°C and then falling (rapidly). While absolute
strength values vary as expected (e.g. with surface finish), these trends occur for
crystals of various orientations [80,89,91] and machining [80,89], as well as as-
grown (0°) crystal filaments [102]. Again, while sapphire strength values are
higher when H2O is not present, or with reduced activity, the trends are also rela-
tively independent of the environment, since the basic trends are similar, whether
the testing is done in vacuum or in air. Most polycrystalline tests at T > 22°C, <](https://image.slidesharecdn.com/mechanical-properties-of-ceramics-and-composites-120303143122-phpapp01/85/Mechanical-properties-of-ceramics-and-composites-380-320.jpg)
![380 Chapter 6
FIGURE 6.12 Relative Young’s modulus (E), fracture toughness (KIC), and
strength (σ) of single and polycrystalline Al2O3 versus test temperature (normal-
ized by taking the property value at 22°C = 1). X following the property designa-
tion (E, KIC, and σ) designates single crystal values (followed by the crystal
orientation in ( ) if known). Numbers following the property and crystal designa-
tions give the source of the data (from listing, upper right). For polycrystalline val-
ues, grain sizes are shown in ( ) where pertinent and available. Curves
designated σt are for true tensile testing of fibers (FP, a coarser grain pure alu-
mina and PDR, a finer grain alumina-zirconia fiber). While most tests were in air,
some were in vacuum or liquid N2. Note the change in scale between relative val-
ues of 0.8 and 1.1 in order better to differentiate the data there, and that E–T
trends, especially for single crystals, are a key basis of comparison. (From Rice
[1], published with the permission of the Journal of Materials Science.)](https://image.slidesharecdn.com/mechanical-properties-of-ceramics-and-composites-120303143122-phpapp01/85/Mechanical-properties-of-ceramics-and-composites-381-320.jpg)
![Grain Effects on Thermal Shock Resistance 381
800°C indicate a strength minimum at 400–600°C, and these and higher temper-
ature tests showed little or no relative strength decrease from 22°C levels until ∼
800°C and may often show a limited maximum at 600–800°C (also observed for
some fibers, tested in true tension, designated by σt in Figure 6.12, or flexure).
Typical ice, i.e. solid H2O, has several properties, including strength, simi-
lar to Al2O3. This includes their single crystal basal slip and associated large
strain rate sensitive yield drops, and scaling with the fraction of absolute melting
point (i.e. homologous temperature), e.g. compare Higashi’s [121] and Kron-
berg’s [122] data and effects of solid solution species (e.g. Jones and Glen
[123]). Thus Schulson et al.’s [124] strength for ice at –10°C (∼ 96% of the ab-
solute melting temperature) provides not only information for ice but also some
guidance for Al2O3. Their results showed a Petch-type relation for samples with
and without purposely introduced sharp cracks (Fig. 6.13), implying similar be-
havior at similar relative strain rates for Al2O3 without other significant effects,
FIGURE 6.13 Tensile strength of ice at – 10°C with a strain rate of 10–3/s. Note
the Petch behavior despite the testing being at > 96% of the absolute melting
temperature, implying analogous behavior in Al2O3. (From Ref. 124.)](https://image.slidesharecdn.com/mechanical-properties-of-ceramics-and-composites-120303143122-phpapp01/85/Mechanical-properties-of-ceramics-and-composites-382-320.jpg)
![382 Chapter 6
e.g. from grain boundary phases. Thus their results indicate that Al2O3 can have
brittle, Petch-type behavior at very high temperatures. Similarly, Dykins’ [125]
results show the ratio of tensile strengths of ice stressed parallel or perpendicular
with growth dendrites to be ∼ 3; with the latter strength decreasing from ∼ 1.4 to
0.9 MPa as the test temperature increased from –27 to –3°C which implies that
similar grain orientation effects can substantially impact the high temperature
strength of polycrystalline Al2O3.
C. Effects of Grain Size on Strength of BeO at Elevated
Temperatures
Bentle and Kneifel [126] showed polycrystalline BeO strength averaging ∼ 10%
greater at –196° than at 22°C in vacuum, suggesting a possible 15–30% increase
for grain sizes > ∼ 40 µm and a possible ∼ 5–10% decrease at grain sizes of
20–40 µm. They also showed that testing in air or water vs. vacuum at 22°C re-
duced strengths of BeO (G ∼ 20 µm) ∼ 8–10% and 15–20% respectively. Simi-
larly, Rotsey et al. [94] showed a strain-rate dependence of BeO (G ∼ ≤ 3 µm, P
∼ 0.04) indicating ∼ 30% strength decrease in water vs. air at 22°C for circum-
ferential ground (pressed) rods. Slightly higher strength but similar relative
changes were found in air but no change in silicone oil. Annealed samples had
higher strength and somewhat greater decreases (∼ 40%) for testing in air but de-
creased nearly 10% for tests in silicone oil.
BeO shows a typical Young’s modulus decrease with increasing tempera-
tures, e.g. ∼ 15% by 1200°C [118,119] (Fig. 6.14). Tests of (as-grown) single
crystals in vacuum at 500°C and 1000–1800°C [127] showed slip only at ≥
1000°C, with strengths following the decrease of Young’s modulus with tempera-
ture fairly closely. Carniglia’s earlier σ–G–1/2 surveys [105,106] of BeO showed
moderate or no strength decreases at fine grain sizes until > 800°C, with strength
possibly increasing at intermediate temperatures. Though there was less differen-
tiation of strengths versus temperature at larger grain sizes, there was even greater
indication of strength, first increasing with increasing temperature and then de-
creasing. Bentle and Kniefel’s [126] data for 500–1300°C almost always showed
a strength maximum at 500–1200°C which was > strengths at 22°C (Fig. 6.14).
Samples made with 1% MgO (G ∼ 60–150 µm) showed substantially lower
strength maxima. Such maxima were not seen for slightly less (∼99.3%) dense
samples (e.g. G ∼ 45 and 60 µm) or with greater impurity contents (mainly
5000–7000 ppm F) than those shown in Fig. 6.14 (99.7–99.8% dense); instead
strength was ∼ constant (e.g. 400–800°C). The tests of Chandler et al. [129] at
300–1200°C in air showed moderate (∼ 15–25%) relative strength maxima at
500–1000°C for 99.9% pure (UOX and HPA) (P ∼ 0.02–0.03, G ∼ 20 µm), while
a less dense (99.7%) pure (AOX) BeO showed σ–T closely following E–T trends.
However, the same AOX BeO with G ∼ 50 µm (P ∼ 0.04) showed a strength max-](https://image.slidesharecdn.com/mechanical-properties-of-ceramics-and-composites-120303143122-phpapp01/85/Mechanical-properties-of-ceramics-and-composites-383-320.jpg)
![Grain Effects on Thermal Shock Resistance 383
FIGURE 6.14 Relative Young’s modulus (E) and flexure strength (σ) for (as-grown)
single crystal and polycrystalline BeO (normalized by taking the value at 22°C =
1). Curve designations are analogous to those of Fig. 6.12. Note that Bentle and
Miller’s [127] and Bentle and Kniefel’s [126] tests were in vacuum (G ∼ 60 and 154
µm is with 1% MgO). Data of Fryxell and Chandler [128] is for both unoriented
(from AOX powder) and oriented grains (from UOX powder), and that E–T trends,
especially for single crystals, are a key basis of comparison. (From Ref. 1, pub-
lished with the permission of the Journal of Materials Science.)
imum at 1000°C, 35% > at 22°C, and UOX BeO with 0.5% MgO rising to a
slightly lower maximum. Fryxell and Chandler [128], using the same materials
and process, showed all specimens having a relative strength maximum at
500–800°C with the level of the relative maximum increasing with increasing
grain size from 7–10% (G ∼ 20 µm) through 20% (>G ∼ 50) to 40–43% (G ∼ 90
µm). There was typically a tendency for lower relative strength maxima with](https://image.slidesharecdn.com/mechanical-properties-of-ceramics-and-composites-120303143122-phpapp01/85/Mechanical-properties-of-ceramics-and-composites-384-320.jpg)
![384 Chapter 6
AOX BeO (no additive) than with UOX BeO (+0.5% MgO); the latter also
showed preferred orientation increasing with increasing grain size. The absolute
strength values were highest (∼ 200 MPa) for G ∼ 20 µm and intermediate for G ∼
50 µm bodies for both AOX and UOX, the latter showing ∼ 50 and ∼ 65% grain
orientation for the two grain sizes respectively. The ∼ 90 µm G bodies had
strengths of ∼ 100–130 MPa for AOX and ∼130–175 MPa for UOX with ∼ 80%
grain orientation. Relative strength maxima at intermediate temperatures were
also reported by Stehsel et al. [130] for three commercial cold pressed and one
commercial slip cast and fired BeO and two (both commercial) of four hot
pressed BeO samples tested. While the latter tests and those of Chandler and col-
leagues were in air, those of Bentle and Kniefel were in vacuum, indicating that
these trends (e.g. the maxima) are not due solely, if at all, to environmental (e.g.
H2O) effects. On the other hand, Carniglia et al. [131] showed strengths (in vac-
uum) of dense hot pressed BeO being ∼12% higher at –200°C vs. in air at 22°C (σ
∼ 270 MPa), and 45, 51, and 27% higher respectively at ∼ 550, 1000, and 1500°C.
D. Effects of G on Strength of CaO and MgO at Elevated
Temperatures
As noted in Chap. 2, Sec. III.B, KIC of MgO crystals increased in H2O (but not
DMF) [132]. Both Janowski and Rossi [133] and Rice [134] showed that MgO
crystal yield stresses decreased ∼ 20% and strength ∼ 15% (but with greater duc-
tility) in water versus in air at 22°C. Both showed that crystal pieces tested in
water returned yield and fracture stresses back to their original air tested levels
when retested (dried) in air. Thus SCG has not been observed in MgO single
crystals, but yield and fracture stress reductions have been, indicating enhanced
dislocation mobility (as does the increased toughness and ductility). On the other
hand, similar CaO crystal tests showed yield and fracture stresses increasing re-
spectively by ∼ 5–25% and 5–35% in water versus air at 22°C [134]. Testing
MgO crystals in liquid N2 raised yield stresses ∼ 80–130%, consistent with Cop-
ley and Pask’s [135] (compression) and Thompson and Roberts’s [136] tests and
fracture stresses 10–15% versus in air at 22°C. Corresponding CaO crystal in-
creases were ∼ 105% and 90% respectively. However, long-term exposure of
CaO crystals to liquid or vapor H2O results in propagation of cleavage cracks at-
tributed to the wedging action of resultant Ca(OH)2 in preexisting cracks [134].
Polycrystalline MgO tests by Janowski and Rossi [133] and Rice [134]
showed strengths lower (e.g. ∼ 15%) in water than in air at 22°C; i.e. very simi-
lar to crystal tests. Both also showed recovery of the strength loss on drying and
retesting in air. (Rice’s tests covered G ∼ 2–100 µm, showing no grain size
trend.) However, strength in air was only ∼ 10% lower than in liquid N2, i.e. only
∼ 10% of the difference found for single crystals. On the other hand, Rhodes et
al. [95] reported delayed failure in polycrystalline MgO [G ∼ 25–45 µm, P](https://image.slidesharecdn.com/mechanical-properties-of-ceramics-and-composites-120303143122-phpapp01/85/Mechanical-properties-of-ceramics-and-composites-385-320.jpg)
![Grain Effects on Thermal Shock Resistance 385
0–0.007, and ≤ 0.02–0.6% impurities]. While the two finer grain bodies (G = 26
and 30 µm) showed delayed failure at ∼ 50% of the inert strength (versus ∼ 80
and 70% for G = 46 and 43 µm respectively), they were also the lowest purity
(99.4 and 99.6 versus 99.98+ and 99.92% respectively). Thus they concluded
that purity was the dominant variable in SCG, which is consistent with most of
the impurities being at the grain boundaries with intergranular fracture (in con-
trast to mostly transgranular fracture in similar grain size bodies tested in air
[137]). They also observed a possible fatigue limit (∼ 80%) in the highest purity
body, which they postulated to be due to the absence of a continuous grain
boundary impurity film.
Recrystallized CaO crystal bars at ∼ 1100 and 1300°C showed little or no
strength decrease from 22°C. However, macroscopic yield frequently preceded
brittle, almost exclusively transgranular fracture [134]. Limited polycrystalline
MgO studies at moderate temperatures typically showed either an initial limited
strength rise to a maximum at 400–700°C (especially as grain size increased) or
a lower rate of decrease before more rapid strength decrease with increasing
temperature. These polycrystalline strength trends are also supported by data of
Evans et al. [138] (G ∼ 25 and 150 µm, particularly for chemically polished sam-
ples). MgO single crystals recrystallized by pressed forging or hot extrusion
[139,140] also showed little or no strength reduction with increasing tempera-
ture, some macroscopic yielding by ∼ 1300°C and extensively at ∼ 1500°C (but
maintaining transparency and subsequent brittle, cleavage, fracture). While hot
extruded MgO specimens from hot pressed and annealed billets showed similar
strength for the same grain size as from recrystallized crystals at 22°C, the for-
mer showed a greater strength decrease at 1540°C, and the recrystallized crystals
averaged ∼ twice the strength as hot extruded, hot pressed MgO. Similarly, while
the latter showed somewhat greater occurrence of grain boundary fracture at
22°C, it showed much greater frequency and amounts of this at higher tempera-
ture than the recrystallized crystals [139,140]. The above trends (which are con-
sistent with those of Day and Stokes [141], G ∼ 100 ± 50 µm, T ≥ 1700°C) are
put in better perspective by plotting properties normalized by their 22°C values
(Fig. 6.15). This shows (1) a moderate Young’s modulus decrease of 10–15% by
1200°C, (2) substantially faster yield stress decrease (for <100> stressing), (3)
strength ∼ constant or a strength maximum between 400 and 800°C, and (4) a
trend for less strength decrease and higher relative maxima at higher temperature
as grain size increases.
E. Effects of Grain Size on Strength of Other Cubic Single Oxides
ThO2, UO2, Y2O3, and ZrO2 at Elevated Temperatures
ThO2 shows positive σ–G–1/2 slopes for finer grains at 22 and 1000°C but some-
what higher strength at 1000 vs. 22°C across the grain size range studied](https://image.slidesharecdn.com/mechanical-properties-of-ceramics-and-composites-120303143122-phpapp01/85/Mechanical-properties-of-ceramics-and-composites-386-320.jpg)
![386 Chapter 6
FIGURE 6.15 Relative Young’s modulus (E), yield stress (<100> single crystal, Y),
and flexure strength (σ) of MgO versus test temperature (normalized by taking
the property at 22°C = 1). Note that curve designations are analogous to those of
Fig. 6.12, and that E–T trends, especially for single crystals, are a key basis of
comparison. (After Rice [1], published with permission of Materials Science the
Journal of).
[142,143] (Fig. 6.16). Collectively, UO2 flexure data [144–148] is consistent
with the basic σ–G–1/2 model at 22 and 1000°C and indicates probable increased
strength at 1000°C (Fig. 6.17). Diametral compression data [149] at 22°C also
agrees with these trends. Individual data sets more clearly show strength increas-
ing with temperature. Thus Burdick and Parker [144] showed UO2 strength in-
creased to a maximum at 700–1100°C with net increases of 20–35% for G ∼ 20
µm (P ∼ 0.15–0.22) and 50–70% at > G ∼ 40 µm (P 0.08–0.12). Knudsen et al.
[145] showed ∼ 20% strength decrease for > G ∼ 45 µm (P ∼ 0.1) and a 5 to 75%](https://image.slidesharecdn.com/mechanical-properties-of-ceramics-and-composites-120303143122-phpapp01/85/Mechanical-properties-of-ceramics-and-composites-387-320.jpg)
![Grain Effects on Thermal Shock Resistance 387
FIGURE 6.16 ThO2 σ versus G–1/2 at 22 and 1000°C. Data of Knudsen [142] cor-
rected for variable porosity (superscripts in %) using b = 4.2 and 6.6 at 22 and
1000°C respectively per his analysis. Numbers with high temperature data points
and below the error bars for tests at 22°C are the numbers of values averaged.
Note the consistency of resultant corrected data despite quite variable P levels
for different G bodies, and one data point of Curtis and Johnson [143]. (From Ref.
1, published with the permission of the Journal of Materials Science.)
increase for G = 20–25 µm (P ∼ 0.08–0.24) between 22 and 1000°C. Evans and
Davidge [146] showed no strength increase with initial temperature increase for
their G = 8 µm UO2 till ∼ 500°C, and then a significant rise, peaking at ∼ 800°C
(a ∼ 35% total increase) before decreasing again. Their ∼ 25 µm G body showed
a longer, slower strength rise, peaking at ∼ 1100°C with a similar net increase be-
fore decreasing. Beals et al. [147] showed a similar σ–T increase and maximum
strength (G ∼ 25 µm, P ∼ 0.03). Canon et al. [148] showed that strength in-
creased slowly to a maximum (about 20% higher than at 22°C) at ∼ 1400°C and
then dropped sharply, for bodies with G = ∼ 8, ∼ 15, and ∼ 31 µm.
While ZrO2 single crystals (11.1 m/o, ∼ 18.5 w/o Y2O3) show a typical
Young’s modulus decrease (e.g. ∼ 1–2%/100°C) with increasing temperature to
the limit of testing (700°C), polycrystalline behavior is more complex [150].
Polycrystalline ZrO2 (CaO or MgO) stabilized showed somewhat greater Young’s
modulus decreases to ∼ 400°C and then transitions to ∼ an extrapolation of the
above single crystal data [81,150]. Wachtman and Corwin [151] showed an inter-
nal friction peak in ZrO2, generally in the 300–400°C range but decreasing some](https://image.slidesharecdn.com/mechanical-properties-of-ceramics-and-composites-120303143122-phpapp01/85/Mechanical-properties-of-ceramics-and-composites-388-320.jpg)
![388 Chapter 6
FIGURE 6.17 UO2 σ vs. G–1/2 at 22 and 1000°C. Data of Burdick and Parker [144],
Knudsen et al. [145], Evans and Davidge [146], and Canon et al. [148] are for flex-
ure at both temperatures. (Data of Kennedy and Bandyopandhyay [149], only at
22°C and from diametral compression, is not plotted, but showed a similar, lower
trend.) Note data plotted as-measured with P ∼ 0.02 for Canon et al. and ∼ 0.03 for
Evans and Davidge, while Knudsen et al’s. data was corrected for P (= 0.05–0.24,
mostly 0.05–0.1) and Burdick and Parker (P = ∼ 0.08–0.12) using b = 3 (a 2 next to
some data points indicates two identical points). Kennedy and Bandyopandhyay’s
data are plotted as-measured for P = 0.03–0.09 (shown next to data points). Note
there is no trend for strength to decrease from 22 to 1000°C, and in fact strength
appears to be greater at 1000 than at 22°C.
in magnitude and in the temperature of the maximum as the CaO content in-
creased from 2 to 20%. Shimada et al. [152] showed an initial somewhat greater
Young’s modulus decrease to ∼ 400°C and then (within the 650°C limit of test-
ing) a similar transition as above for dense (P ∼ 0) sintered ZrO2 (+ 3 m/o, ∼ 5.5
w/o Y2O3), as have Adams et al. [153] for sintered (P ∼ 0.02–0.07, G = 15–50
µm) and hot pressed (P ∼ 0.005–0.02, G ∼ 1–3 µm) ZrO2 (+ 6.5 m/o, ∼ 11 w/o,
Y2O3). Adams et al. also showed that their ZrO2-Y2O3 and a commercial ZrO2-
Y2O3 body (with ∼ 1 w/o SiO2) had a much greater Young’s modulus decrease
from ∼ 100 to ∼ 400°C than three commercial ZrO2-MgO bodies tested. Rapid
initial E–T decreases have also been more recently reported for (1) ZrO2 + 33m/o
Tb4O7 between 200 and 500°C (but not with 33 m/o Pr6O11) [154], (2) 3 m/o](https://image.slidesharecdn.com/mechanical-properties-of-ceramics-and-composites-120303143122-phpapp01/85/Mechanical-properties-of-ceramics-and-composites-389-320.jpg)
![Grain Effects on Thermal Shock Resistance 389
Y2O3 between ∼ 22 and 300°C [9], and (3) 2 m/o Y2O3, + 8 m/o Y2O3, and 12 m/o
CeO2 (with respectively similar, greater, and smaller decreases, the latter when
the CeO2 was partly reduced, but no effect when it was fully oxidized) [10]. In
the latter two cases, as well as that of Shimada et al., the anomalous Young’s
modulus decreases were associated with maxima or high levels of internal fric-
tion. Nishiyama et al. [11] also recently reported an internal friction peak at ∼
150°C in ZrO2-2.8 m/o Y2O3. These ZrO2 changes are corroborated by similar ef-
fects of Dole and colleagues [98] in HfO2, i.e. an internal friction peak in unsta-
bilized (monoclinic) HfO2 at ∼ 400°C, and drops in both Young’s and shear
moduli and an internal friction peak in HfO2-20 m/o Er2O3.
While fully stabilized ZrO2 crystals (22 w/o Y2O3) show essentially no
strength changes till T ∼ 1500°C [64], polycrystalline strengths show similar but
greater deviations from E–T trends (Fig. 6.18). Thus the lack of significant single
crystal strength changes between –196 and 22°C indicates limited, or no, single
crystal SCG. Partially stabilized (6 w/o Y2O3) crystals (which start from about four-
fold higher strength than fully stabilized crystals) show an initial strength decrease
much greater than that of Young’s modulus until ∼ 500°C; then it levels off (at ∼
twice the strength of fully stabilized crystals) until ∼ 1500°C. Adams et al.’s tests of
sintered and hot pressed ZrO2 (+ ∼ 11 w/o Y2O3) [153], though scattered, showed an
average initial trend similar to the PSZ (6% Y2O3) crystals but continued to have
much greater strength decrease than Young’s modulus decrease, to a modest mini-
mum at ∼ 700°C. Drachinskii et al. [155] showed a slightly greater strength de-
crease to the limit of their tests (500°C, Fig. 6.18) in ZrO2 + 4 m/o (∼ 7 w/o) Y2O3
sintered and then annealed substantially. However, specimens with limited anneal-
ing after sintering dropped to a strength minimum of ∼ 80% of their 22°C values at
100–200°C and then rose to a strength maximum at 300–400°C that could be simi-
lar or > (e.g. ∼ 35%) strengths at 22°C. Higher temperature tests of some of these
lesser annealed samples showed first a strength minimum at ∼ 700°C (e.g. Adams et
al.), but strength values ranged from 50% relative to 22°C down to ∼ 30% relative
to their strength maxima at ∼ 300°C (i.e. in either case less relative decreases than
for Adams et al.); then there was a strength maximum at ∼ 1000°C. Such greater
strength deviations and complexities are apparently not limited to ZrO2-Y2O3 bod-
ies, as shown by Neuber and Wimmer [81], who report greater strength decrease
than of Young’s modulus with increasing temperature, and probable inflections at ∼
300 and 800°C (Fig. 6.18) in ZrO2 (with ∼ 5 wt% CaO or MgO).
Fracture mode changes accompany the above ZrO2 strength decreases with
increased temperature (Fig. 18), e.g. Adams et al. [153] saw mostly transgranular
fracture at 22°C, mixed trans- and intergranular fracture at 1000°C, and 100% in-
tergranular fracture by 1500°C in their ZrO2 (∼ 11 w/o Y2O3) bodies, similar to
PSZ (2.4 w/o MgO) [64]. Drachinskii et al. [155] observed transgranular fracture
varying from 40 to 90% for specimens of various annealing in tests at 100°C,
with the least transgranular fracture being for the lowest strength (180 MPa), but](https://image.slidesharecdn.com/mechanical-properties-of-ceramics-and-composites-120303143122-phpapp01/85/Mechanical-properties-of-ceramics-and-composites-390-320.jpg)
![390 Chapter 6
FIGURE 6.18 Relative Young’s modulus (E) and flexure strength (σ) of single-
and polycrystalline ZrO2 versus test temperature (normalized by taking the prop-
erty at 22°C = 1). Note the stabilizer in Neuber and Wimmer’s ZrO2 is not speci-
fied but is believed to be either CaO or MgO (∼ 5 wt%, P ∼ 0.13, ∼ 25 µm) [81].
Note that curve designations are analogous to those of Fig. 6.12 (along with des-
ignation of some compositions) and that E–T trends, especially for single crystals,
are a key basis of comparison. (From Ref. 1, published with the permission of the
Journal of Materials Science.)
an intermediate % [153] for the highest strength (410 MPa), vs. 90% at 370 MPa.
Rice [156] observed fracture initiation from grain boundaries surrounded entirely
by 100% transgranular fracture not only in MgO, CaO, and MgAl2O4 but also in
ZrO2 (12.4 w/o MgO) and ZrO2 (+11 w/o Y2O3, from the same processing as
specimens used by Adams et al.). The substantial intergranular fracture at higher
temperatures correlates with substantial grain boundary sliding creep, and even
superplasticity found at ≥ 1000°C in fine grain TZP [156].
F. Effects of Grain Size on Strength of Mixed Oxides at Elevated
Temperatures
As noted in the previous section, MgAl2O4 toughness decreased (∼ 20%) to a
minimum at ∼ 900°C for {100} fracture (and less for other orientations) [38].](https://image.slidesharecdn.com/mechanical-properties-of-ceramics-and-composites-120303143122-phpapp01/85/Mechanical-properties-of-ceramics-and-composites-391-320.jpg)
![Grain Effects on Thermal Shock Resistance 391
Toughness of hot pressed MgAl2O4 decreased slowly with increasing tempera-
ture (e.g. ∼ 10% by ∼ 900°C) for G = 5, 12, and 25 µm (but possibly less for G =
40 µm) and then much more rapidly [39], or was constant to ∼ 800°C and then
increased for G ∼ 35 µm [41]. Overall strength behaved similarly, being the same
at 22 and 200°C; it dropped by ∼ 25% to a minimum at ∼ 600°C or a plateau at ∼
400–800°C and then decreased slowly at higher temperature, i.e. similar to the
temperature dependence of Young’s modulus [39].
Penty [157] prepared and tested hot pressed mullite bodies (P ≤ 0.01, G ∼
0.75–1.5, mostly > 1 µm) showing a strength minimum at ∼ 700°C and a maxi-
mum at 1200°C, with some variation with stoichiometry (Fig. 6.19). Mah and
Mazdiyasni [48] reported flexure strengths increasing from ∼ 130 MPa at 22°C
to ∼ 145 MPa at 1500°C in dense, transparent, hot pressed mullite (61.9 mol%
Al2O3, G ∼ 3–9 µm). However, measurements at only 22, 1000, and
1200–1500°C missed possible intervening strength changes. Their lower
strengths appear to be consistent with their larger grain size, though specimen
size and surface finish are probably also factors. Fracture toughness calculated
from fractography gave ∼ 1.8 MPa·m1/2 at 22°C, decreasing ∼ 20% to a minimum
FIGURE 6.19 Mechanical properties of polycrystalline mullite versus test temper-
ature for mullite. (A) Young’s modulus and toughness data of Baudin [47]; (B)
strength data of Baudin (solid line) [47] and Mah and Mazdiyasni (dashed line)
[48], with the former being nearly identical to that of Penty [157] (not shown for
clarity). Note measurements only at 22, 1000, and 1300–1500°C by Mah and
Mazdiyasni missed seeing possible changes at intervening temperatures and that
their larger G is probably an important factor in their overall lower strengths, de-
spite having residual P ∼ 0 versus 0.006 for Penty. Vertical bars = standard devia-
tions. See also Figure 6.4.](https://image.slidesharecdn.com/mechanical-properties-of-ceramics-and-composites-120303143122-phpapp01/85/Mechanical-properties-of-ceramics-and-composites-392-320.jpg)
![392 Chapter 6
of ∼ 1.5 MPa·m1/2 at ∼ 1100°C and then increasing substantially as the tempera-
ture further increased, apparently due to slow crack growth that was observed
beginning at ∼ 1300°C and was attributed to limited amounts of a glassy grain
boundary phase observed in TEM. Ohnishi et al. [46] showed a similar tough-
ness trend with temperature, i.e. initially decreasing similar to E but then in-
creasing substantially at higher temperature. Their strengths for sintered mullite,
though higher, clearly showed more complex changes than a simple linear trend
with increasing temperature. Baudin [47] reported lower E values but with a
similar relative decrease with increasing T and a similar range of toughnesses
and strengths values but decreasing ∼ 10% to minima at ∼ 800°C and then in-
creasing to maxima ∼ 20% > values at 22°C at ∼ 1400°C.
G. Effects of Grain Size on Strength of Borides, Carbides, and
Nitrides at Elevated Temperatures
While there is little or no σ–G data for most of these materials, there is some, as
well as some other pertinent data on a few of them, e.g. TiB2. Thus σ–G–1/2 data
for dense sintered TiB2 tested at 970°C in argon or molten Al by Baumgartner
[73] both showed two-branch behavior typical of brittle failure from flaws, ex-
cept the larger G branch and hence the branch intersection may occur at some-
what finer G due to effects of probable microcracks in the largest G body (Fig.
6.20). The presence and effects of microcracks was shown by direct observa-
tions of Baumgartner and Steiger [74] in the largest G (∼ 24 µm, P= 0.004)
body and effects on properties in such bodies and those with finer G. Thus at
22°C Young’s modulus of intermediate G (∼ 11 µm) bodies was ∼ 6%< that of
the finest G bodies (∼ 1 µm), and that of the largest G bodies was typically 20%
< the intermediate G bodies despite porosities of ∼ 2.4, 0.6, and 0.3% respec-
tively in the finer through the largest G bodies. In the extreme, E of the largest
G body at 22°C was as low as 270 versus 545 GPa for a finer G (∼ 4 µm), and
the thermal conductivity of the latter was ∼ 25% > the former. Finer and inter-
mediate G bodies showed E decreasing by ∼ 24% from 22 to 1000°C, while the
larger G bodies decreased by ∼ 14%. These trends are supported by their
strengths increasing in inert atmosphere testing as temperature increased by ∼
30 to 100% as G increased, with most (e.g. 80%) of the increase occurring by ∼
1000°C. Further, the load–deflection curves for the finer G bodies were linear to
at least 1250°C, while those for heavily microcracked larger G bodies were
nonlinear prior to fracture, which was attributed to additional stress-induced
microcracking. These observations are supported by results of Mandorf and
Hartwig [158], who showed that while their Young’s moduli decreased less, e.g.
by ∼ 4% to ∼ 1000°C (then accelerated in their decreases, especially with higher
porosity), their flexure strengths increased more, e.g. by ∼ 25% on reaching a
maximum of ∼ 305 GPa at ∼ 1400°C (for G estimated at ∼ 25 µm with a few](https://image.slidesharecdn.com/mechanical-properties-of-ceramics-and-composites-120303143122-phpapp01/85/Mechanical-properties-of-ceramics-and-composites-393-320.jpg)
![Grain Effects on Thermal Shock Resistance 393
FIGURE 6.20 Flexure strength versus the inverse square root of grain size (G–1/2)
for dense sintered TiB2 at ∼ 970°C in argon (Ar) and molten aluminum (Al) from
Baumgartner [72]. Note that (1) the finest G body had residual porosity of ∼ 2.4%
(∼ 3–8 times the other bodies) and that the second finest G body was tested at
1000°C, so correction for these further increases their strengths, (2) the largest G
body was microcracked giving lower strength, and (3) the data of Matsushita et al.
[159] at finer G and that of Mandorf and Hartwig [158] at larger G are consistent
with the above plot, though the latter indicates less larger G strength decrease,
consistent with less apparent microcracking. Baumgartner attributed strength re-
duction in molten aluminum to liquid metal embrittlement, i.e. a reduction of crack
tip toughness, instead of SCG, since fractography showed Al had limited penetra-
tion along grain boundaries but good penetration into surface connected process-
ing flaws, there was no evidence of SCG, and fracture was transgranular.
percent porosity) indicating substantial microcrack closure. Data of Matsushita
et al. [159] for dense sintered TiB2 tested in Ar showed only a few % increase,
mainly by 1000°C in testing to 1400°C (tests in air resulted in substantially
greater increases, e.g. ∼ 50% at 1000°C and then decreasing back to inert at-
mosphere levels at 1200 and 1400°C due probably to oxidation effects). The
lack of significant increase in inert atmosphere is attributed, at least in part, to
their finer G, estimated at ∼ 5 µm. Limited tests of ZrB2 at 1000°C showed no](https://image.slidesharecdn.com/mechanical-properties-of-ceramics-and-composites-120303143122-phpapp01/85/Mechanical-properties-of-ceramics-and-composites-394-320.jpg)
![394 Chapter 6
strength change from 22°C [160] or a maximum at ∼ 300°C (∼ 600°C for HfB2,
both in inert atmosphere) [161].
Limited B4C data indicates limited changes from the σ–G–1/2 behavior at
22°C. Thus de With [162] showed that the strength of the commercial hot
pressed B4C (G ∼ 10 µm, P ∼ 0) in dry nitrogen decreased from ∼ 390 MPa at
22°C by only a few percent at ∼ 600°C and then more rapidly to a minimum of ∼
300 MPa at ∼ 1000°C, then increasing back to its 22°C level at ∼ 1200°C. This
was very similar in form, but larger in the extent of changes for toughness of the
same material, with both strength and toughness tests giving ∼ 100% transgranu-
lar fracture across the temperature range. Gogotsi et al.’s [163] behavior of a
commercial dense hot pressed B4C (G unspecified) showed very similar behav-
ior in testing in Ar, except for starting from a strength of 300 MPa at 22°C (test-
ing in air resulted in ∼ 10% strength reduction by 600°C and then dropping to ∼
200 MPa at 1000 and 1200°C). Several investigations [164–166] showed
strengths of B4C decreasing very little until ∼ 800°C (and limited decrease above
800°C) [162], which is consistent with KIC trends.
Similar tests of SiC showed strength and KIC maxima at ∼ 1400°C [167],
and considerable investigation of dense sintered and hot pressed SiC for engine
and other applications commonly showed strength at 1000°C similar to that at
22°C or somewhat (e.g. ∼ 20%) higher, typically for G ∼ 2–10 µm [168]. Miracle
and Lipsitt [169] showed limited (e.g. 10–20%) strength increases or decreases,
or possibly no strength changes, in TiC from 22° to 600°C, and in some cases to
1000–1200°C depending on C/Ti ratios of 0.66, 0.75, 0.83, and 0.93 (G respec-
tively 22, 21, 20, and 14 µm). Substantial strength decreases occurred at higher
temperatures, with the earliest and greatest strength decrease for the C/Ti = 0.66,
G ∼ 22 µm body. Thus the strength change with increasing temperature generally
did not follow the ∼ 5% decrease of Young’s modulus in this temperature range
[170]. More extensive testing of dense sintered or hot pressed Si3N4, as well as
less dense RSSN, showed that some bodies had lower strengths by 800–1000°C
vs. 22°C, many had no decrease, and several increased (again by up to ∼ 20%)
[168]. This again shows strength not following the E–T trend (e.g. ≤ 5% decrease
by 1000°C. Although such increases are most common for RSSN, they are not
restricted to it (increases in strength can result from surface oxidation removing
flaws in such nonoxides, especially RSSN).
V. GRAIN EFFECTS ON THERMAL SHOCK BEHAVIOR
Broader studies of thermal stress and shock resistance of ceramics support the
general applicability of models discussed earlier, in particular confirming that
fracture normally occurs on cooling rather than heating, since the former results
in tensile stresses on the surface where fracture initiating flaws are typically
much more prevalent. While such fracture thus occurs in material with less, pos-](https://image.slidesharecdn.com/mechanical-properties-of-ceramics-and-composites-120303143122-phpapp01/85/Mechanical-properties-of-ceramics-and-composites-395-320.jpg)
![Grain Effects on Thermal Shock Resistance 395
sibly no, increase over ambient temperature, the temperature exposure may have
effects via the thermal gradient impacts on stresses and properties, e.g. Young’s
modulus and thermal conductivity.
Data specifically on the grain, mainly size, dependence of thermal stress
and shock resistance of ceramics, though quite limited, provides information to
support the simple models, possible modification of them, and other insights to
mechanical behavior, e.g. crack bridging effects. Gupta’s [171,172] study of
thermal shock failure of various alumina bodies of differing G with little or no
porosity using the typical water quench test provides some of the clearest data.
In this test, bars are heated in a furnace to a fixed temperature and then quenched
into a water bath and subsequently tested for their resultant strength. This is re-
peated with other specimens with the post quench strength plotted versus the
quench temperatures, with particular attention to the critical quench temperature,
i.e. TC, where strength decreases, often catastrophically. He showed that sapphire
had the highest critical TC, ∼ 250°C (as well as the highest strength consistent
with much data of Chap. 3, Sec. 1) but failed catastrophically, or nearly so, i.e.
had zero or negligible strengths, after quenching at ≥ TC. Bodies with G of 10,
34, 40, and 85 µm, which had initial strengths decreasing from 340 to 160 MPa,
all had a TC of 200°C (Fig. 6.21). However, while the residual strengths after
quenching well above TC were ∼ the same for all polycrystalline grain sizes, the
strength retained for quenching at and somewhat above TC increased with in-
creasing G, and more importantly the strength decrease above TC became grad-
ual rather than abrupt (Fig. 6.21). Gupta [172] subsequently showed that plotting
strength retained after quenching at TC linearly increased with G, reaching 1 at G
∼ 80 µm, consistent with his experimental results.
Tomaszeweski [173] conducted a more extensive study of G effects on
thermal shock resistance of Al2O3 as an extension of his substantial study of ef-
fects of G on mechanical properties of Al2O3 (Fig. 2.11), covering the G range of
∼ 4 to 600 µm. He showed a similar TC of ∼ 200°C with the extent of abrupt
strength decrease again decreasing as G increased, so that it disappeared by G ∼
100 µm, beyond which a gradual strength decrease with increasing quench T oc-
curred with the starting strength level and the decrease diminished with further G
increase, with a very low strength level of ∼ 10 MPa and no strength decreases
occurring at G ∼ 570 µm. These changes are related to linear reductions of the
(static) Young’s modulus with increasing G, i.e. from ∼ 300+ to ∼ 150 GPa at G
100+ µm and then to ∼ 100 GPa at G ∼ 460 µm due to microcracking.
Seaton and Dutta [174] showed some similar and different results for G
effects on thermal shock of B4C, which had very similar E, TEA, and toughness
to Al2O3, but dominant transgranular rather than mixed or mainly intergranular
fracture. They showed that, while starting strengths were somewhat higher for
finer G, as was expected, the overall TC was the same for G = 2 and 16 µm, as
for Al2O3. However, the larger G showed strengths starting to decrease at < TC,](https://image.slidesharecdn.com/mechanical-properties-of-ceramics-and-composites-120303143122-phpapp01/85/Mechanical-properties-of-ceramics-and-composites-396-320.jpg)
![396 Chapter 6
FIGURE 6.21 Flexure strengths at 22°C for quenched Al2O3 [172] with G = 85 µm
and 10 µm. Note the similarity that while starting strengths increase with decreas-
ing G, the overall ∆T values are independent of G, but residual strengths are
somewhat higher, especially as a fraction of starting strengths at higher G for
Al2O3, but not for B4C, which reflects differences between these two materials,
e.g. possibly of crack–grain bridging. (Published with the permission of the Jour-
nal of the American Ceramic Society.)
and then were lower at and somewhat above ∆T in contrast to the Al2O3 results
(Fig. 6.21). The reasons for these differences are not known for certain, but they
may reflect differing effects of crack–grain bridging effects. Thus as G in-
creases in Al2O3, opportunity for such bridging increases and the resultant crack
sizes involved in much of the thermal shock damage probably becomes large
enough to involve a sufficient number of grains to limit strength loss. On the
other hand, the predominant transgranular fracture in B4C appears to limit pos-
sible crack bridging and thus the opportunity to mitigate strength losses in ther-
mal shock.
Kennedy and Bandyopadhyay [149] conducted similar quench tests on
four UO2 bodies with G ∼ 2–19 µm and porosity of ∼ 9 to 3%, which generally
decreased with increasing G. Again TC was ∼ independent of G (at ∼ 100°C), but](https://image.slidesharecdn.com/mechanical-properties-of-ceramics-and-composites-120303143122-phpapp01/85/Mechanical-properties-of-ceramics-and-composites-397-320.jpg)
![Grain Effects on Thermal Shock Resistance 397
there was no clear improvement of the residual strength as G increased. In fact,
strengths after quenching the two finer grain bodies did not reach those of the
two larger G bodies at TC until quench temperatures of 300–400°C.
Other tests show further complications and evaluation possibilities, e.g. in
studies of Capolla and Bradt [175] of two recrystallized SiC refractory bodies
with one having somewhat higher strength and WOF and somewhat lower ther-
mal expansion with a substantial bimodal G distribution versus the other body
with a grain structure of ∼ uniform grains of about the size of, or somewhat >,
the larger grains in the first body. The former body had a TC of 350°C, slightly
higher than the second body with its ∼ 325°C, but it had a substantially lower
rate of strength decrease and a higher retained strength than the second body.
The property best correlating with these differences in thermal shock behavior
was the WOF, but the underlying microstructural reasons for this are not clear,
e.g. the body with somewhat finer large grains in a matrix of substantially finer
grains, hence a substantially smaller average G, had substantially better perfor-
mance. While this difference in grain structure is probably a factor, interaction
between the grain structure and the substantial and similar levels of porosity in
both bodies may be important, since there is clear precedent for porosity criti-
cally interacting with other microstructural aspects significantly to improve ther-
mal shock [8]. Finally, these investigators [175] and others [167,168] have
shown the value of using damping as a tool to monitor thermal shock damage,
i.e. showing substantial increases in damping below and beyond TC, then level-
ing off, with the overall levels being substantially higher with more thermal
shock damage. Similarly, acoustic emission, though again used only a limited
amount, can be a valuable indicator of thermal shock effects.
VI. DISCUSSION
A. Overall Strength–Grain Size Behavior as a Function
of Temperature
As temperature increases, there must be a transition in the grain dependence of
crack propogation and tensile strength, which is also significantly impacted by
strain rate. This overall transition arises since the grain size dependence of these
properties is fundamentally opposite at lower temperatures from what it is at suf-
ficiently high temperatures, with the transition occurring at lower temperatures
with lower strain rates and higher temperatures at higher strain rates. At lower
temperatures, where brittle fracture initiation and propagation dominate, even
where crack nucleation, growth, or both occur due to microplastic processes,
strengths inherently increase with decreasing grain size, as was extensively
shown in Chap. 3 and here. This chapter also clearly shows that such brittle frac-
ture, most commonly manifested by the typical two-branch σ–G–1/2 behavior](https://image.slidesharecdn.com/mechanical-properties-of-ceramics-and-composites-120303143122-phpapp01/85/Mechanical-properties-of-ceramics-and-composites-398-320.jpg)


![400 Chapter 6
boundary phases, and test conditions, to some extent test atmosphere, but espe-
cially on strain rate. Again this higher temperature transition occurs due to oppo-
site G dependences, i.e. finer grains result in easier grain boundary sliding and
deformation and hence lower strengths as opposed to higher strengths at lower
temperatures, i.e. indicated per Eq. (6.2), with strengths tending to be inversely
proportional to the deformation strain rate. Greater deformation at finer G is
shown by the occurrence of superplastic deformation in fine G ceramics similar
to such behavior in metals [176,177].
The details of this transition, from lower temperature strengths being pro-
portional to G–1/2 and higher temperature strengths to various powers of G ≥ 1,
are complex and poorly defined. The general transition is fairly well indicated
for several specific bodies, e.g. as reviewed by Quinn [178] and illustrated in
Figure 6.24. However, what is almost totally missing is, especially quantitative,
documentation of how such transitions depend on changes in grain size, shape,
FIGURE 6.24 Plot of flexure stress versus test temperature for a specific com-
mercial hot pressed Si3N4 for various strain rates, thus forming a useful failure
mechanism map for such test variables. Unfortunately, detailed information on
the effects of grain structure and differing amounts and types of grain boundary
phases is not available. (From Ref. 178, published with the permission of the
Journal of Materials Science.)](https://image.slidesharecdn.com/mechanical-properties-of-ceramics-and-composites-120303143122-phpapp01/85/Mechanical-properties-of-ceramics-and-composites-401-320.jpg)
![Grain Effects on Thermal Shock Resistance 401
or orientation, as well as on the amount and character of grain boundary phases.
The lack of such information arises from both the lack of adequate data as a
function of T and the complexity of high-temperature behavior and the transition
between this and lower temperature behavior. The complexity stems substan-
tially from other changes and transitions in behavior that occur over intermediate
temperature ranges. Unfortunately, many have focused on only the basic lower
to higher temperature failure changes and thus do not begin higher temperature
measurements till ≥ 1000°C, thus missing changes that often occur at lower tem-
peratures. Frequent modest and sometimes extreme changes occur from the sim-
ple trend for toughnesses and especially strengths to decrease in proportion to
the decreases in E till temperatures ≥ 1000°C, where grain boundary sliding or
other deformation processes begin to occur depending on material and strain
rates. Thus minima, maxima, or both of toughness, strength, or both commonly
occur at T ≤ 1200°C (e.g. Figs. 6.12, 6.14, 6.15, and 6.18) before continuous and
accelerating decreases in strengths and polycrystalline toughnesses (disparities
for single crystal toughnesses will be discussed later).
B. Property Changes Impacting Strength and Its Grain Size
Dependence as a Function of Temperature
Young’s modulus decrease with temperature again provides a baseline compari-
sion of strength–temperature behavior, since it is a basic factor in strength
changes with temperature. Such E–T trends, while not directly revealing grain
structure dependence, can aid in this by considering other possible superimposed
strength changes, especially those that are known or expected to depend on grain
structure. Such comparison is the purpose of this section given the limited
amount of experimental data reviewed earlier, starting with changes in slow
crack growth.
The substantial occurrence of SCG due to environmental species, espe-
cially H2O, clearly disappears as T decreases below 22°C for tests in liquid nitro-
gen at –196°C (Fig. 6.25). Thus if strengths and Young’s moduli are plotted
versus T starting well below room temperature, those materials experiencing
SCG at modest T, e.g. due to H2O, would show a deviation below strengths par-
alleling the decreases of E as T increases. However, such materials should also
show a positive deviation of strengths versus T back toward the T dependence of
E as T increases above 22°C due to reduced SCG from H2O and other fluid
species due to increased temperature reducing the amount of such species at the
crack tip. Though not studied in detail, such a change was shown by Evans and
Lange’s [53] n values for SiC hot pressed with Al2O3 additions increasing with T,
i.e. ∼ 80 at 22°C and > 200 at 600°C. However, as temperature increases, other
mechanisms of SCG can come into play, commonly due to grain boundary slid-
ing, especially due to boundary phases. Again, Evans and Lange’s [53] study of](https://image.slidesharecdn.com/mechanical-properties-of-ceramics-and-composites-120303143122-phpapp01/85/Mechanical-properties-of-ceramics-and-composites-402-320.jpg)