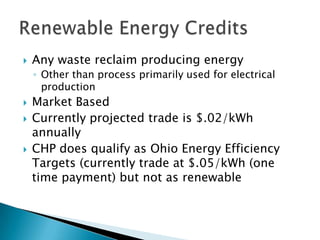
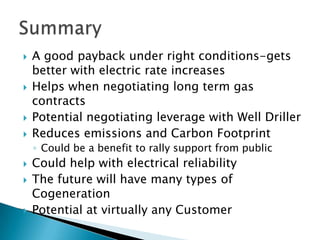
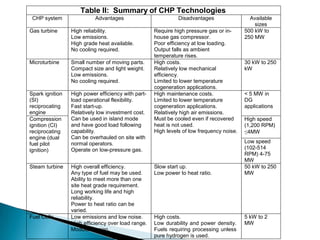
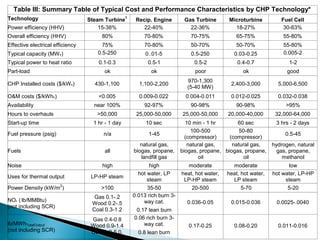
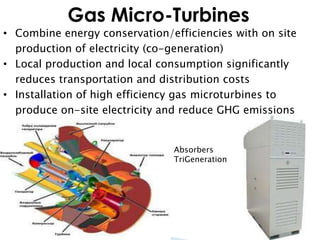
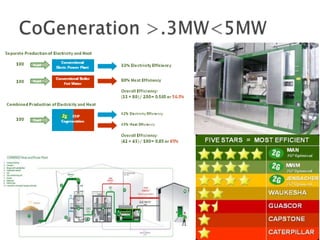
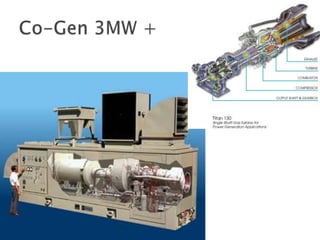
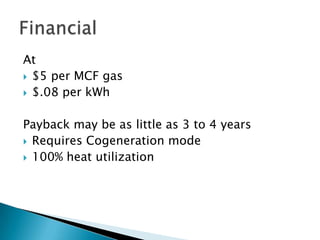
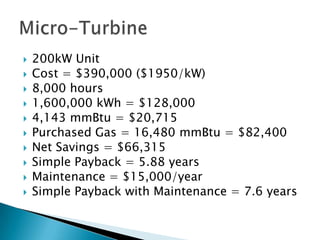
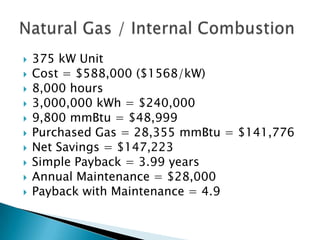
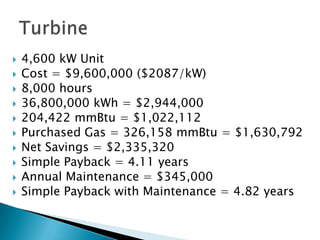
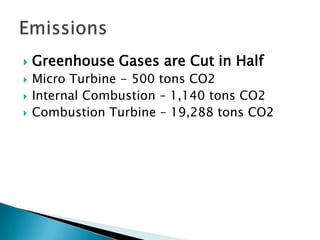
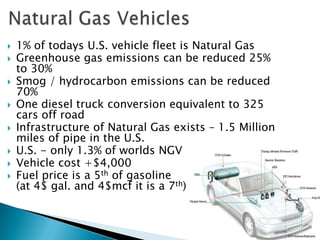
Kelly Tisdale, CEM, LEED AP
The Brewer-Garrett Company
          September 25th, 2012
   Utica Shale
   Natural Gas Pricing
   Long Term Gas Pricing
   Opportunities
    ◦ Co-Generation
        Micro-Turbine
        Internal Combustion
        Combustion Turbine
        Standby Charges
    ◦ Natural Gas Vehicles
      ….Solar
      ….Wind
    ◦ Environmental Impact vs. Electricity
   LED
Utica Shale Gas Drilling
• 40% of Ohio sits above the Utica Shale gas deposit (see
  graphic)
• Located approximately one (1) mile beneath the Earth’s
  surface
• Extraction techniques called shale fractures or “fracing” have
  been in use for over 60 years but are controversial
• Gas and petroleum resources are estimated to be viable for
  50 to 100 years at current consumption rates
• Significant economic opportunities for Ohio …
• Can provide energy independence and security for the U.S.
• Gas is the least carbon intensive (CO2 emissions) of fossil
  fuels used to generate electricity (coal, oil, natural gas)
   Drill site = approximately 650 acres + approx. 1M sq.
   650 acres at $5k per = $3.25M (mineral rights)
   Royalty = 18%
   Potential Annual Royalty at 5000 MCF per day at $4 =
    $1,310,000+ Annually
   May offer attractive long term gas contract due to flat
    constant load (micro turbines)
   Climate Neutrality may be selling point to Districts or
    Municipalities
   Environmental Issues
   Boom for Ohio
    ◦ 200,000 jobs
         Steel, Trucking, Service, Construction
   Stable Long Term Gas
    ◦ 10 year Contract at $5MCF
   Environmental Impact
    ◦ Gas vs. Coal 430 vs. 1150 CO2
           Cogeneration means Boiler produces “0” emissions
   Opportunities
    ◦   Micro turbines
    ◦   Cogeneration
    ◦   Service
    ◦   Natural Gas Vehicles
   Manufacturing Expansion
Average Natural Gas Prices
Last Month                                        3.2
Last Year . . . . . . . . . . . . . . . . . . . . 4.0
Last 5 Years                                      5.6
Last 10 Years . . . . . . . . . . . . . . . . ... 5.8
Last 20 Years                                     4.4
   Micro turbines up to .5MW
    ◦   Usually 65kW increments
    ◦   Natural Gas Fired…
    ◦   Recuperators
    ◦   Capstone
   Gas engine .3 to 5MW
    ◦ Diesel or Natural Gas
    ◦ Waukesha, Caterpillar
   Turbines 3MW plus
    ◦ Solar – Saturn, Taurus, Mercury, Mars, Titan
Gas Micro-Turbines
• Combine energy conservation/efficiencies with on site
  production of electricity (co-generation)
• Local production and local consumption significantly
  reduces transportation and distribution costs
• Installation of high efficiency gas microturbines to
  produce on-site electricity and reduce GHG emissions


                               Absorbers
                               TriGeneration
At
 $5 per MCF gas
 $.08 per kWh


Payback may be as little as 3 to 4 years
 Requires Cogeneration mode
 100% heat utilization
   200kW Unit
   Cost = $390,000 ($1950/kW)
   8,000 hours
   1,600,000 kWh = $128,000
   4,143 mmBtu = $20,715
   Purchased Gas = 16,480 mmBtu = $82,400
   Net Savings = $66,315
   Simple Payback = 5.88 years
   Maintenance = $15,000/year
   Simple Payback with Maintenance = 7.6 years
   375 kW Unit
   Cost = $588,000 ($1568/kW)
   8,000 hours
   3,000,000 kWh = $240,000
   9,800 mmBtu = $48,999
   Purchased Gas = 28,355 mmBtu = $141,776
   Net Savings = $147,223
   Simple Payback = 3.99 years
   Annual Maintenance = $28,000
   Payback with Maintenance = 4.9
   4,600 kW Unit
   Cost = $9,600,000 ($2087/kW)
   8,000 hours
   36,800,000 kWh = $2,944,000
   204,422 mmBtu = $1,022,112
   Purchased Gas = 326,158 mmBtu = $1,630,792
   Net Savings = $2,335,320
   Simple Payback = 4.11 years
   Annual Maintenance = $345,000
   Simple Payback with Maintenance = 4.82 years
   Long Term Gas Contracts
    ◦ Currently 5 years
    ◦ Expect longer soon
    ◦ Ability to negotiate with Well Driller
         Constant Load is Best for Driller
         Utilizing own natural resource
   Heat Load
    ◦   Process Loads
    ◦   Terminal Reheats
    ◦   Domestic Hot Water
    ◦   Swimming Pools
    ◦   Absorbers
   Most often sized for only a portion of electric
    load… 65kW, or some multiple of, is the most
    common size
   Best installation will be sized to use 100% of heat
   Payback w/o heat load is closer to 10 years
    ◦ Other reasons for install could be high 9s reliability
   All installations will significantly reduce
    emissions
   Currently no standby costs
   Greenhouse Gases are Cut in Half
   Micro Turbine - 500 tons CO2
   Internal Combustion – 1,140 tons CO2
   Combustion Turbine – 19,288 tons CO2
   These costs were once prohibitive
   Essentially charged you a standby fee that
    was almost equivalent to electric rate as if
    you had actually used their electric
   Currently most traditional utilities say they
    have no standby rate
    ◦ They expect you to negotiate with your electric
      wholesaler
    ◦ They want to remain a “wires only”
   New Companies such as EnerNOC may view
    Cogeneration as a negotiating opportunity
   Any waste reclaim producing energy
    ◦ Other than process primarily used for electrical
      production
   Market Based
   Currently projected trade is $.02/kWh
    annually
   CHP does qualify as Ohio Energy Efficiency
    Targets (currently trade at $.05/kWh (one
    time payment)
   Any waste reclaim producing energy
    ◦ Other than process primarily used for electrical
      production
   Market Based
   Currently projected trade is $.02/kWh
    annually
   CHP does qualify as Ohio Energy Efficiency
    Targets (currently trade at $.05/kWh (one
    time payment) but not as renewable
   A good payback under right conditions-gets
    better with electric rate increases
   Helps when negotiating long term gas
    contracts
   Potential negotiating leverage with Well Driller
   Reduces emissions and Carbon Footprint
    ◦ Could be a benefit to rally support from public
   Could help with electrical reliability
   The future will have many types of
    Cogeneration
   Potential at virtually any Customer
Table II: Summary of CHP Technologies
 CHP system                Advantages                         Disadvantages                 Available
                                                                                              sizes
Gas turbine      High reliability.                  Require high pressure gas or in-      500 kW to
                 Low emissions.                     house gas compressor.                 250 MW
                 High grade heat available.         Poor efficiency at low loading.
                 No cooling required.               Output falls as ambient
                                                    temperature rises.
Microturbine     Small number of moving parts.      High costs.                           30 kW to 250
                 Compact size and light weight.     Relatively low mechanical             kW
                 Low emissions.                     efficiency.
                 No cooling required.               Limited to lower temperature
                                                    cogeneration applications.
Spark ignition   High power efficiency with part-   High maintenance costs.               < 5 MW in
(SI)             load operational flexibility.      Limited to lower temperature          DG
reciprocating    Fast start-up.                     cogeneration applications.            applications
engine           Relatively low investment cost.    Relatively high air emissions.
Compression      Can be used in island mode         Must be cooled even if recovered      High speed
ignition (CI)    and have good load following       heat is not used.                     (1,200 RPM)
reciprocating    capability.                        High levels of low frequency noise.   ≤4MW
engine (dual     Can be overhauled on site with
fuel pilot       normal operators.                                                        Low speed
ignition)        Operate on low-pressure gas.                                             (102-514
                                                                                          RPM) 4-75
                                                                                          MW
Steam turbine    High overall efficiency.           Slow start up.                        50 kW to 250
                 Any type of fuel may be used.      Low power to heat ratio.              MW
                 Ability to meet more than one
                 site heat grade requirement.
                 Long working life and high
                 reliability.
                 Power to heat ratio can be
                 varied.
Fuel Cells       Low emissions and low noise.       High costs.                           5 kW to 2
                 High efficiency over load range.   Low durability and power density.     MW
                 Modular design.                    Fuels requiring processing unless
                                                    pure hydrogen is used.
Table III: Summary Table of Typical Cost and Performance Characteristics by CHP Technology*
Technology                                         1
                                  Steam Turbine         Recip. Engine        Gas Turbine       Microturbine          Fuel Cell
Power efficiency (HHV)                15-38%               22-40%              22-36%            18-27%               30-63%
Overall efficiency (HHV)               80%                 70-80%               70-75%            65-75%              55-80%
Effective electrical efficiency        75%                 70-80%               50-70%            50-70%              55-80%
Typical capacity (MW e)              0.5-250                0..01-5             0.5-250           0.03-0.25           0.005-2
Typical power to heat ratio           0.1-0.3                0.5-1               0.5-2             0.4-0.7              1-2
Part-load                               ok                    ok                 poor                ok                 good
                                                                              970-1,300
CHP Installed costs ($/kW e)        430-1,100            1,100-2,200                            2,400-3,000         5,000-6,500
                                                                              (5-40 MW)
O&M costs ($/kWhe)                    <0.005             0.009-0.022          0.004-0.011       0.012-0.025         0.032-0.038
Availability                        near 100%              92-97%               90-98%            90-98%               >95%
Hours to overhauls                   >50,000            25,000-50,000       25,000-50,000      20,000-40,000       32,000-64,000
Start-up time                       1 hr - 1 day            10 sec            10 min - 1 hr       60 sec           3 hrs - 2 days
                                                                                100-500            50-80
Fuel pressure (psig)                    n/a                  1-45                                                      0.5-45
                                                                              (compressor)     (compressor)
                                                          natural gas,         natural gas,     natural gas,      hydrogen, natural
Fuels                                   all            biogas, propane,     biogas, propane, biogas, propane,       gas, propane,
                                                          landfill gas             oil               oil              methanol
Noise                                  high                   high            moderate           moderate               low
                                                         hot water, LP      heat, hot water,   heat, hot water,   hot water, LP-HP
Uses for thermal output            LP-HP steam
                                                             steam           LP-HP steam         LP steam              steam
                       2
Power Density (kW/m )                  >100                  35-50              20-500               5-70               5-20
                                    Gas 0.1-.2         0.013 rich burn 3-
NOx ( lb/MMBtu)                                            way cat.           0.036-0.05        0.015-0.036        0.0025-.0040
                                   Wood 0.2-.5
(not including SCR)
                                   Coal 0.3-1.2         0.17 lean burn
                                   Gas 0.4-0.8         0.06 rich burn 3-
lb/MWhTotalOutput                  Wood 0.9-1.4            way cat.            0.17-0.25          0.08-0.20         0.011-0.016
(not including SCR)                Coal 1.2-5.0.         0.8 lean burn
   1% of todays U.S. vehicle fleet is Natural Gas
   Greenhouse gas emissions can be reduced 25%
    to 30%
   Smog / hydrocarbon emissions can be reduced
    70%
   One diesel truck conversion equivalent to 325
    cars off road
   Infrastructure of Natural Gas exists – 1.5 Million
    miles of pipe in the U.S.
   U.S. - only 1.3% of worlds NGV
   Vehicle cost +$4,000
   Fuel price is a 5th of gasoline
    (at 4$ gal. and 4$mcf it is a 7th)
   Market Changes
    ◦ Will soon be retrofitting all are lighting retrofits
      again
    ◦ Timeline may put it approximately two to three
      years before standard output of a 2x4 fixture or
      compatible lamp will exceed 130 lumens per watt
      and cost falls within Performance Contracting
      parameters
    ◦ $60 Billion in retrofit
    ◦ Manufacturers already beginning to thin
Combined Heat and Power Generation - Commercial Energy Efficiency with Cogeneration

Combined Heat and Power Generation - Commercial Energy Efficiency with Cogeneration

  • 1.
    Kelly Tisdale, CEM,LEED AP The Brewer-Garrett Company September 25th, 2012
  • 2.
    Utica Shale  Natural Gas Pricing  Long Term Gas Pricing  Opportunities ◦ Co-Generation  Micro-Turbine  Internal Combustion  Combustion Turbine  Standby Charges ◦ Natural Gas Vehicles  ….Solar  ….Wind ◦ Environmental Impact vs. Electricity  LED
  • 4.
    Utica Shale GasDrilling • 40% of Ohio sits above the Utica Shale gas deposit (see graphic) • Located approximately one (1) mile beneath the Earth’s surface • Extraction techniques called shale fractures or “fracing” have been in use for over 60 years but are controversial • Gas and petroleum resources are estimated to be viable for 50 to 100 years at current consumption rates • Significant economic opportunities for Ohio … • Can provide energy independence and security for the U.S. • Gas is the least carbon intensive (CO2 emissions) of fossil fuels used to generate electricity (coal, oil, natural gas)
  • 5.
    Drill site = approximately 650 acres + approx. 1M sq.  650 acres at $5k per = $3.25M (mineral rights)  Royalty = 18%  Potential Annual Royalty at 5000 MCF per day at $4 = $1,310,000+ Annually  May offer attractive long term gas contract due to flat constant load (micro turbines)  Climate Neutrality may be selling point to Districts or Municipalities  Environmental Issues
  • 6.
    Boom for Ohio ◦ 200,000 jobs  Steel, Trucking, Service, Construction  Stable Long Term Gas ◦ 10 year Contract at $5MCF  Environmental Impact ◦ Gas vs. Coal 430 vs. 1150 CO2  Cogeneration means Boiler produces “0” emissions  Opportunities ◦ Micro turbines ◦ Cogeneration ◦ Service ◦ Natural Gas Vehicles  Manufacturing Expansion
  • 7.
    Average Natural GasPrices Last Month 3.2 Last Year . . . . . . . . . . . . . . . . . . . . 4.0 Last 5 Years 5.6 Last 10 Years . . . . . . . . . . . . . . . . ... 5.8 Last 20 Years 4.4
  • 9.
    Micro turbines up to .5MW ◦ Usually 65kW increments ◦ Natural Gas Fired… ◦ Recuperators ◦ Capstone  Gas engine .3 to 5MW ◦ Diesel or Natural Gas ◦ Waukesha, Caterpillar  Turbines 3MW plus ◦ Solar – Saturn, Taurus, Mercury, Mars, Titan
  • 10.
    Gas Micro-Turbines • Combineenergy conservation/efficiencies with on site production of electricity (co-generation) • Local production and local consumption significantly reduces transportation and distribution costs • Installation of high efficiency gas microturbines to produce on-site electricity and reduce GHG emissions Absorbers TriGeneration
  • 13.
    At  $5 perMCF gas  $.08 per kWh Payback may be as little as 3 to 4 years  Requires Cogeneration mode  100% heat utilization
  • 14.
    200kW Unit  Cost = $390,000 ($1950/kW)  8,000 hours  1,600,000 kWh = $128,000  4,143 mmBtu = $20,715  Purchased Gas = 16,480 mmBtu = $82,400  Net Savings = $66,315  Simple Payback = 5.88 years  Maintenance = $15,000/year  Simple Payback with Maintenance = 7.6 years
  • 15.
    375 kW Unit  Cost = $588,000 ($1568/kW)  8,000 hours  3,000,000 kWh = $240,000  9,800 mmBtu = $48,999  Purchased Gas = 28,355 mmBtu = $141,776  Net Savings = $147,223  Simple Payback = 3.99 years  Annual Maintenance = $28,000  Payback with Maintenance = 4.9
  • 16.
    4,600 kW Unit  Cost = $9,600,000 ($2087/kW)  8,000 hours  36,800,000 kWh = $2,944,000  204,422 mmBtu = $1,022,112  Purchased Gas = 326,158 mmBtu = $1,630,792  Net Savings = $2,335,320  Simple Payback = 4.11 years  Annual Maintenance = $345,000  Simple Payback with Maintenance = 4.82 years
  • 17.
    Long Term Gas Contracts ◦ Currently 5 years ◦ Expect longer soon ◦ Ability to negotiate with Well Driller  Constant Load is Best for Driller  Utilizing own natural resource  Heat Load ◦ Process Loads ◦ Terminal Reheats ◦ Domestic Hot Water ◦ Swimming Pools ◦ Absorbers
  • 18.
    Most often sized for only a portion of electric load… 65kW, or some multiple of, is the most common size  Best installation will be sized to use 100% of heat  Payback w/o heat load is closer to 10 years ◦ Other reasons for install could be high 9s reliability  All installations will significantly reduce emissions  Currently no standby costs
  • 19.
    Greenhouse Gases are Cut in Half  Micro Turbine - 500 tons CO2  Internal Combustion – 1,140 tons CO2  Combustion Turbine – 19,288 tons CO2
  • 20.
    These costs were once prohibitive  Essentially charged you a standby fee that was almost equivalent to electric rate as if you had actually used their electric  Currently most traditional utilities say they have no standby rate ◦ They expect you to negotiate with your electric wholesaler ◦ They want to remain a “wires only”  New Companies such as EnerNOC may view Cogeneration as a negotiating opportunity
  • 21.
    Any waste reclaim producing energy ◦ Other than process primarily used for electrical production  Market Based  Currently projected trade is $.02/kWh annually  CHP does qualify as Ohio Energy Efficiency Targets (currently trade at $.05/kWh (one time payment)
  • 22.
    Any waste reclaim producing energy ◦ Other than process primarily used for electrical production  Market Based  Currently projected trade is $.02/kWh annually  CHP does qualify as Ohio Energy Efficiency Targets (currently trade at $.05/kWh (one time payment) but not as renewable
  • 23.
    A good payback under right conditions-gets better with electric rate increases  Helps when negotiating long term gas contracts  Potential negotiating leverage with Well Driller  Reduces emissions and Carbon Footprint ◦ Could be a benefit to rally support from public  Could help with electrical reliability  The future will have many types of Cogeneration  Potential at virtually any Customer
  • 24.
    Table II: Summaryof CHP Technologies CHP system Advantages Disadvantages Available sizes Gas turbine High reliability. Require high pressure gas or in- 500 kW to Low emissions. house gas compressor. 250 MW High grade heat available. Poor efficiency at low loading. No cooling required. Output falls as ambient temperature rises. Microturbine Small number of moving parts. High costs. 30 kW to 250 Compact size and light weight. Relatively low mechanical kW Low emissions. efficiency. No cooling required. Limited to lower temperature cogeneration applications. Spark ignition High power efficiency with part- High maintenance costs. < 5 MW in (SI) load operational flexibility. Limited to lower temperature DG reciprocating Fast start-up. cogeneration applications. applications engine Relatively low investment cost. Relatively high air emissions. Compression Can be used in island mode Must be cooled even if recovered High speed ignition (CI) and have good load following heat is not used. (1,200 RPM) reciprocating capability. High levels of low frequency noise. ≤4MW engine (dual Can be overhauled on site with fuel pilot normal operators. Low speed ignition) Operate on low-pressure gas. (102-514 RPM) 4-75 MW Steam turbine High overall efficiency. Slow start up. 50 kW to 250 Any type of fuel may be used. Low power to heat ratio. MW Ability to meet more than one site heat grade requirement. Long working life and high reliability. Power to heat ratio can be varied. Fuel Cells Low emissions and low noise. High costs. 5 kW to 2 High efficiency over load range. Low durability and power density. MW Modular design. Fuels requiring processing unless pure hydrogen is used.
  • 25.
    Table III: SummaryTable of Typical Cost and Performance Characteristics by CHP Technology* Technology 1 Steam Turbine Recip. Engine Gas Turbine Microturbine Fuel Cell Power efficiency (HHV) 15-38% 22-40% 22-36% 18-27% 30-63% Overall efficiency (HHV) 80% 70-80% 70-75% 65-75% 55-80% Effective electrical efficiency 75% 70-80% 50-70% 50-70% 55-80% Typical capacity (MW e) 0.5-250 0..01-5 0.5-250 0.03-0.25 0.005-2 Typical power to heat ratio 0.1-0.3 0.5-1 0.5-2 0.4-0.7 1-2 Part-load ok ok poor ok good 970-1,300 CHP Installed costs ($/kW e) 430-1,100 1,100-2,200 2,400-3,000 5,000-6,500 (5-40 MW) O&M costs ($/kWhe) <0.005 0.009-0.022 0.004-0.011 0.012-0.025 0.032-0.038 Availability near 100% 92-97% 90-98% 90-98% >95% Hours to overhauls >50,000 25,000-50,000 25,000-50,000 20,000-40,000 32,000-64,000 Start-up time 1 hr - 1 day 10 sec 10 min - 1 hr 60 sec 3 hrs - 2 days 100-500 50-80 Fuel pressure (psig) n/a 1-45 0.5-45 (compressor) (compressor) natural gas, natural gas, natural gas, hydrogen, natural Fuels all biogas, propane, biogas, propane, biogas, propane, gas, propane, landfill gas oil oil methanol Noise high high moderate moderate low hot water, LP heat, hot water, heat, hot water, hot water, LP-HP Uses for thermal output LP-HP steam steam LP-HP steam LP steam steam 2 Power Density (kW/m ) >100 35-50 20-500 5-70 5-20 Gas 0.1-.2 0.013 rich burn 3- NOx ( lb/MMBtu) way cat. 0.036-0.05 0.015-0.036 0.0025-.0040 Wood 0.2-.5 (not including SCR) Coal 0.3-1.2 0.17 lean burn Gas 0.4-0.8 0.06 rich burn 3- lb/MWhTotalOutput Wood 0.9-1.4 way cat. 0.17-0.25 0.08-0.20 0.011-0.016 (not including SCR) Coal 1.2-5.0. 0.8 lean burn
  • 26.
    1% of todays U.S. vehicle fleet is Natural Gas  Greenhouse gas emissions can be reduced 25% to 30%  Smog / hydrocarbon emissions can be reduced 70%  One diesel truck conversion equivalent to 325 cars off road  Infrastructure of Natural Gas exists – 1.5 Million miles of pipe in the U.S.  U.S. - only 1.3% of worlds NGV  Vehicle cost +$4,000  Fuel price is a 5th of gasoline (at 4$ gal. and 4$mcf it is a 7th)
  • 27.
    Market Changes ◦ Will soon be retrofitting all are lighting retrofits again ◦ Timeline may put it approximately two to three years before standard output of a 2x4 fixture or compatible lamp will exceed 130 lumens per watt and cost falls within Performance Contracting parameters ◦ $60 Billion in retrofit ◦ Manufacturers already beginning to thin