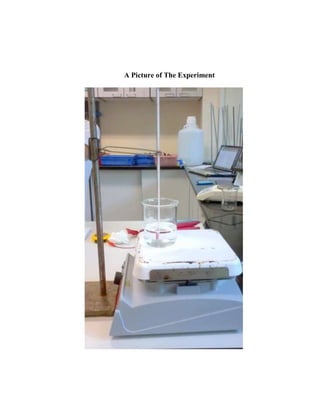
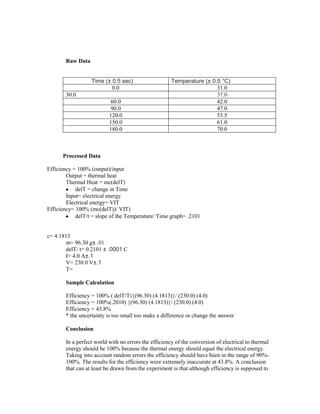
Energy Conversion Practical
Introduction

When energy is used to do work, it usually changes into a different form of energy. This
experiment is about electrical energy converting into thermal energy. An example od electrical
energy converting into thermal energy is when water is heated on an electric stove. The energy
used to start the oven is electrical energy. During the process of boiling water, the electrical
energy becomes thermal energy. According to the law of conservation of energy, the initial
energy should equal final energy. In this experiment, the initial energy is electrical energy and the
final energy is Thermal energy. Thus, the amount of electrical energy should equal the amount of
thermal energy, although this was not true in this experiment because of random errors. In this
experiment the formula VIT was used to find electrical energy, and the formula mc(delT) to find
the thermal energy (delT = change in Temperature). The efficiency was calculated using the
formula
                                  Efficiency= 100% (output)/input
The output is the thermal energy and the input is the electrical energy. The efficiency was off
because of random errors. The time that the water boils and the Temperature of the water are the
only variable. The mass of the water, specific heat constant, voltage and current are all constants.
The primary goal of this experiment is to determine the efficiency of converting energy from an
electrical form to a thermal form. The efficiency was expected to be very close to 100%
according to the law of conservation of energy.

Design

         Research Question: What is the efficiency when electrical energy is converted into
         thermal energy?

         Independent Variable: the time the water is heated up for

         Dependent Variable: the temperature of the water

Controlled Variables:
       1. Mass of water
       2. Voltage
       3. Current

         Description: A hot plate was plugged into an outlet and had 230.0 V and 4.0 A. A beaker
         of water was placed on the hot plate; the mass of the water being 96.39 g. A thermometer
         was inside the beaker, which was held in place by a retort stand. The hot plate was turned
         on and the time was recorded via a continuum and processed into a computer.
A Picture of The Experiment
Raw Data


                  Time (± 0.5 sec)                    Temperature (± 0.5 °C)
                          0.0                                          31.0
       30.0                                                            37.0
                          60.0                                         42.0
                          90.0                                         47.0
                          120.0                                        53.5
                          150.0                                        61.0
                          180.0                                        70.0


      Processed Data

Efficiency = 100% (output)/input
        Output = thermal heat
        Thermal Heat = mc(delT)
            delT = change in Time
        Input= electrical energy
        Electrical energy= VIT
Efficiency= 100% (mc(delT))/ VIT)
            delT/t = slope of the Temperature/ Time graph= .2101


c= 4.1813
        m= 96.30 g± .01
        delT/ t= 0.2101 ± .0001 C
        I= 4.0 A±.1
        V= 230.0 V±.1
        T=

       Sample Calculation

       Efficiency = 100% ( delT/T){(96.30) (4.1813)}/ (230.0) (4.0)
       Efficiency = 100%(.2010) {(96.30) (4.1813)}/ (230.0) (4.0)
       Efficiency = 43.8%
       * the uncertainty is too small too make a difference or change the answer

       Conclusion

       In a perfect world with no errors the efficiency of the conversion of electrical to thermal
       energy should be 100% because the thermal energy should equal the electrical energy.
       Taking into account random errors the efficiency should have been in the range of 90%-
       100%. The results for the efficiency were extremely inaccurate at 43.8%. A conclusion
       that can at least be drawn from the experiment is that although efficiency is supposed to
be 100%, it will almost never quite reach that number because of random errors, which
are results of an imperfect world. By evaluating the slope of the graph, one can see that
the relationship between the change in Temperature and time is linear and that the slope
of the graph of Temperature versus time can be substituted into the derived equation of
efficiency (100% (mc(delT))/ VIT) for delT/ T. Without the slope of the Temperature
versus time graph efficiency would be very difficult to calculate.

Evaluation of Random Errors
The experiment’s results were quite different then what they were expected to have been
or than what they should have been according to the law of the conservation of energy
because if both energies are equal the efficiency result equals 100%. The inaccuracy is
largely due to random errors.

1. One random error that happened in this experiment was a loss of some of the mass of
   water when it was heated because some of the mass was evaporating. A difference in
   mass would affect thermal energy and thus would affect the efficiency results. To fix
   this a piece of cardboard or thick material could be place over the beaker to prevent
   evaporation. A whole would have to be poked into the cardboard just small enough
   so that the thermometer could be inserted in.
2. Another random error was trying to measure the change in Temperature as related to
   time. At first, this was tried by measuring specific times and temperatures separately
   but this affected the results because the starting Temperature was different each time
   and measurements were affected by the previous experiments, and it was hard to
   calculate. To fix this a continuum was used so that the temperature and time could be
   related in a graph and the change in Temperature divided by the time could be
   measured by taking the slope. This also led to better accuracy and precision.
3. The last random error was when someone held the thermometer to measure the
   temperature of thewater, it was unstable and difficult to get an accurate reading in a
   short time. To fix this a the thermometer was attached to a retort stand.

Energy conversion practical

  • 1.
    Energy Conversion Practical Introduction Whenenergy is used to do work, it usually changes into a different form of energy. This experiment is about electrical energy converting into thermal energy. An example od electrical energy converting into thermal energy is when water is heated on an electric stove. The energy used to start the oven is electrical energy. During the process of boiling water, the electrical energy becomes thermal energy. According to the law of conservation of energy, the initial energy should equal final energy. In this experiment, the initial energy is electrical energy and the final energy is Thermal energy. Thus, the amount of electrical energy should equal the amount of thermal energy, although this was not true in this experiment because of random errors. In this experiment the formula VIT was used to find electrical energy, and the formula mc(delT) to find the thermal energy (delT = change in Temperature). The efficiency was calculated using the formula Efficiency= 100% (output)/input The output is the thermal energy and the input is the electrical energy. The efficiency was off because of random errors. The time that the water boils and the Temperature of the water are the only variable. The mass of the water, specific heat constant, voltage and current are all constants. The primary goal of this experiment is to determine the efficiency of converting energy from an electrical form to a thermal form. The efficiency was expected to be very close to 100% according to the law of conservation of energy. Design Research Question: What is the efficiency when electrical energy is converted into thermal energy? Independent Variable: the time the water is heated up for Dependent Variable: the temperature of the water Controlled Variables: 1. Mass of water 2. Voltage 3. Current Description: A hot plate was plugged into an outlet and had 230.0 V and 4.0 A. A beaker of water was placed on the hot plate; the mass of the water being 96.39 g. A thermometer was inside the beaker, which was held in place by a retort stand. The hot plate was turned on and the time was recorded via a continuum and processed into a computer.
  • 2.
    A Picture ofThe Experiment
  • 3.
    Raw Data Time (± 0.5 sec) Temperature (± 0.5 °C) 0.0 31.0 30.0 37.0 60.0 42.0 90.0 47.0 120.0 53.5 150.0 61.0 180.0 70.0 Processed Data Efficiency = 100% (output)/input Output = thermal heat Thermal Heat = mc(delT) delT = change in Time Input= electrical energy Electrical energy= VIT Efficiency= 100% (mc(delT))/ VIT) delT/t = slope of the Temperature/ Time graph= .2101 c= 4.1813 m= 96.30 g± .01 delT/ t= 0.2101 ± .0001 C I= 4.0 A±.1 V= 230.0 V±.1 T= Sample Calculation Efficiency = 100% ( delT/T){(96.30) (4.1813)}/ (230.0) (4.0) Efficiency = 100%(.2010) {(96.30) (4.1813)}/ (230.0) (4.0) Efficiency = 43.8% * the uncertainty is too small too make a difference or change the answer Conclusion In a perfect world with no errors the efficiency of the conversion of electrical to thermal energy should be 100% because the thermal energy should equal the electrical energy. Taking into account random errors the efficiency should have been in the range of 90%- 100%. The results for the efficiency were extremely inaccurate at 43.8%. A conclusion that can at least be drawn from the experiment is that although efficiency is supposed to
  • 4.
    be 100%, itwill almost never quite reach that number because of random errors, which are results of an imperfect world. By evaluating the slope of the graph, one can see that the relationship between the change in Temperature and time is linear and that the slope of the graph of Temperature versus time can be substituted into the derived equation of efficiency (100% (mc(delT))/ VIT) for delT/ T. Without the slope of the Temperature versus time graph efficiency would be very difficult to calculate. Evaluation of Random Errors The experiment’s results were quite different then what they were expected to have been or than what they should have been according to the law of the conservation of energy because if both energies are equal the efficiency result equals 100%. The inaccuracy is largely due to random errors. 1. One random error that happened in this experiment was a loss of some of the mass of water when it was heated because some of the mass was evaporating. A difference in mass would affect thermal energy and thus would affect the efficiency results. To fix this a piece of cardboard or thick material could be place over the beaker to prevent evaporation. A whole would have to be poked into the cardboard just small enough so that the thermometer could be inserted in. 2. Another random error was trying to measure the change in Temperature as related to time. At first, this was tried by measuring specific times and temperatures separately but this affected the results because the starting Temperature was different each time and measurements were affected by the previous experiments, and it was hard to calculate. To fix this a continuum was used so that the temperature and time could be related in a graph and the change in Temperature divided by the time could be measured by taking the slope. This also led to better accuracy and precision. 3. The last random error was when someone held the thermometer to measure the temperature of thewater, it was unstable and difficult to get an accurate reading in a short time. To fix this a the thermometer was attached to a retort stand.