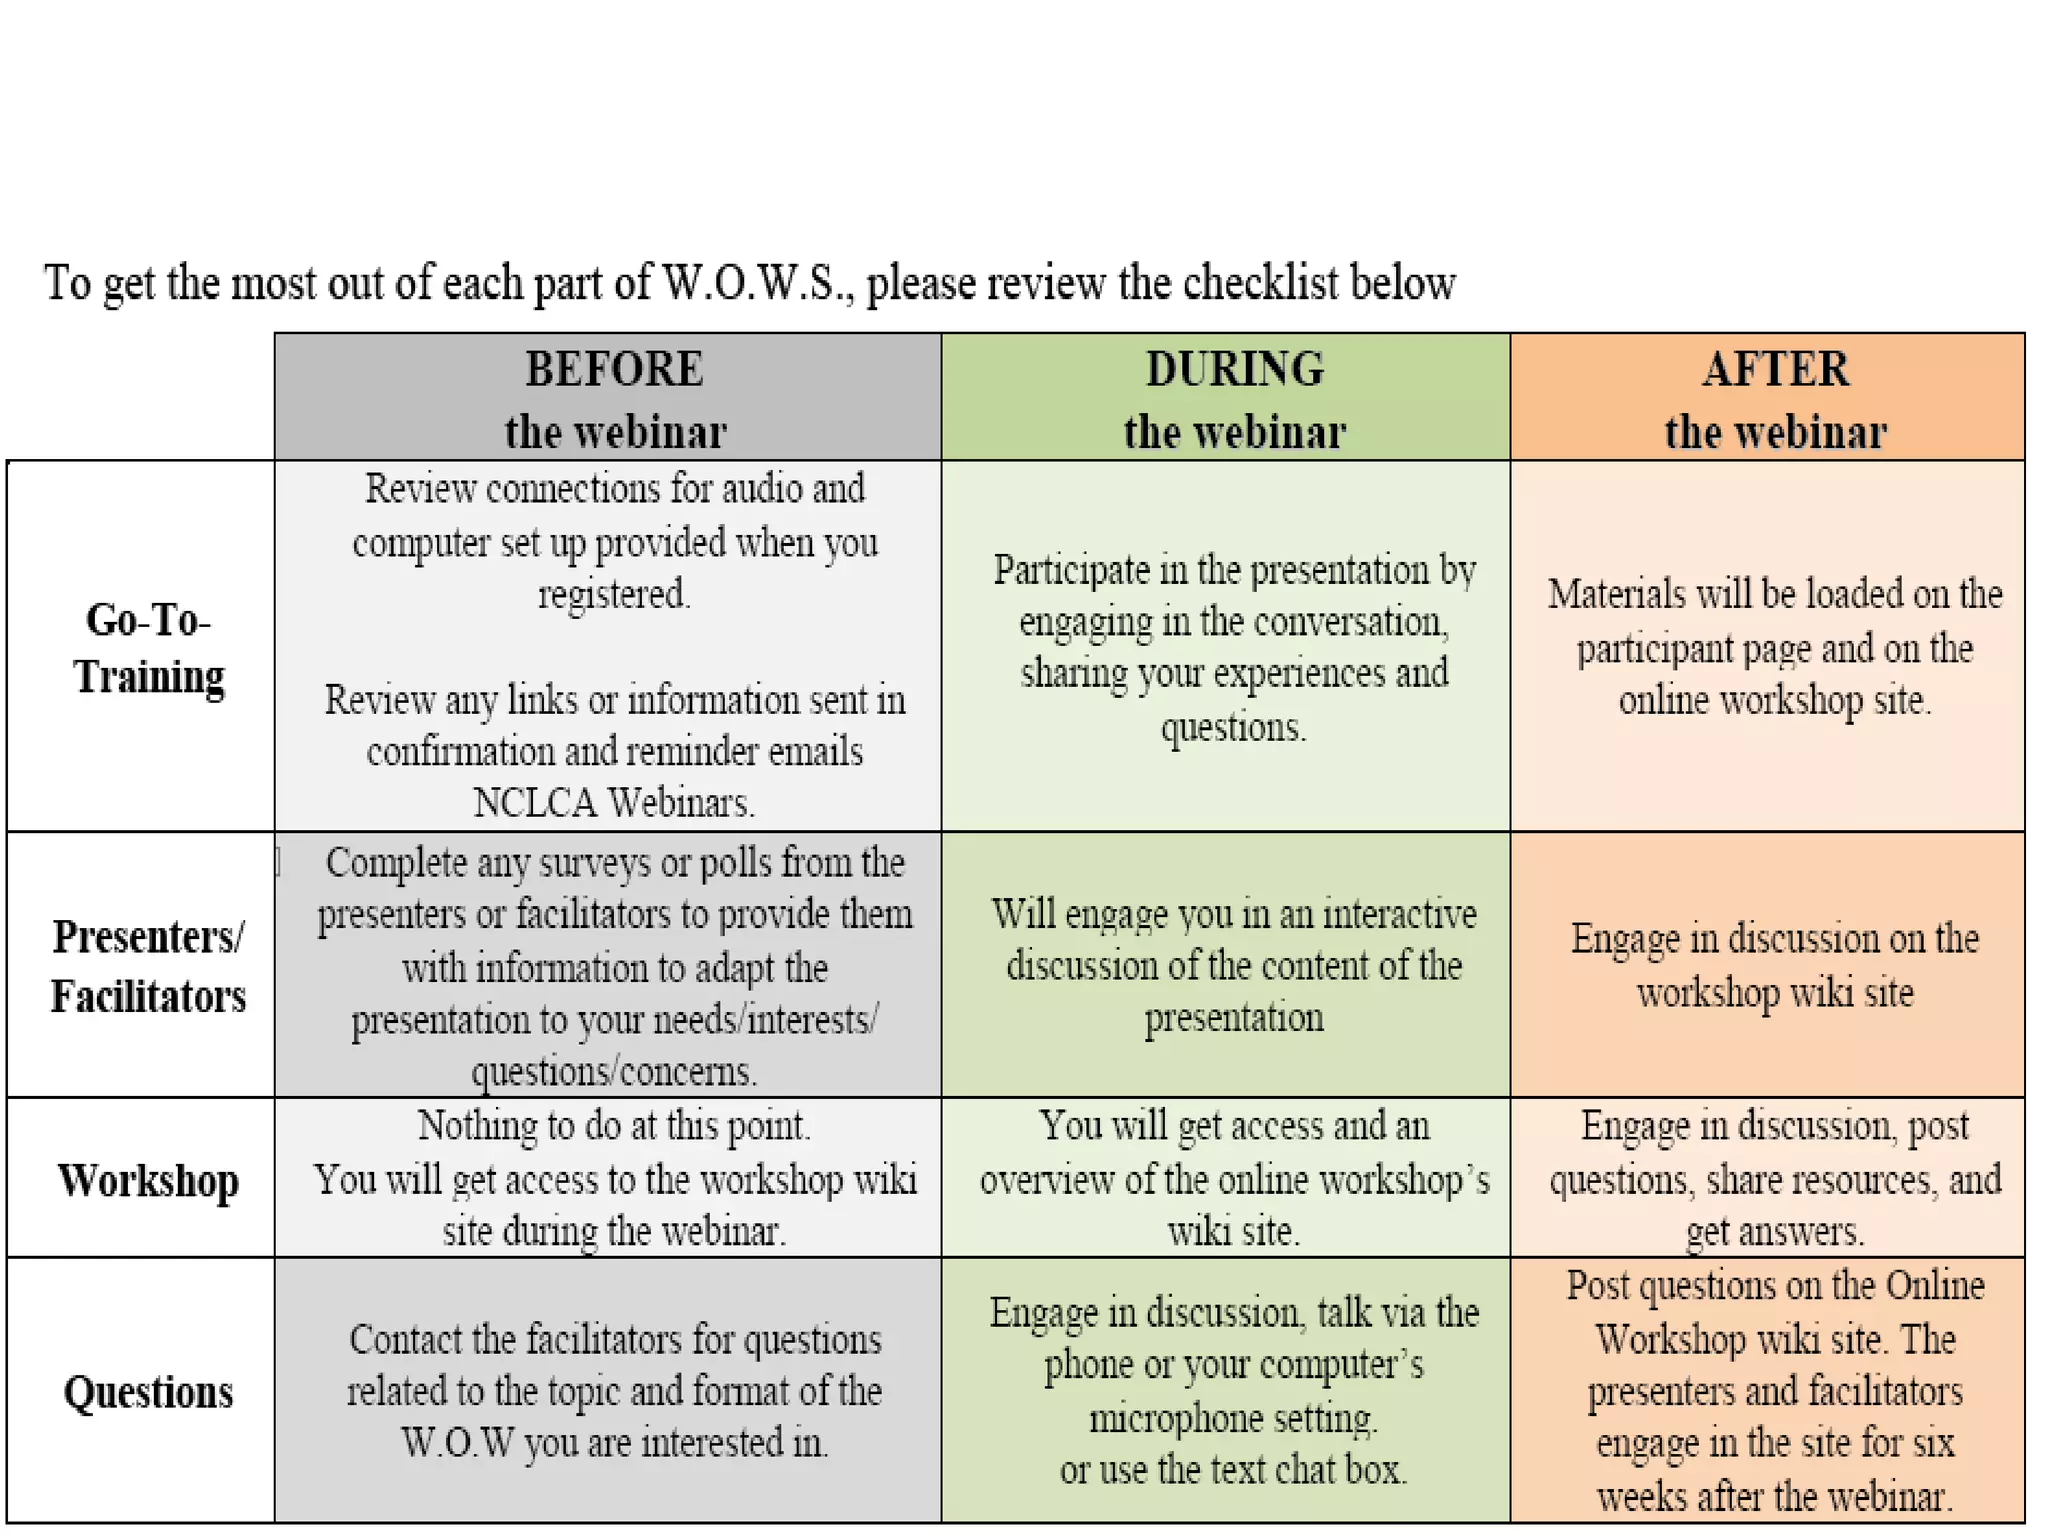
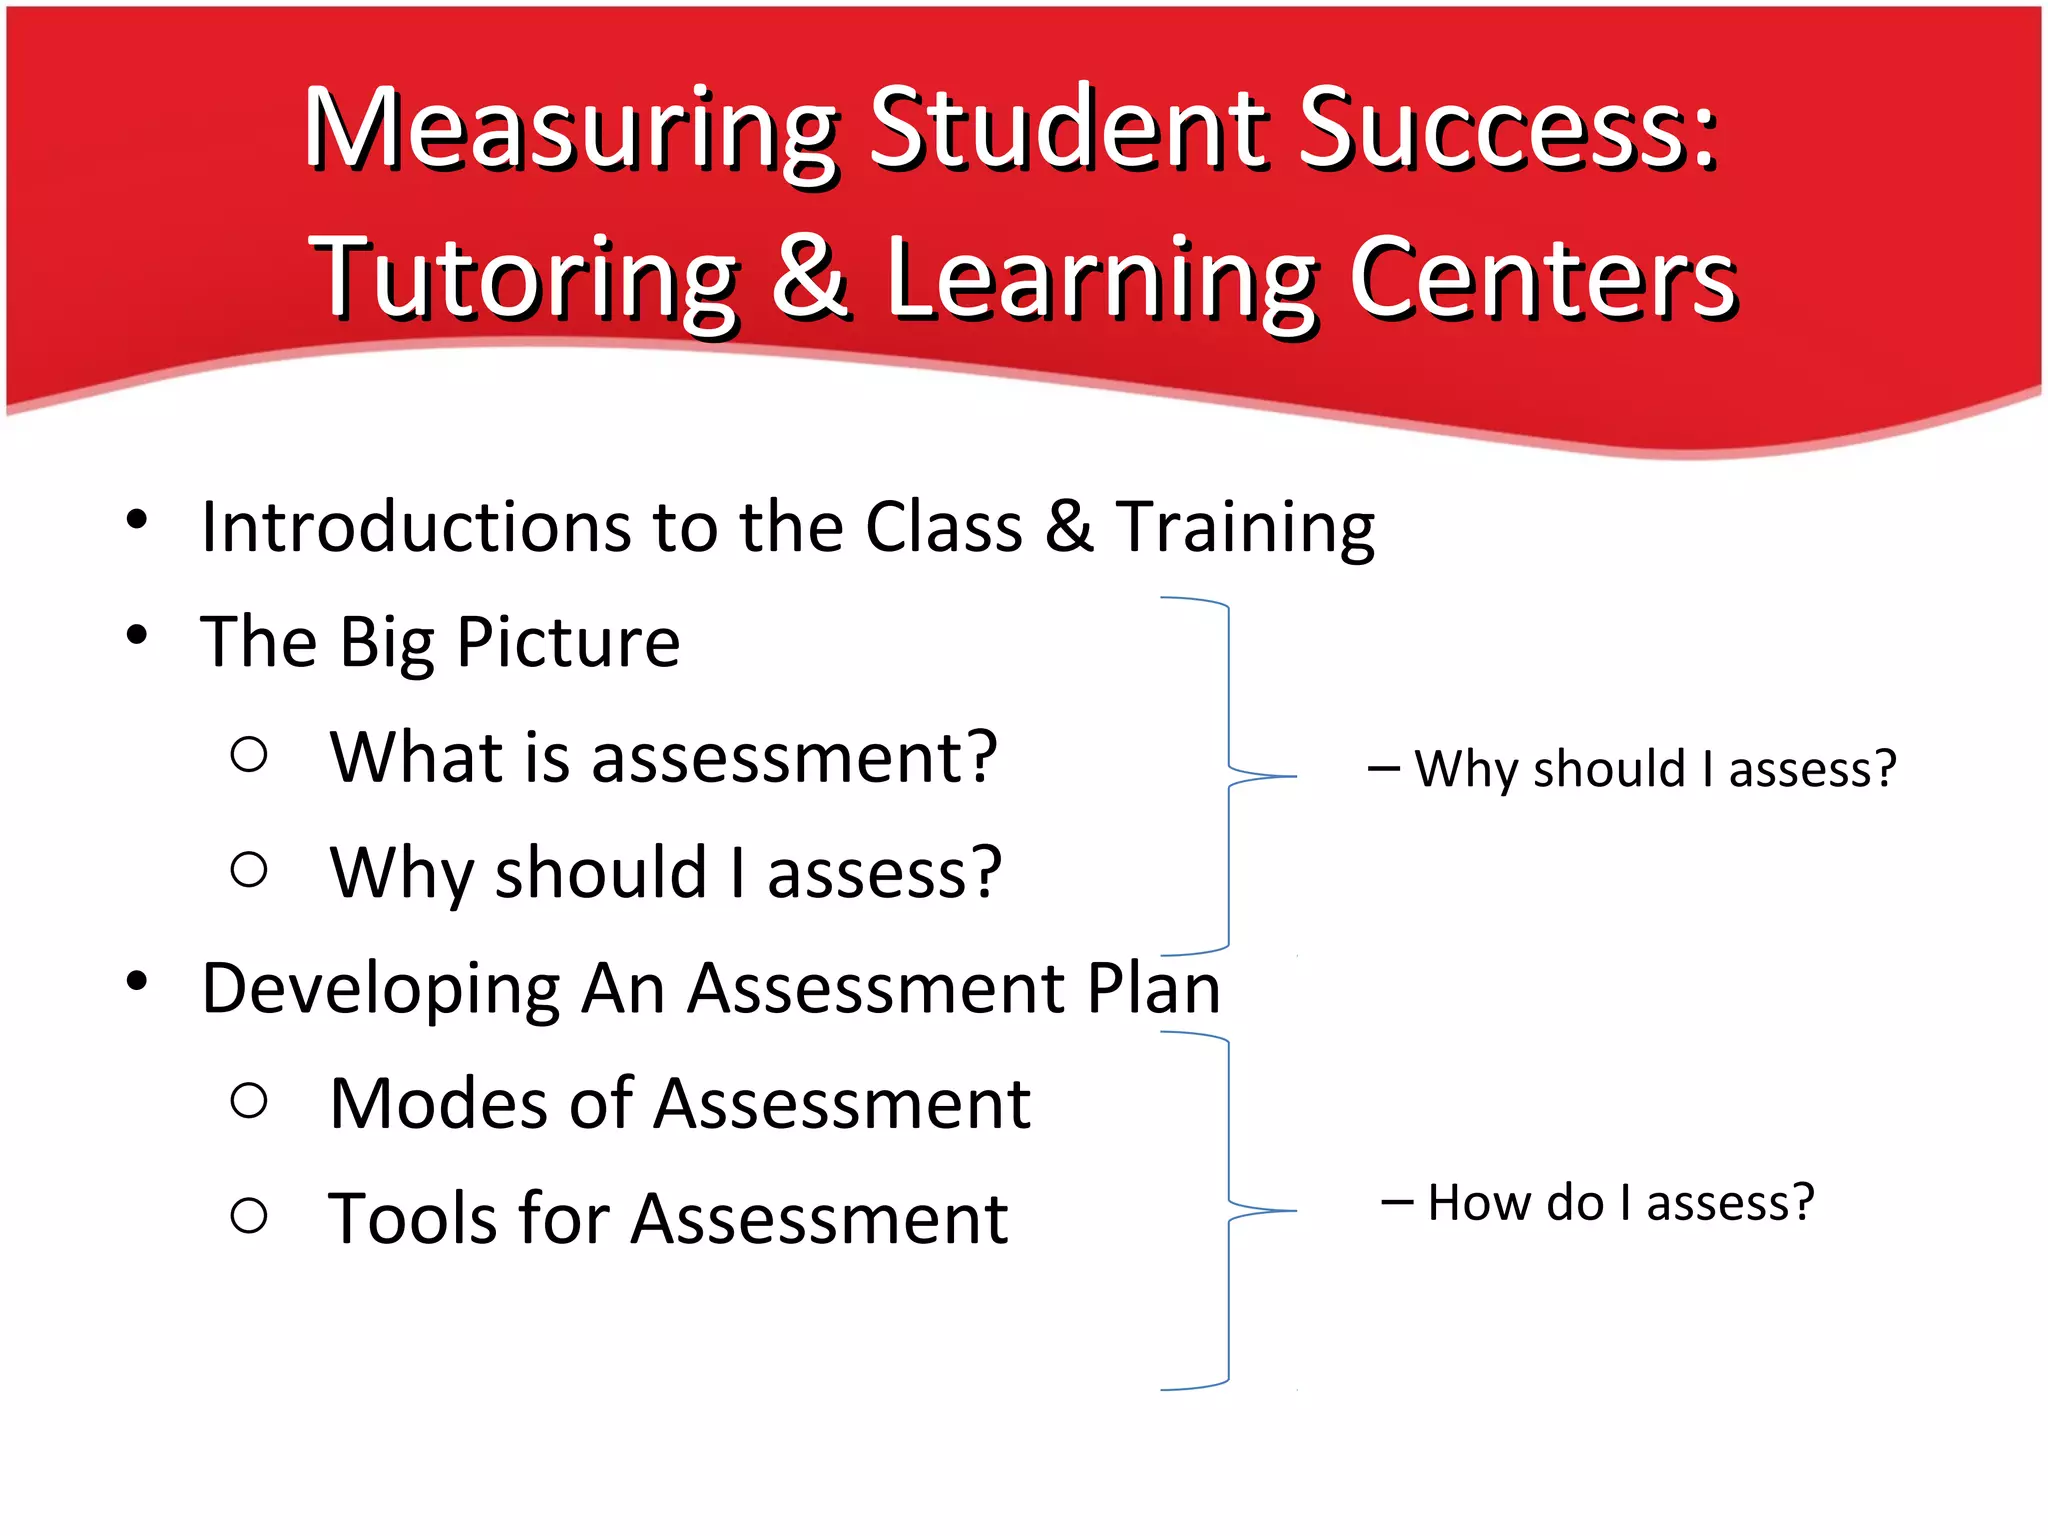
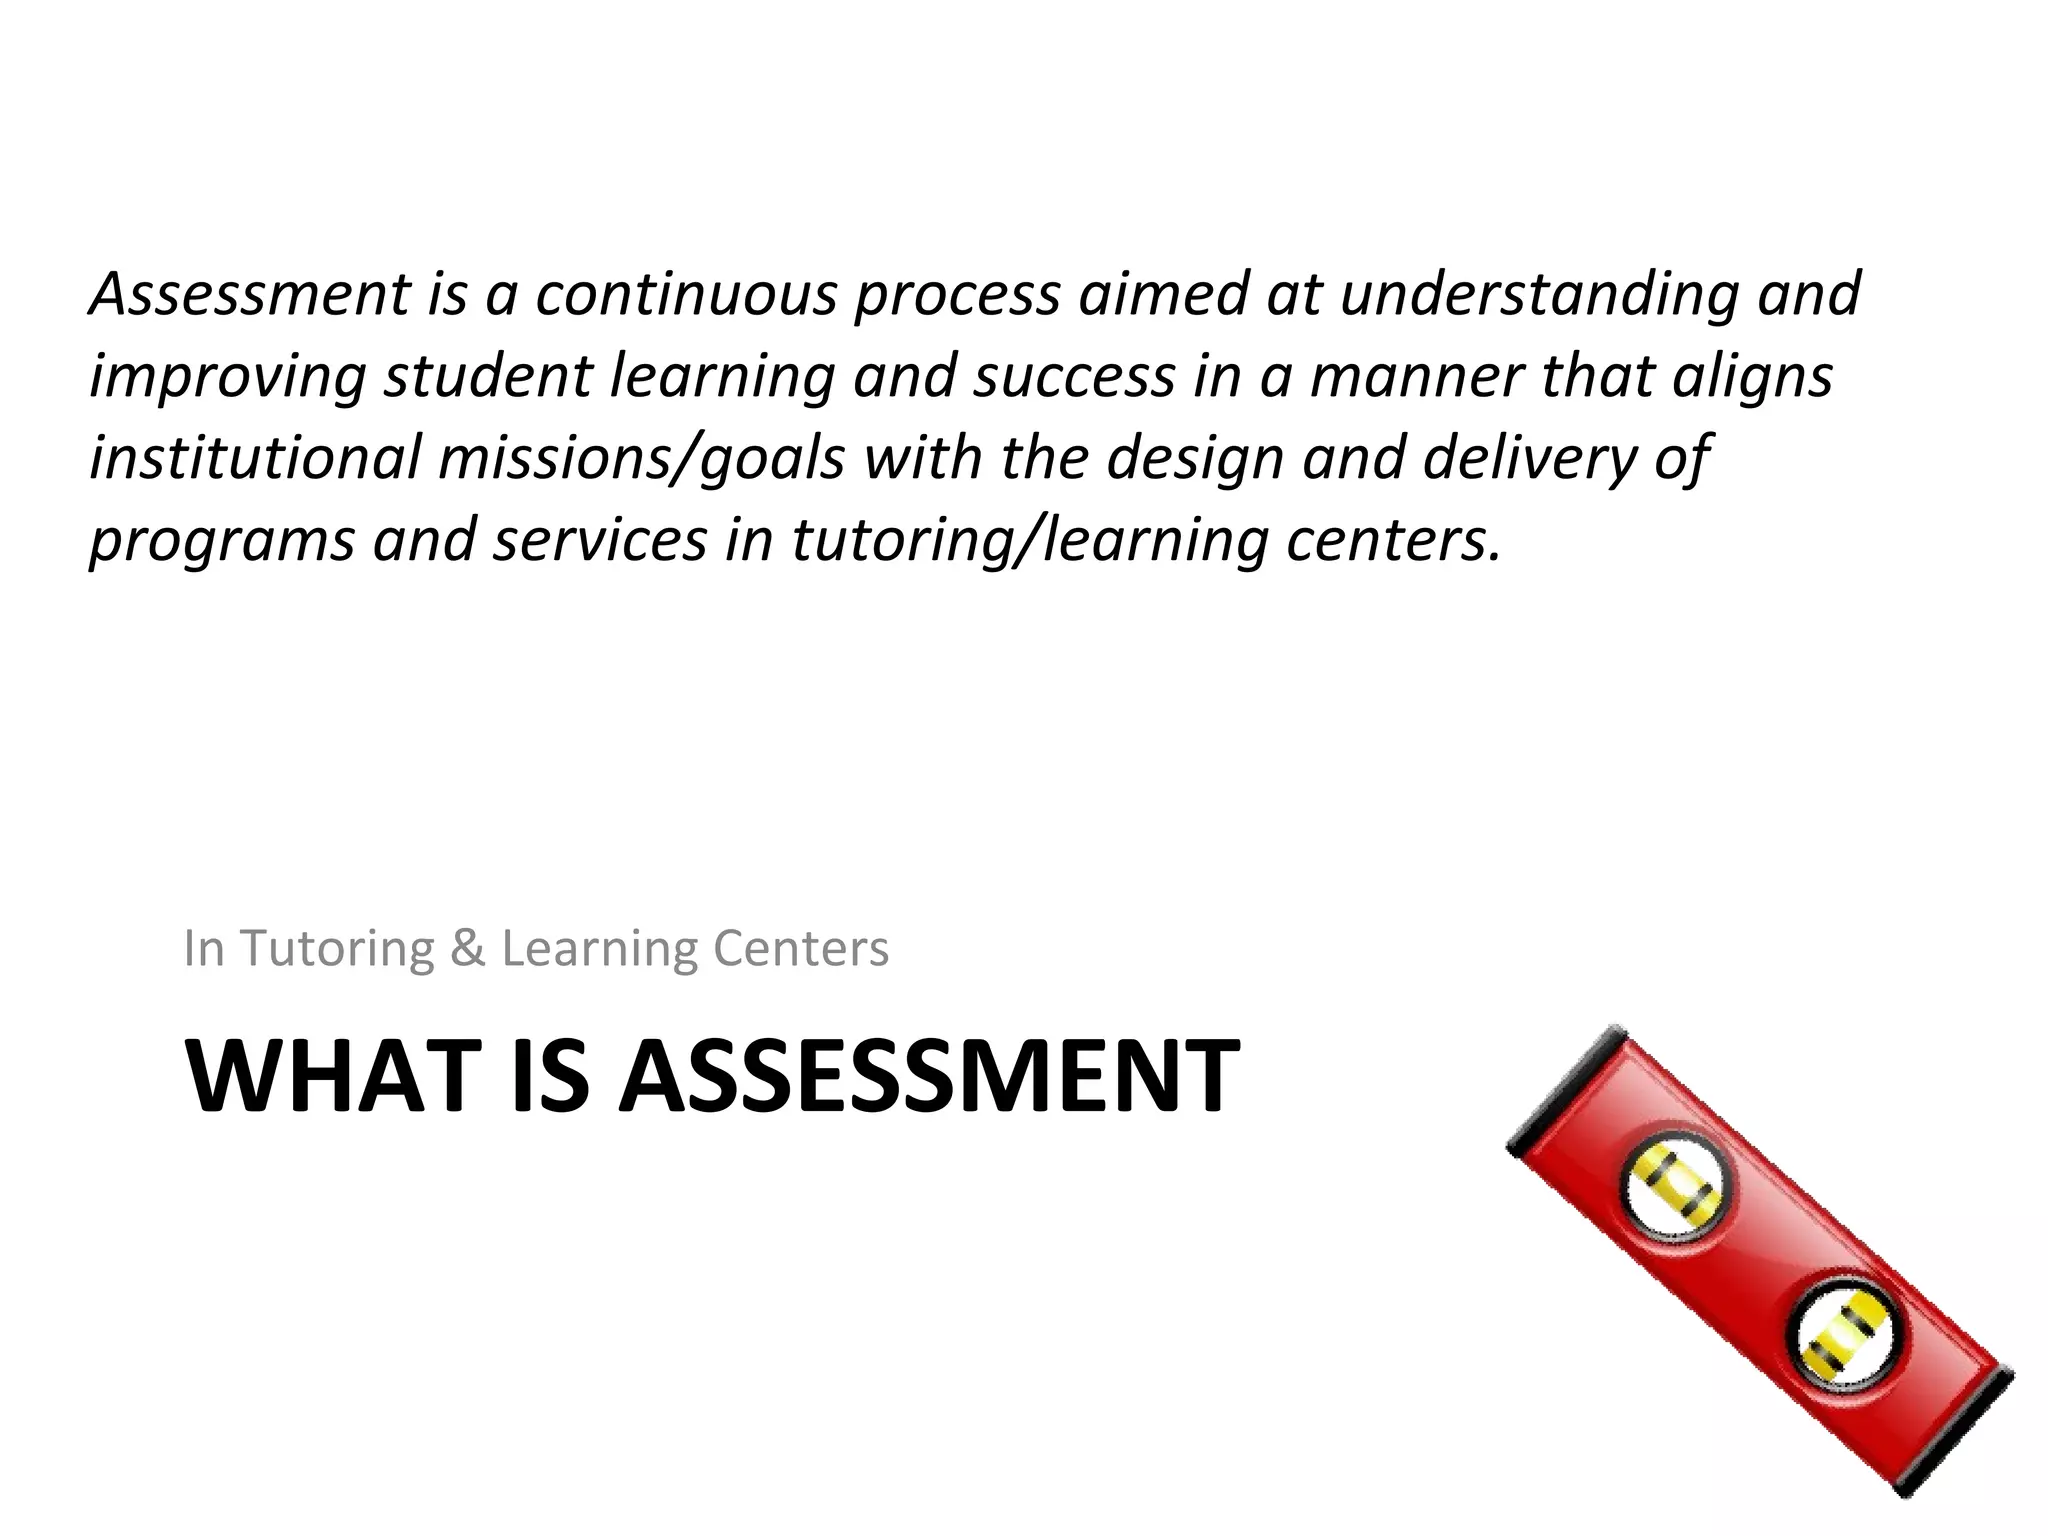
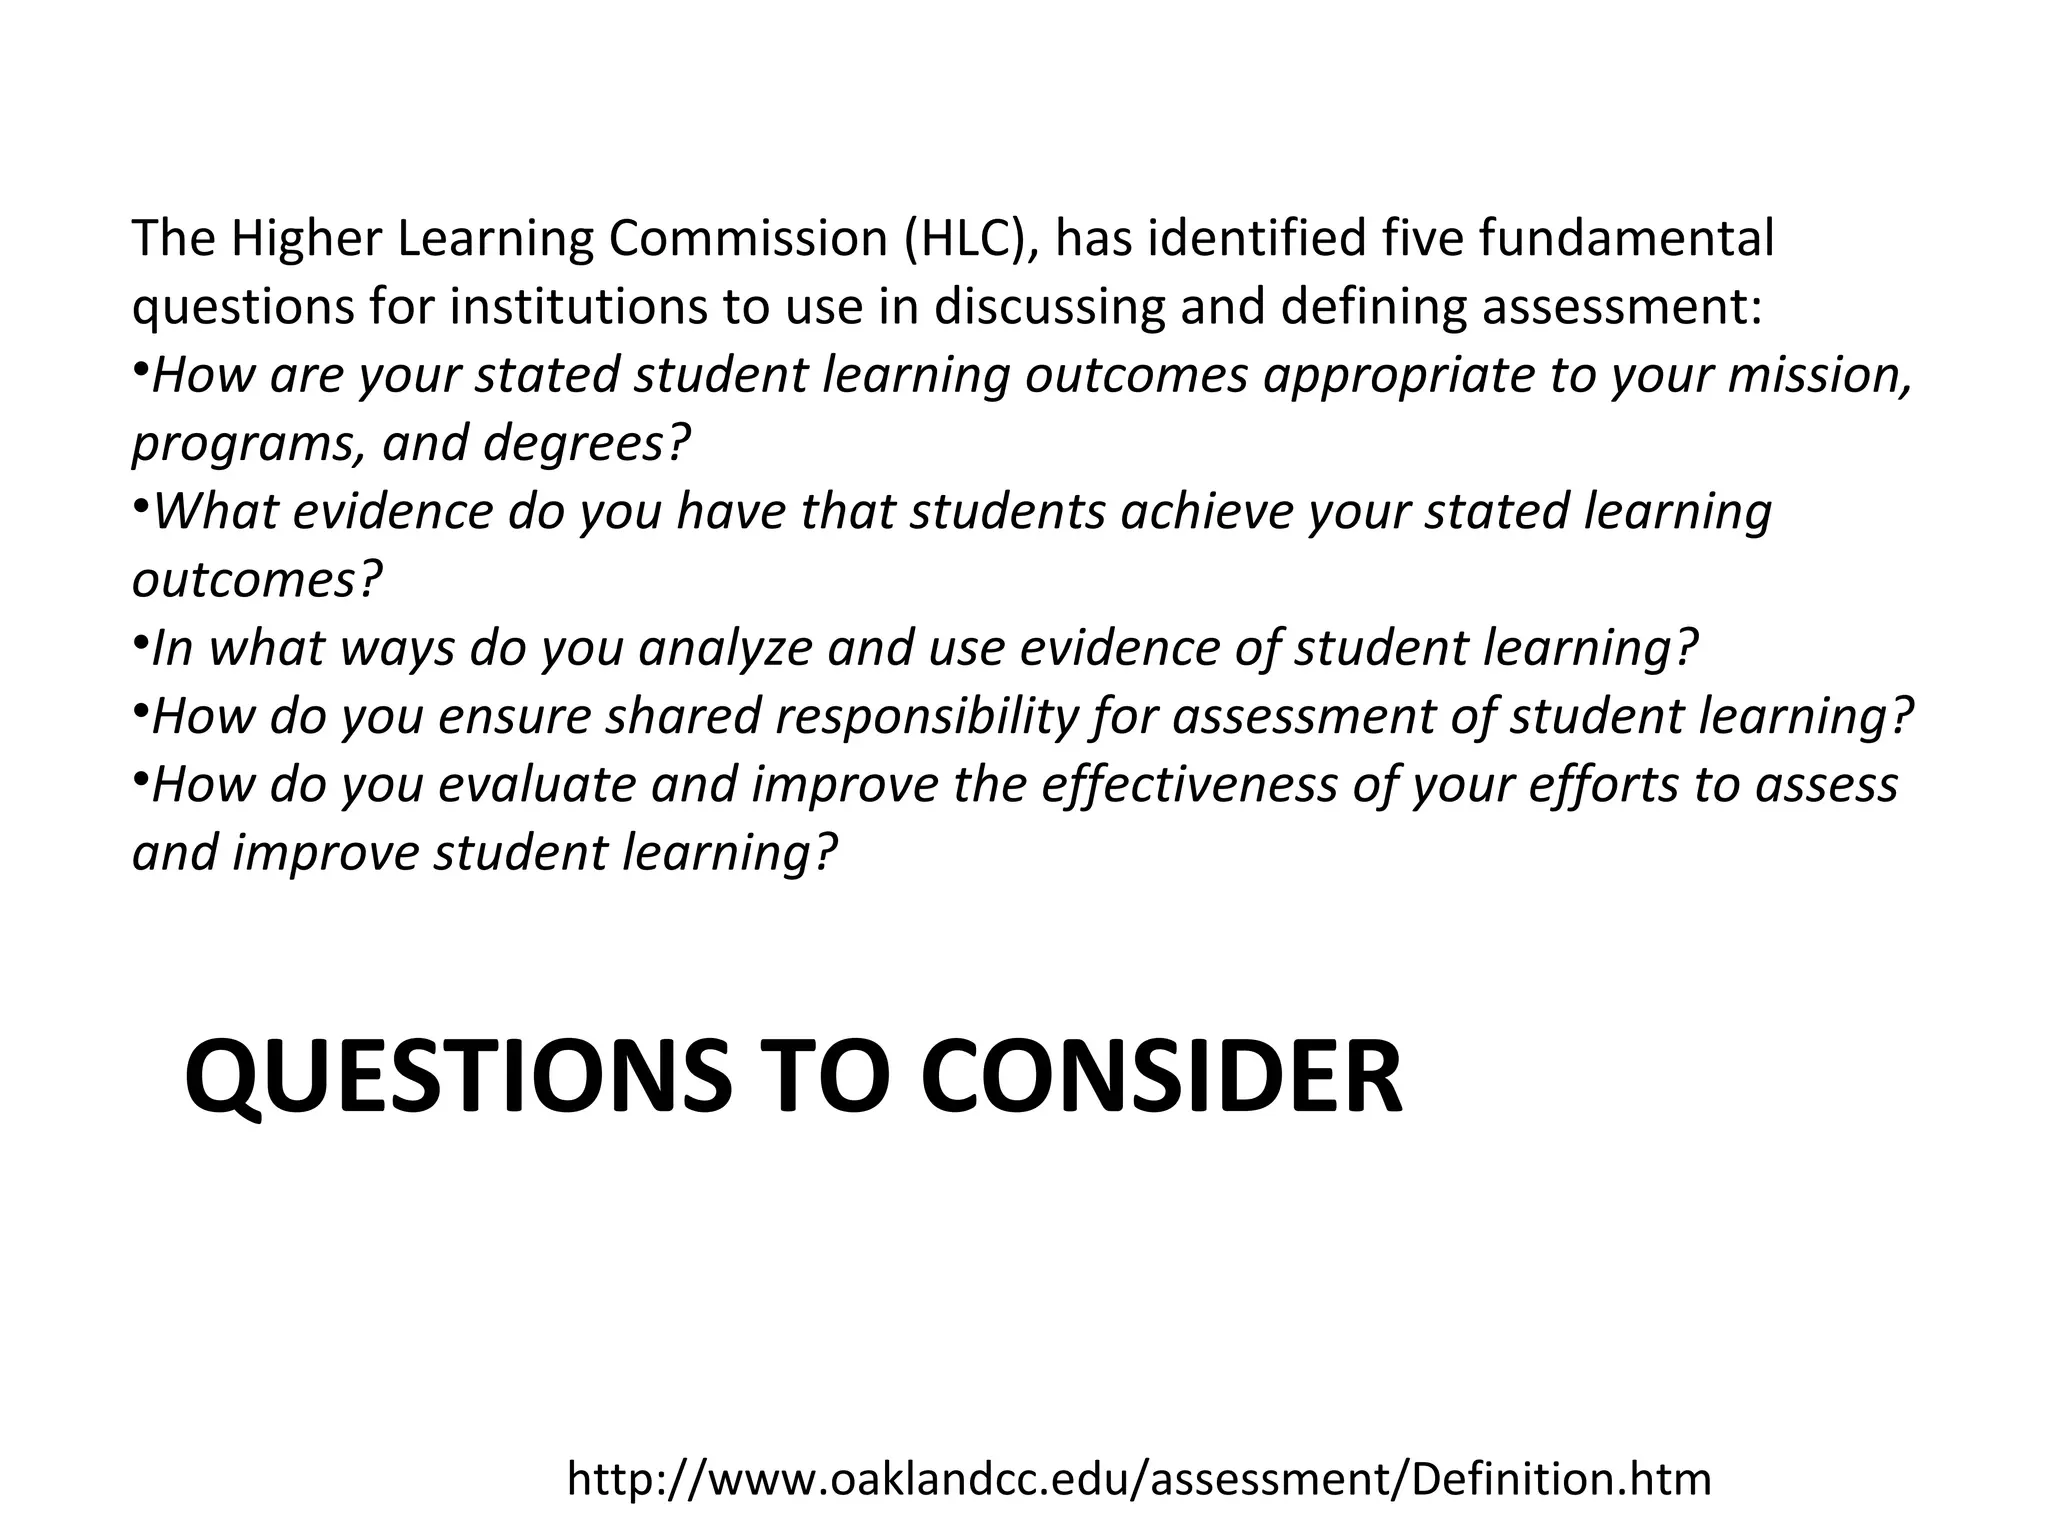
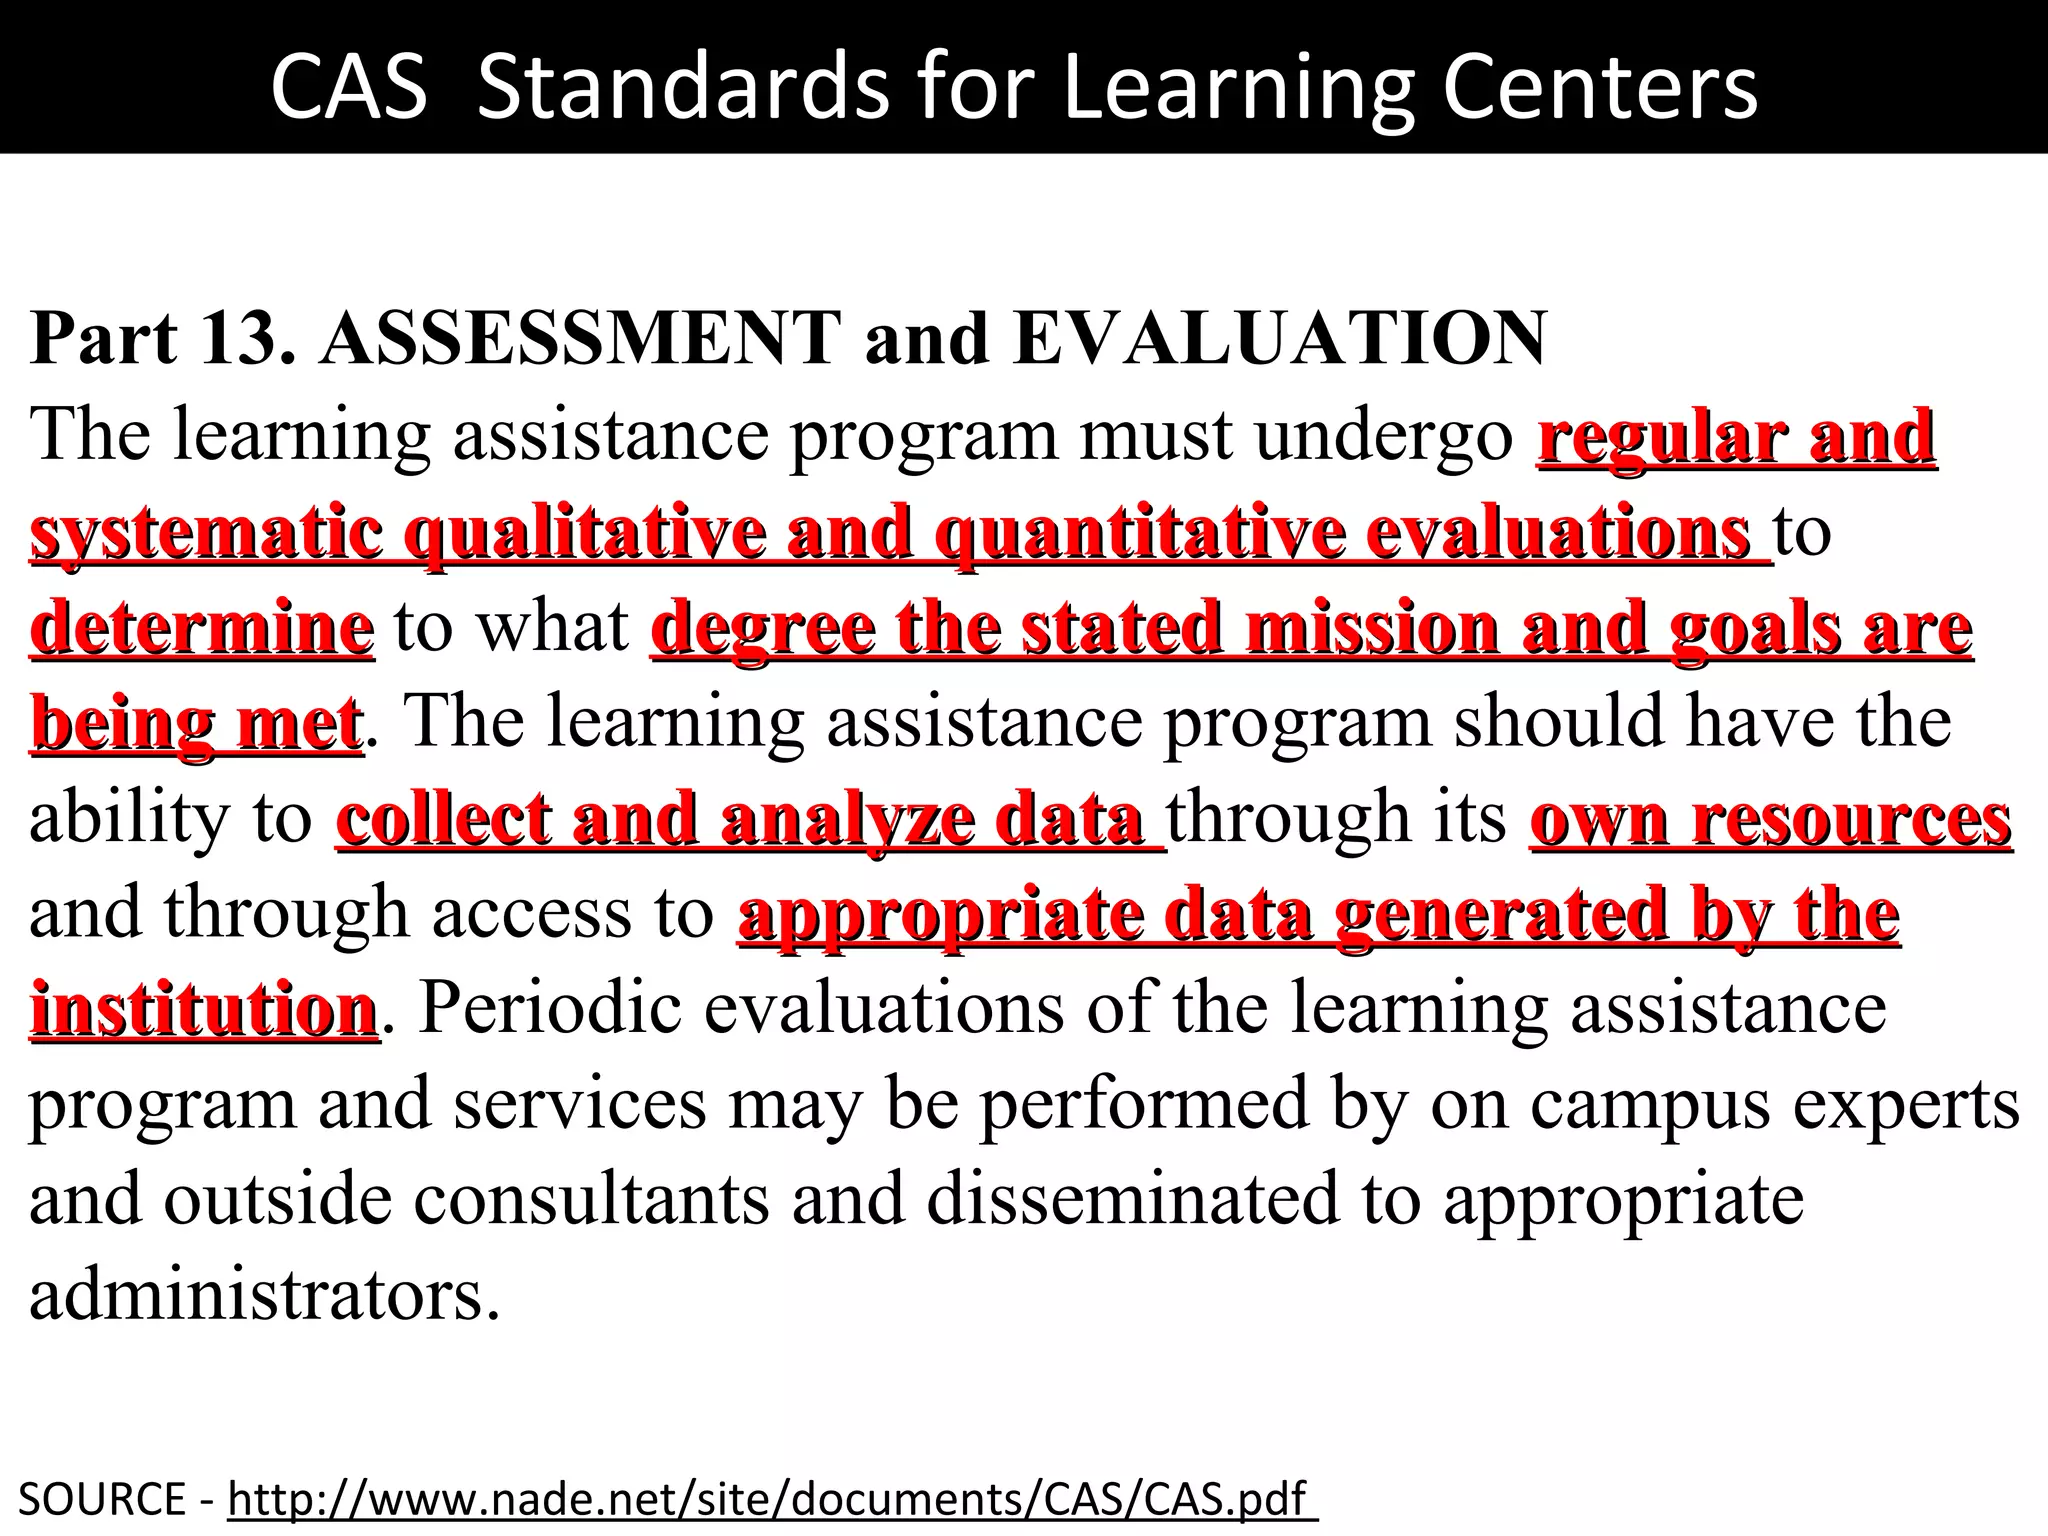
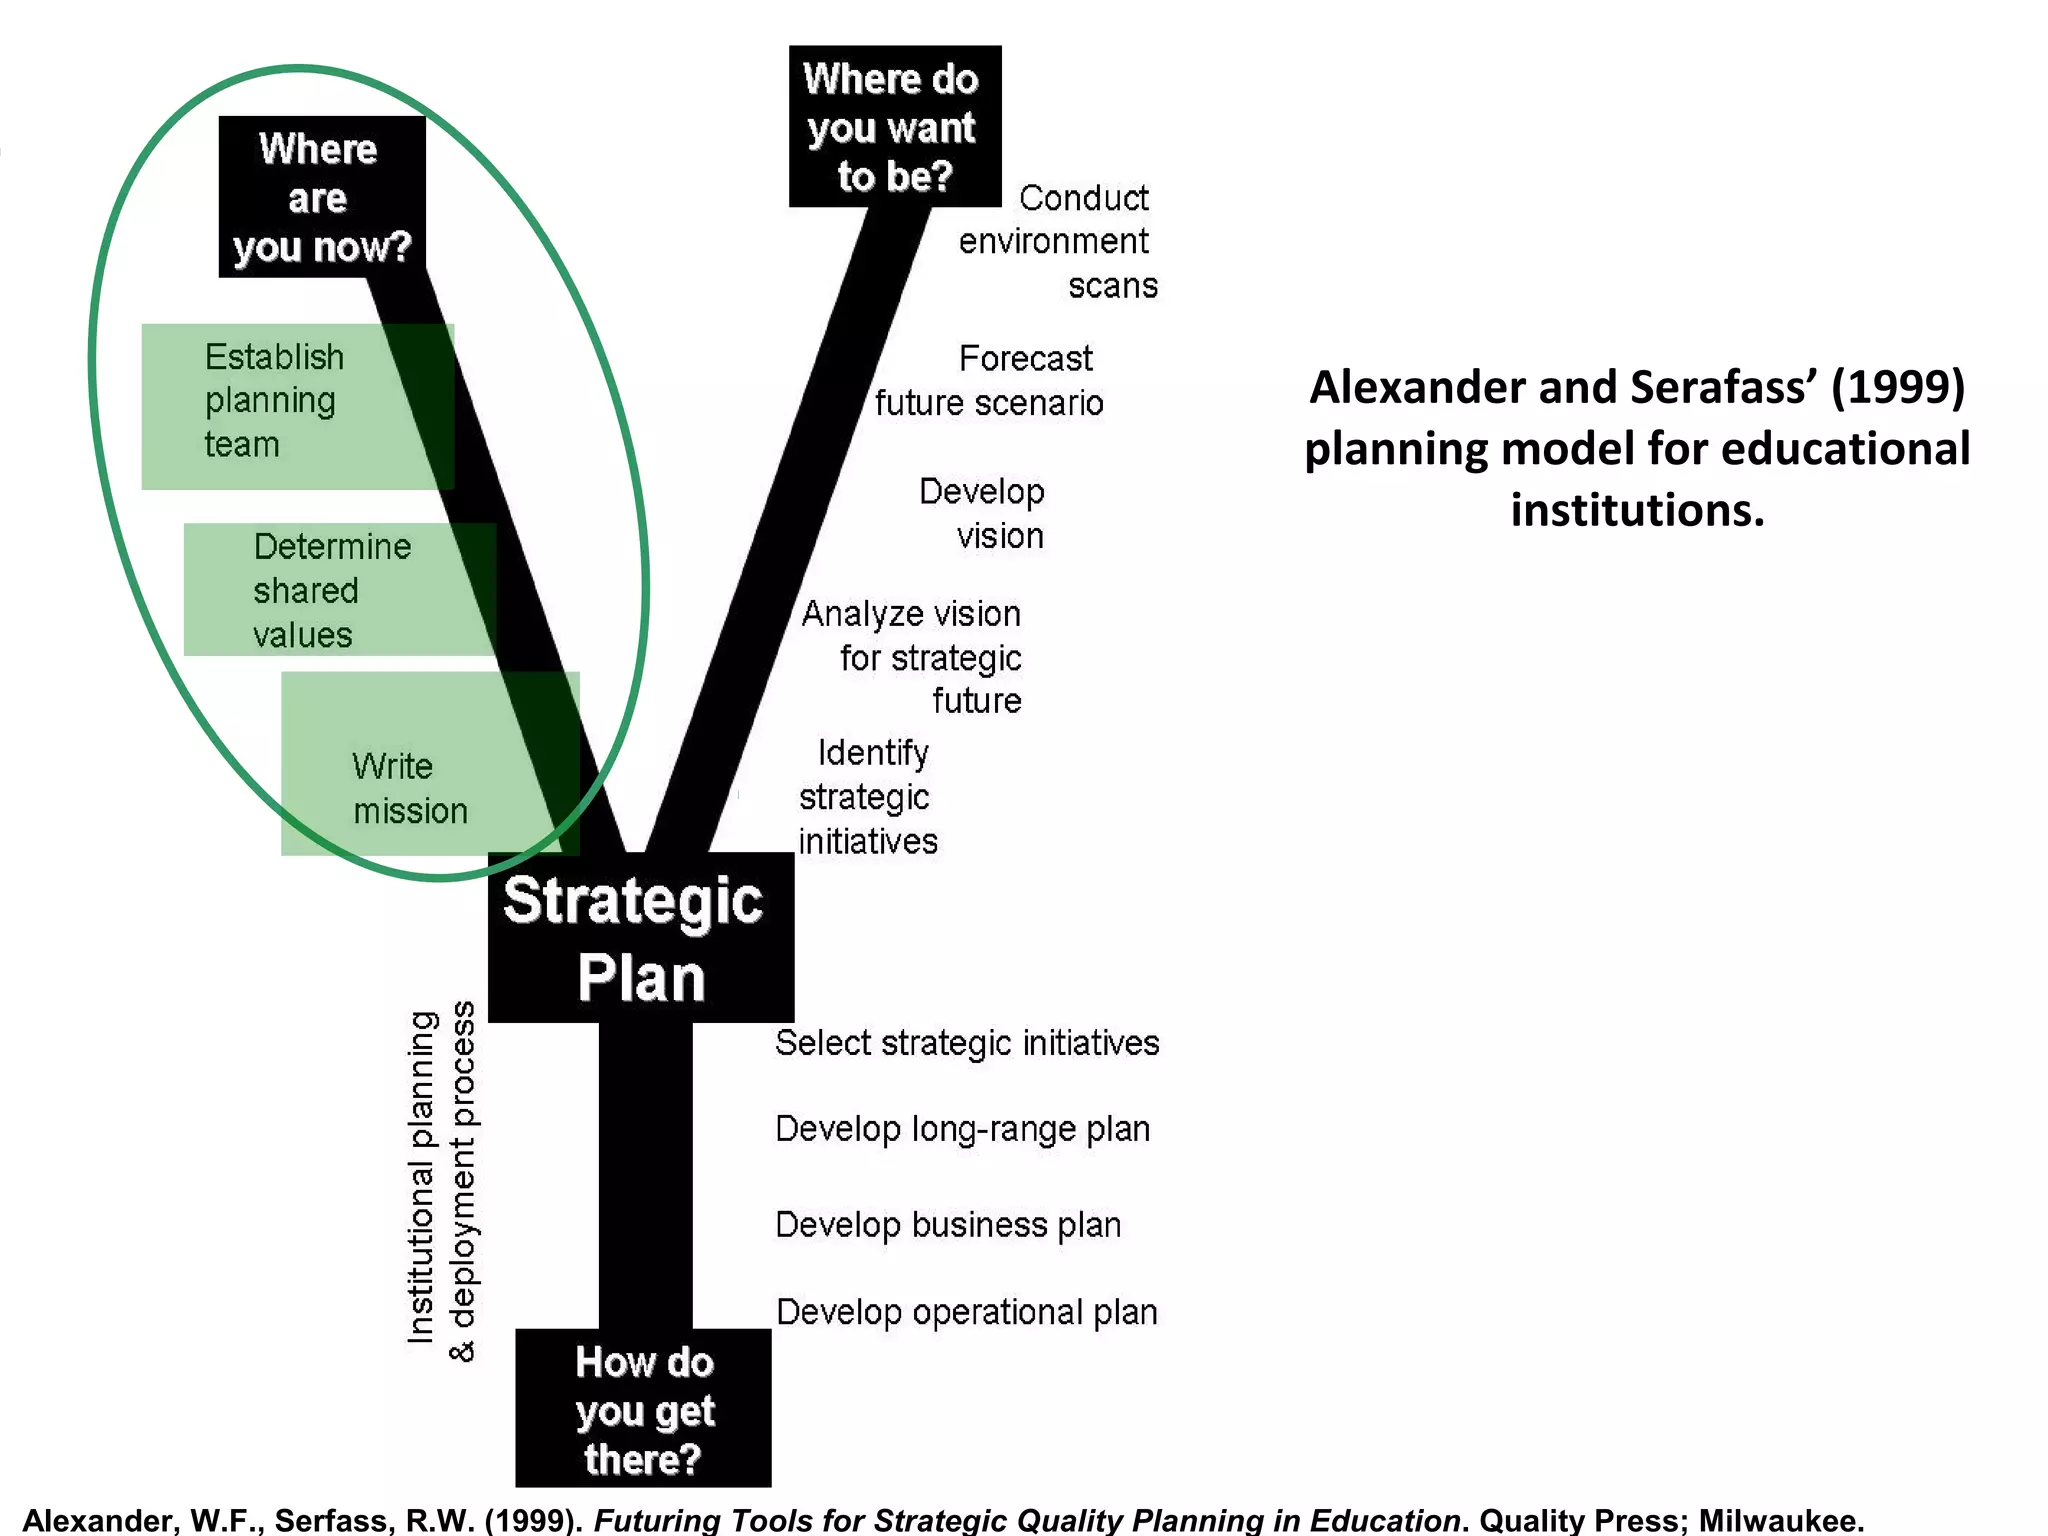
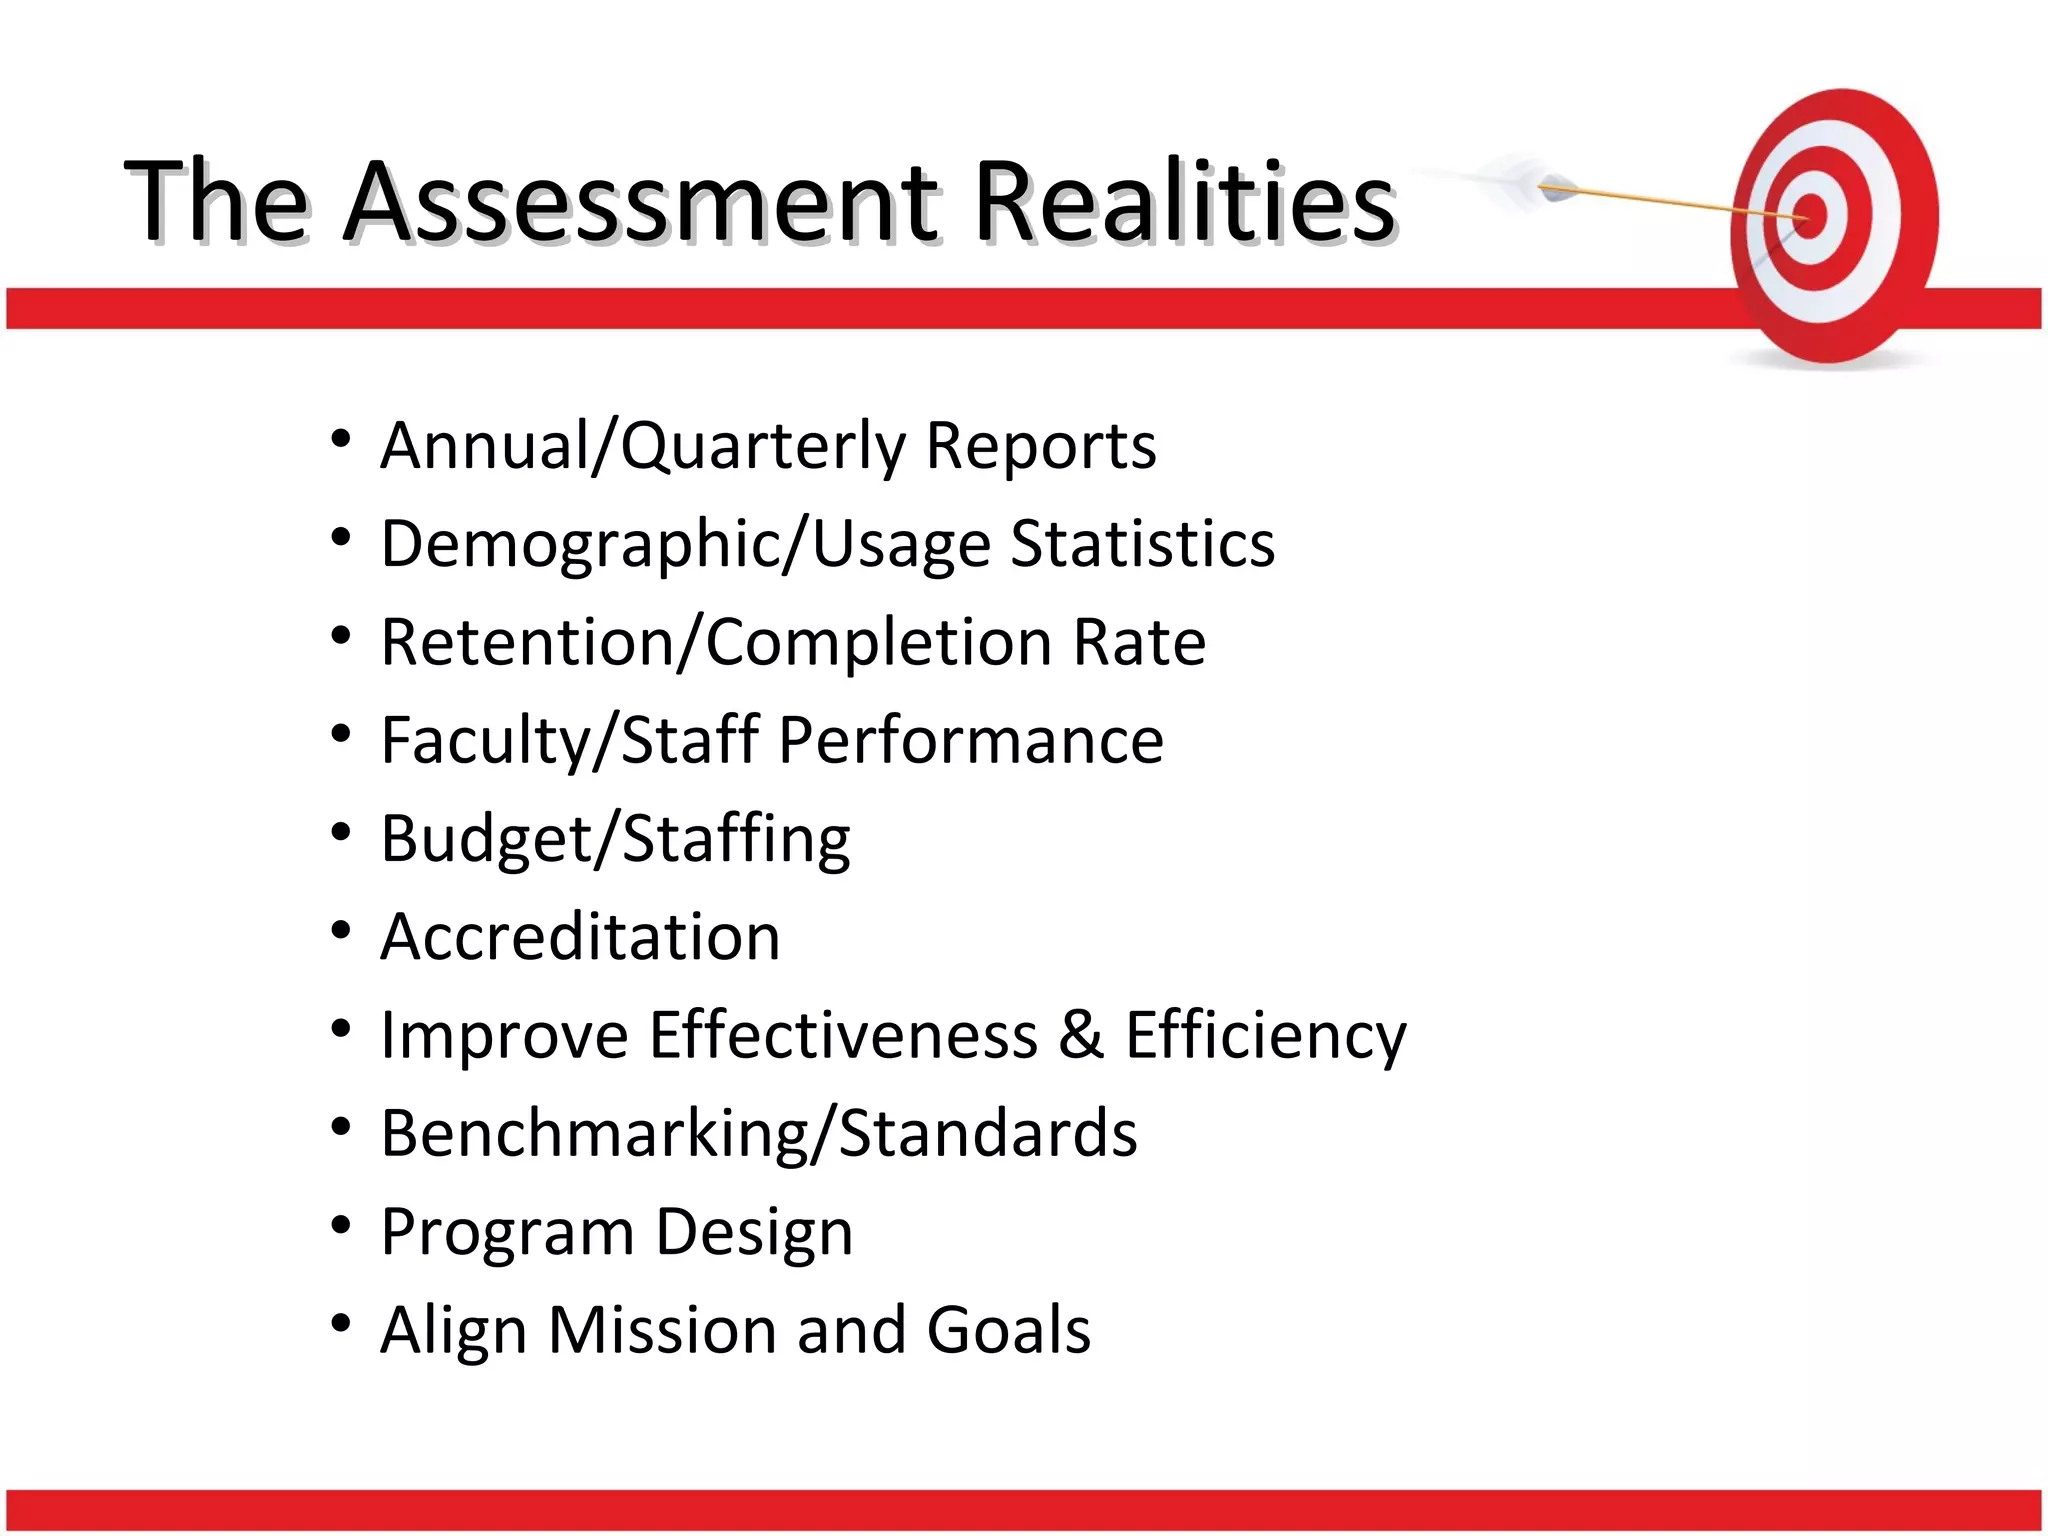
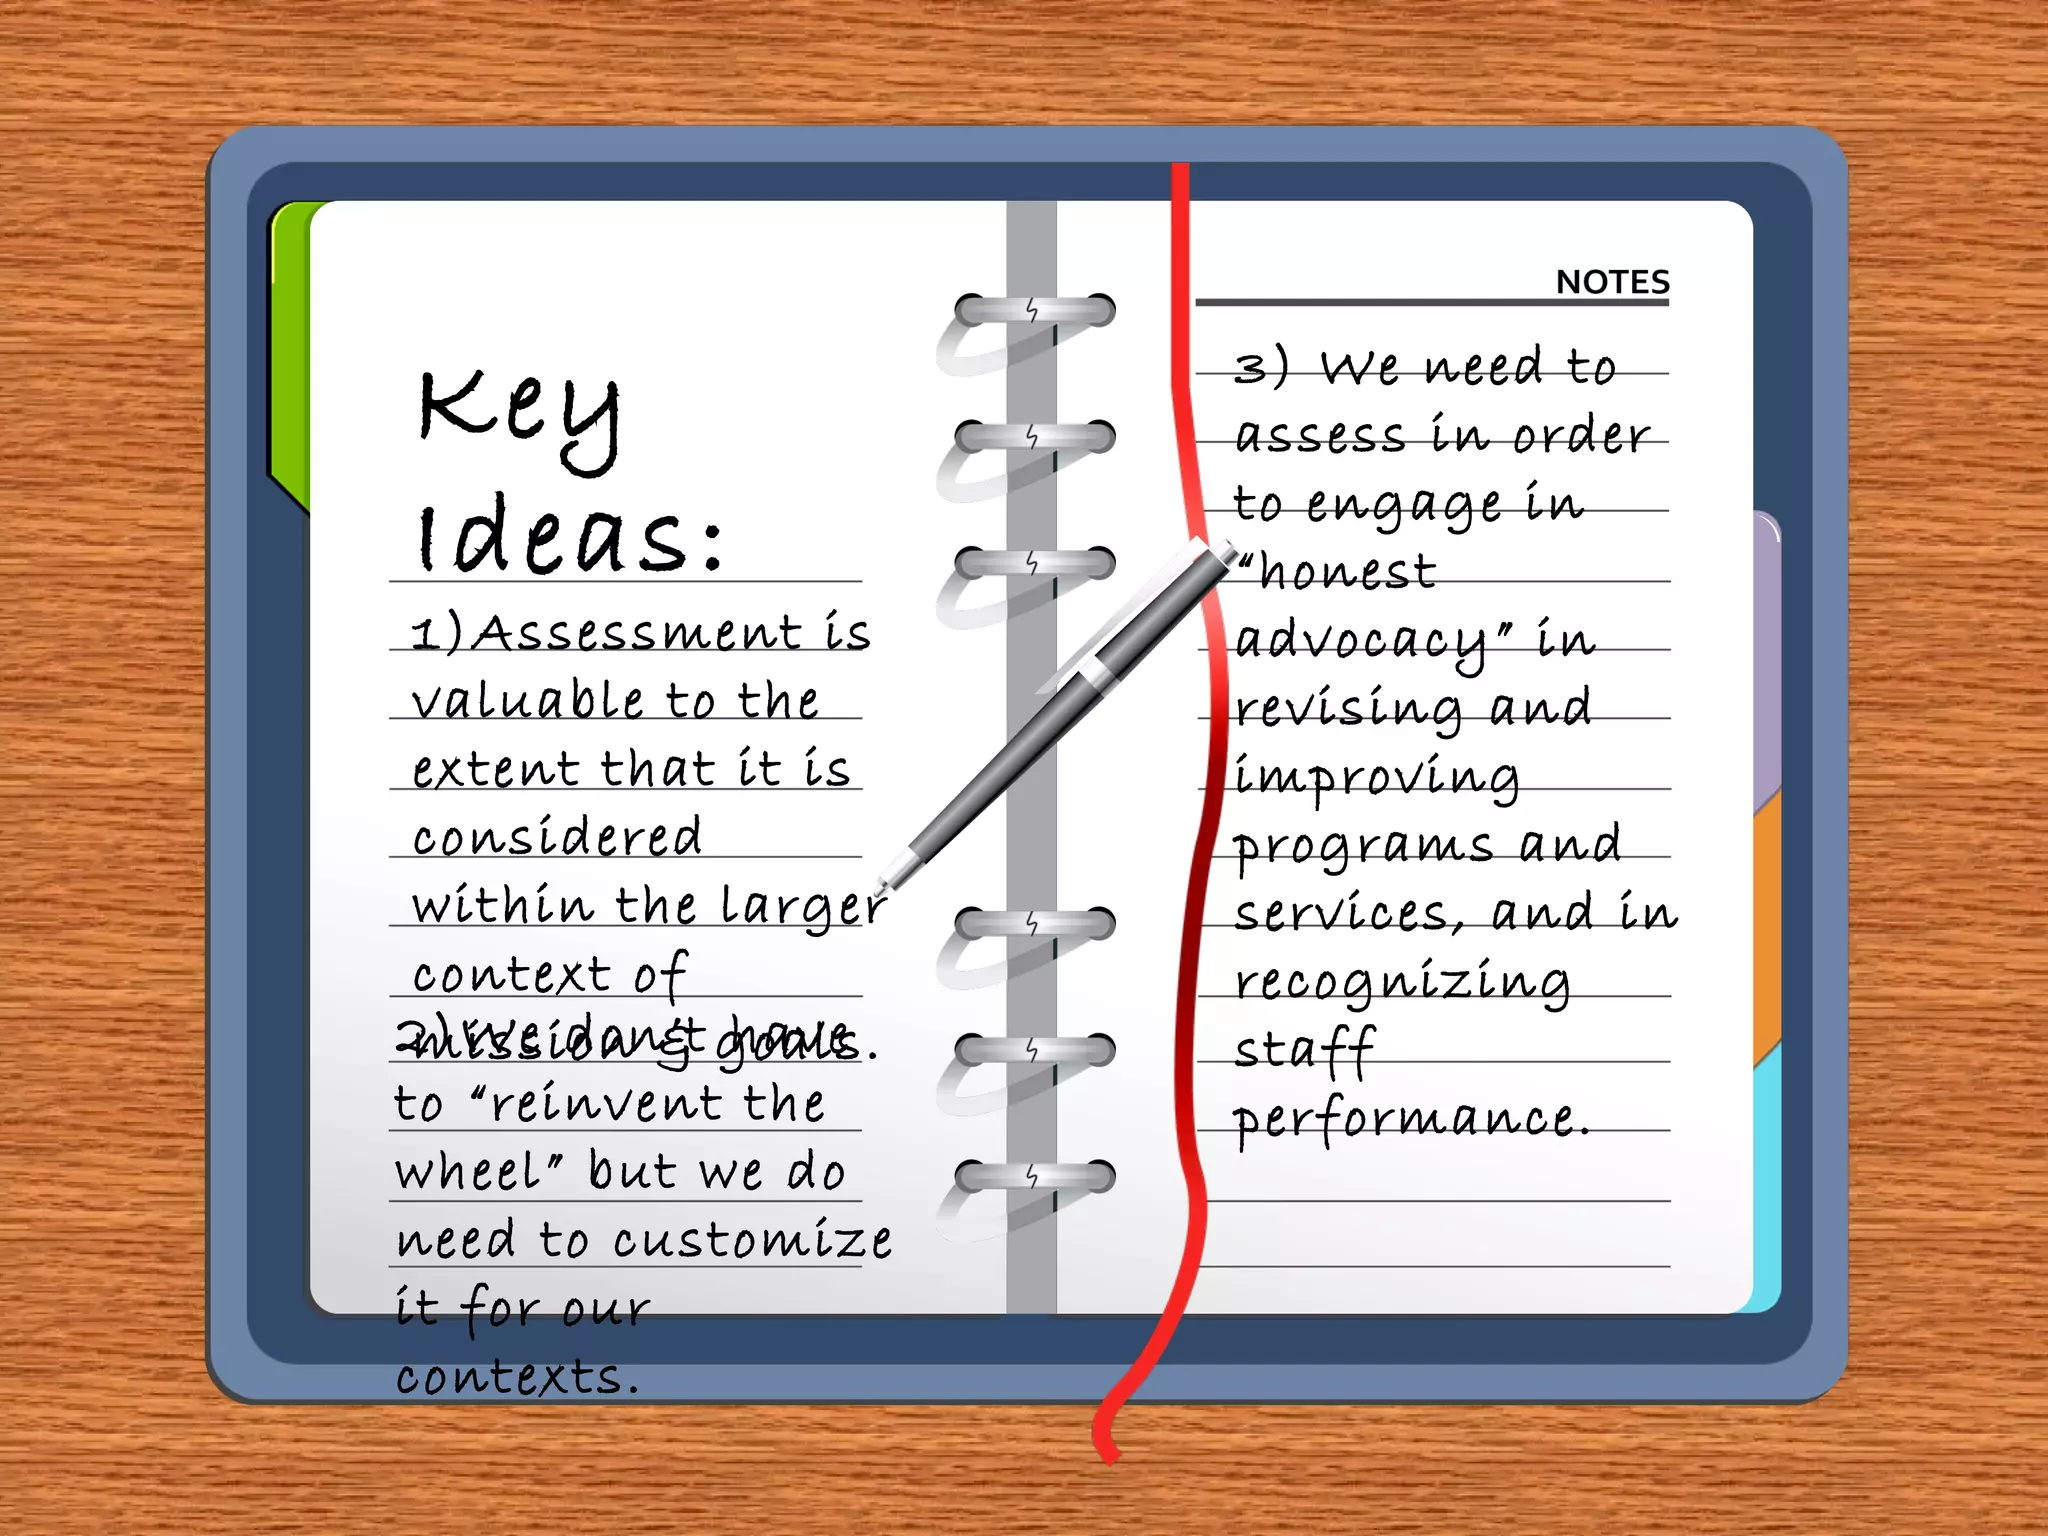
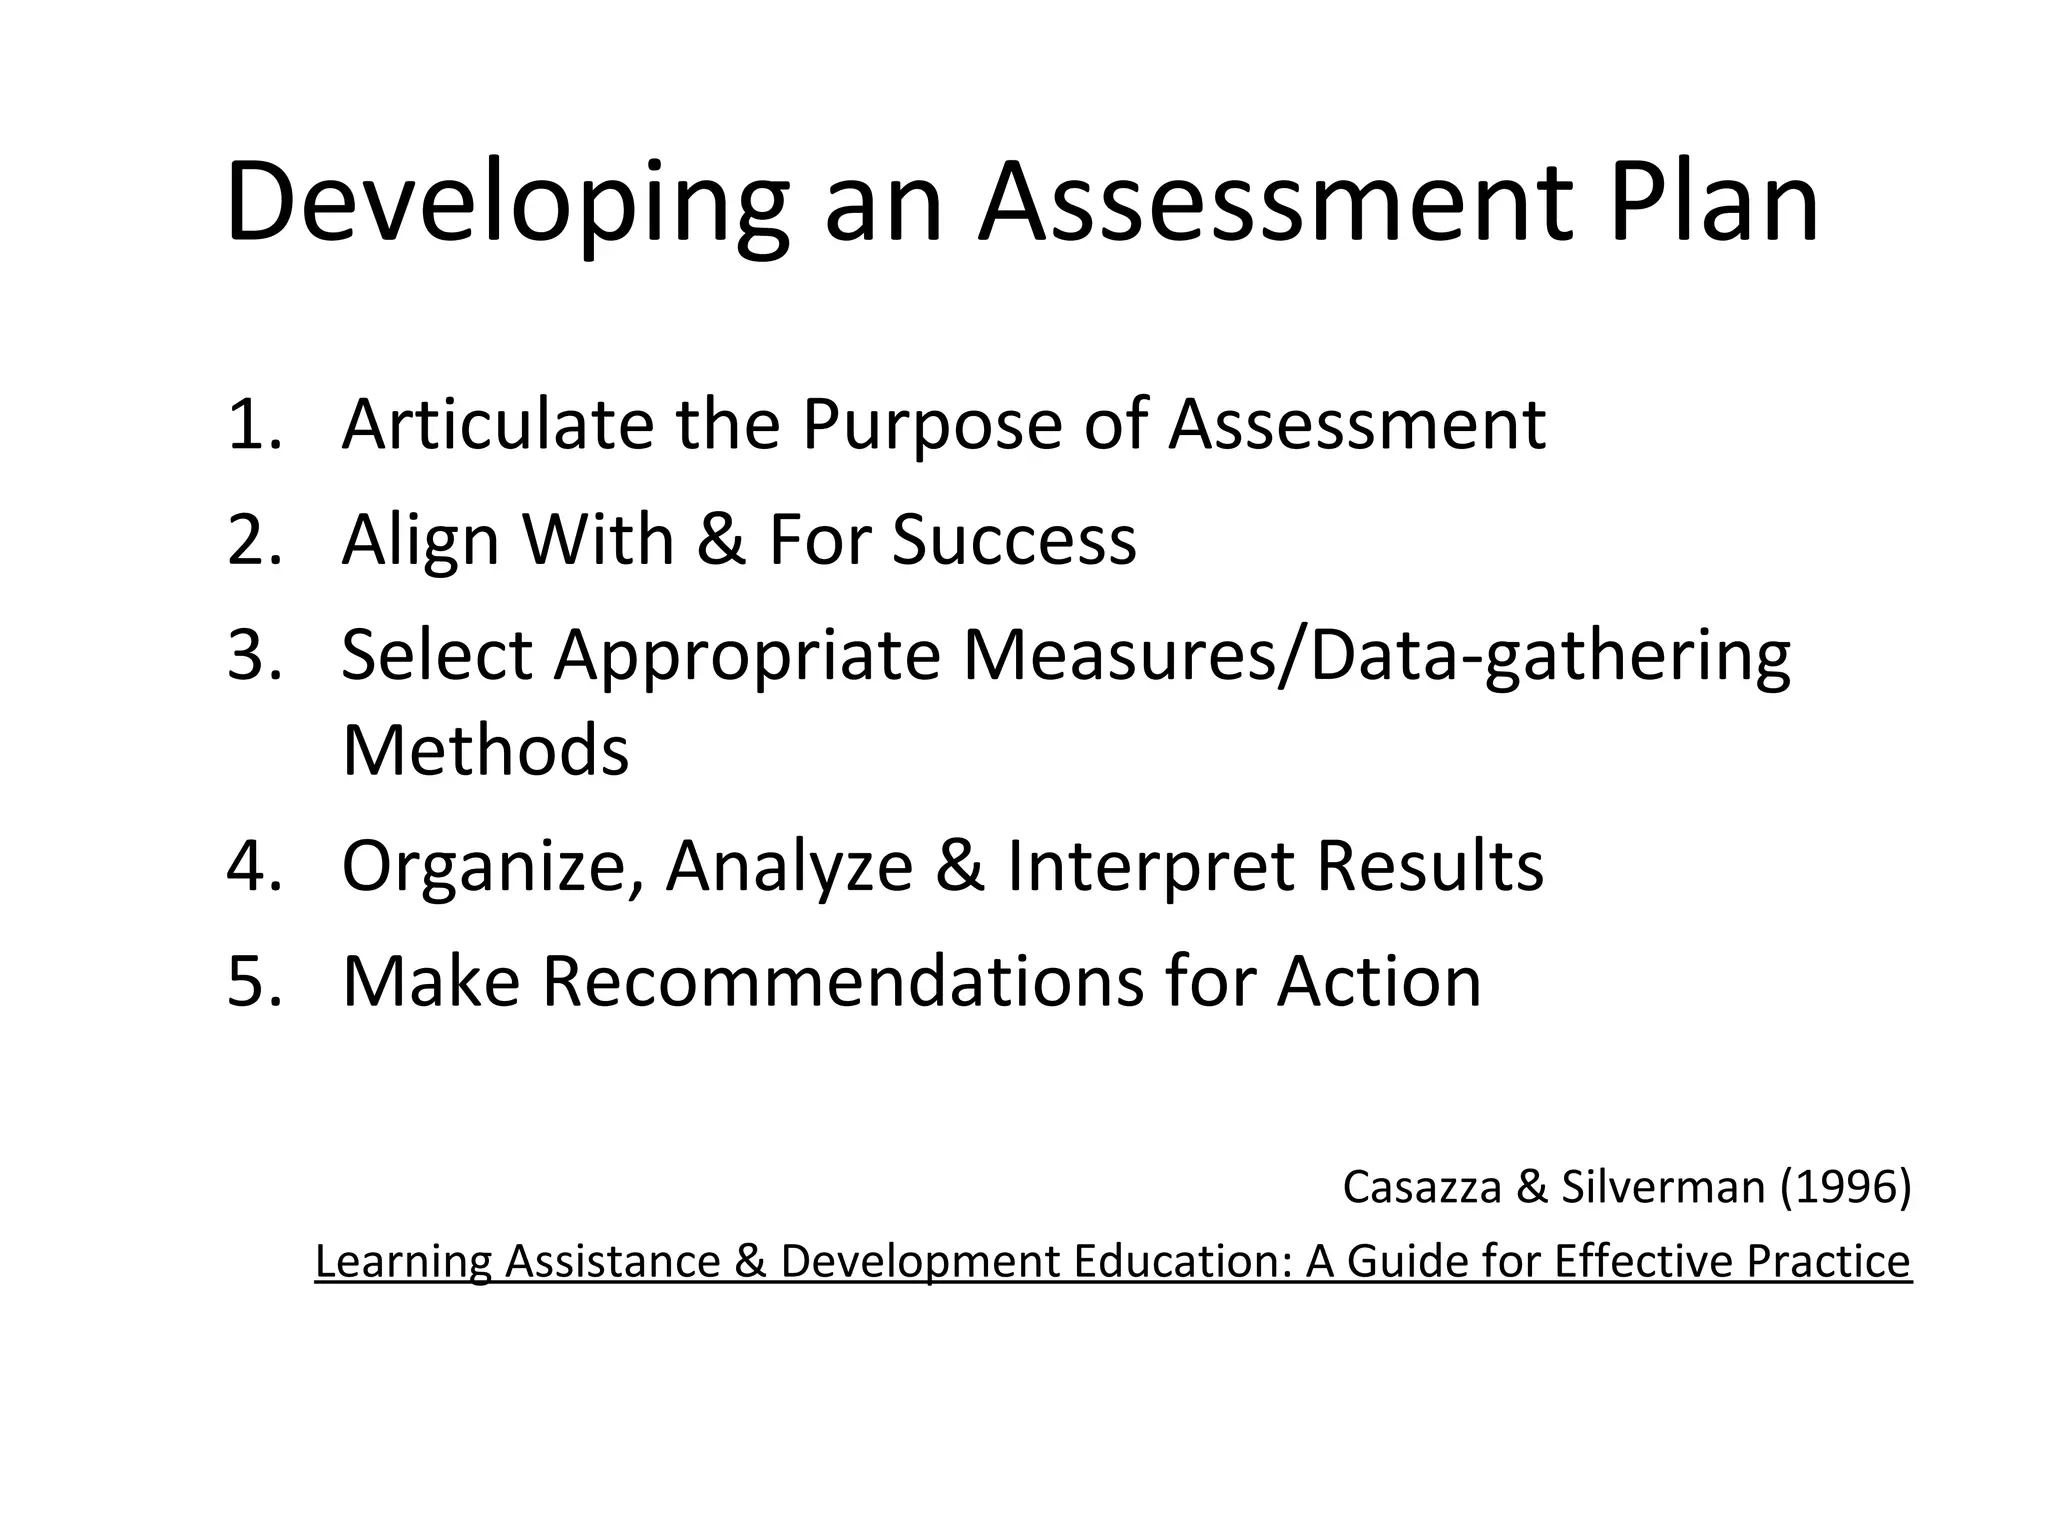
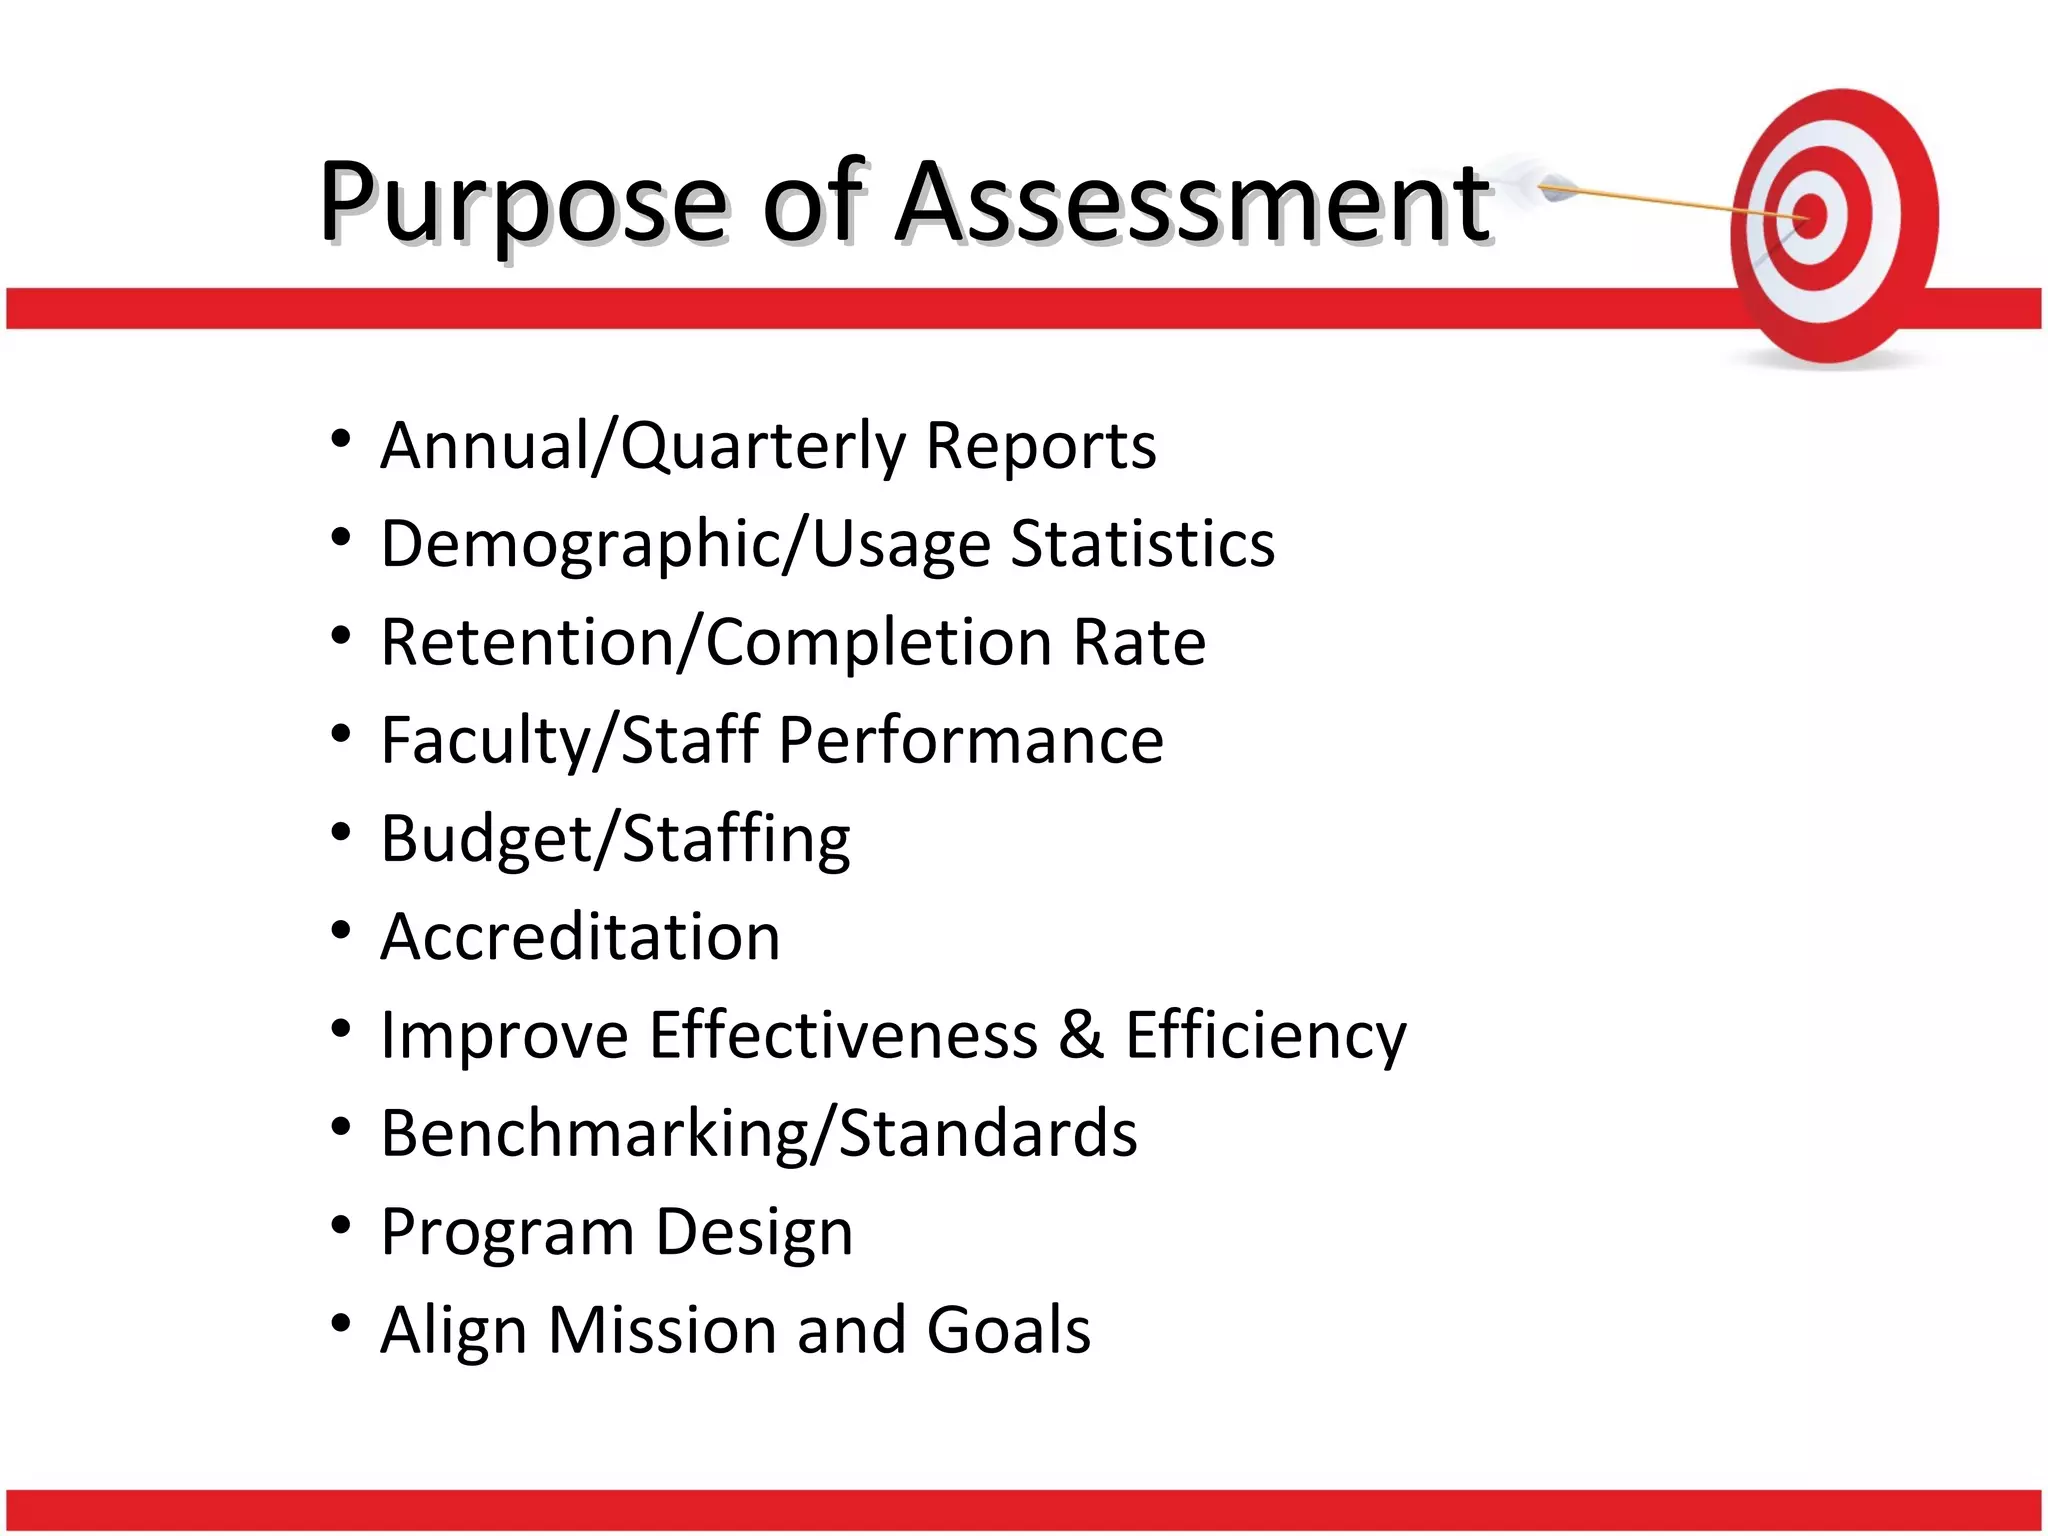
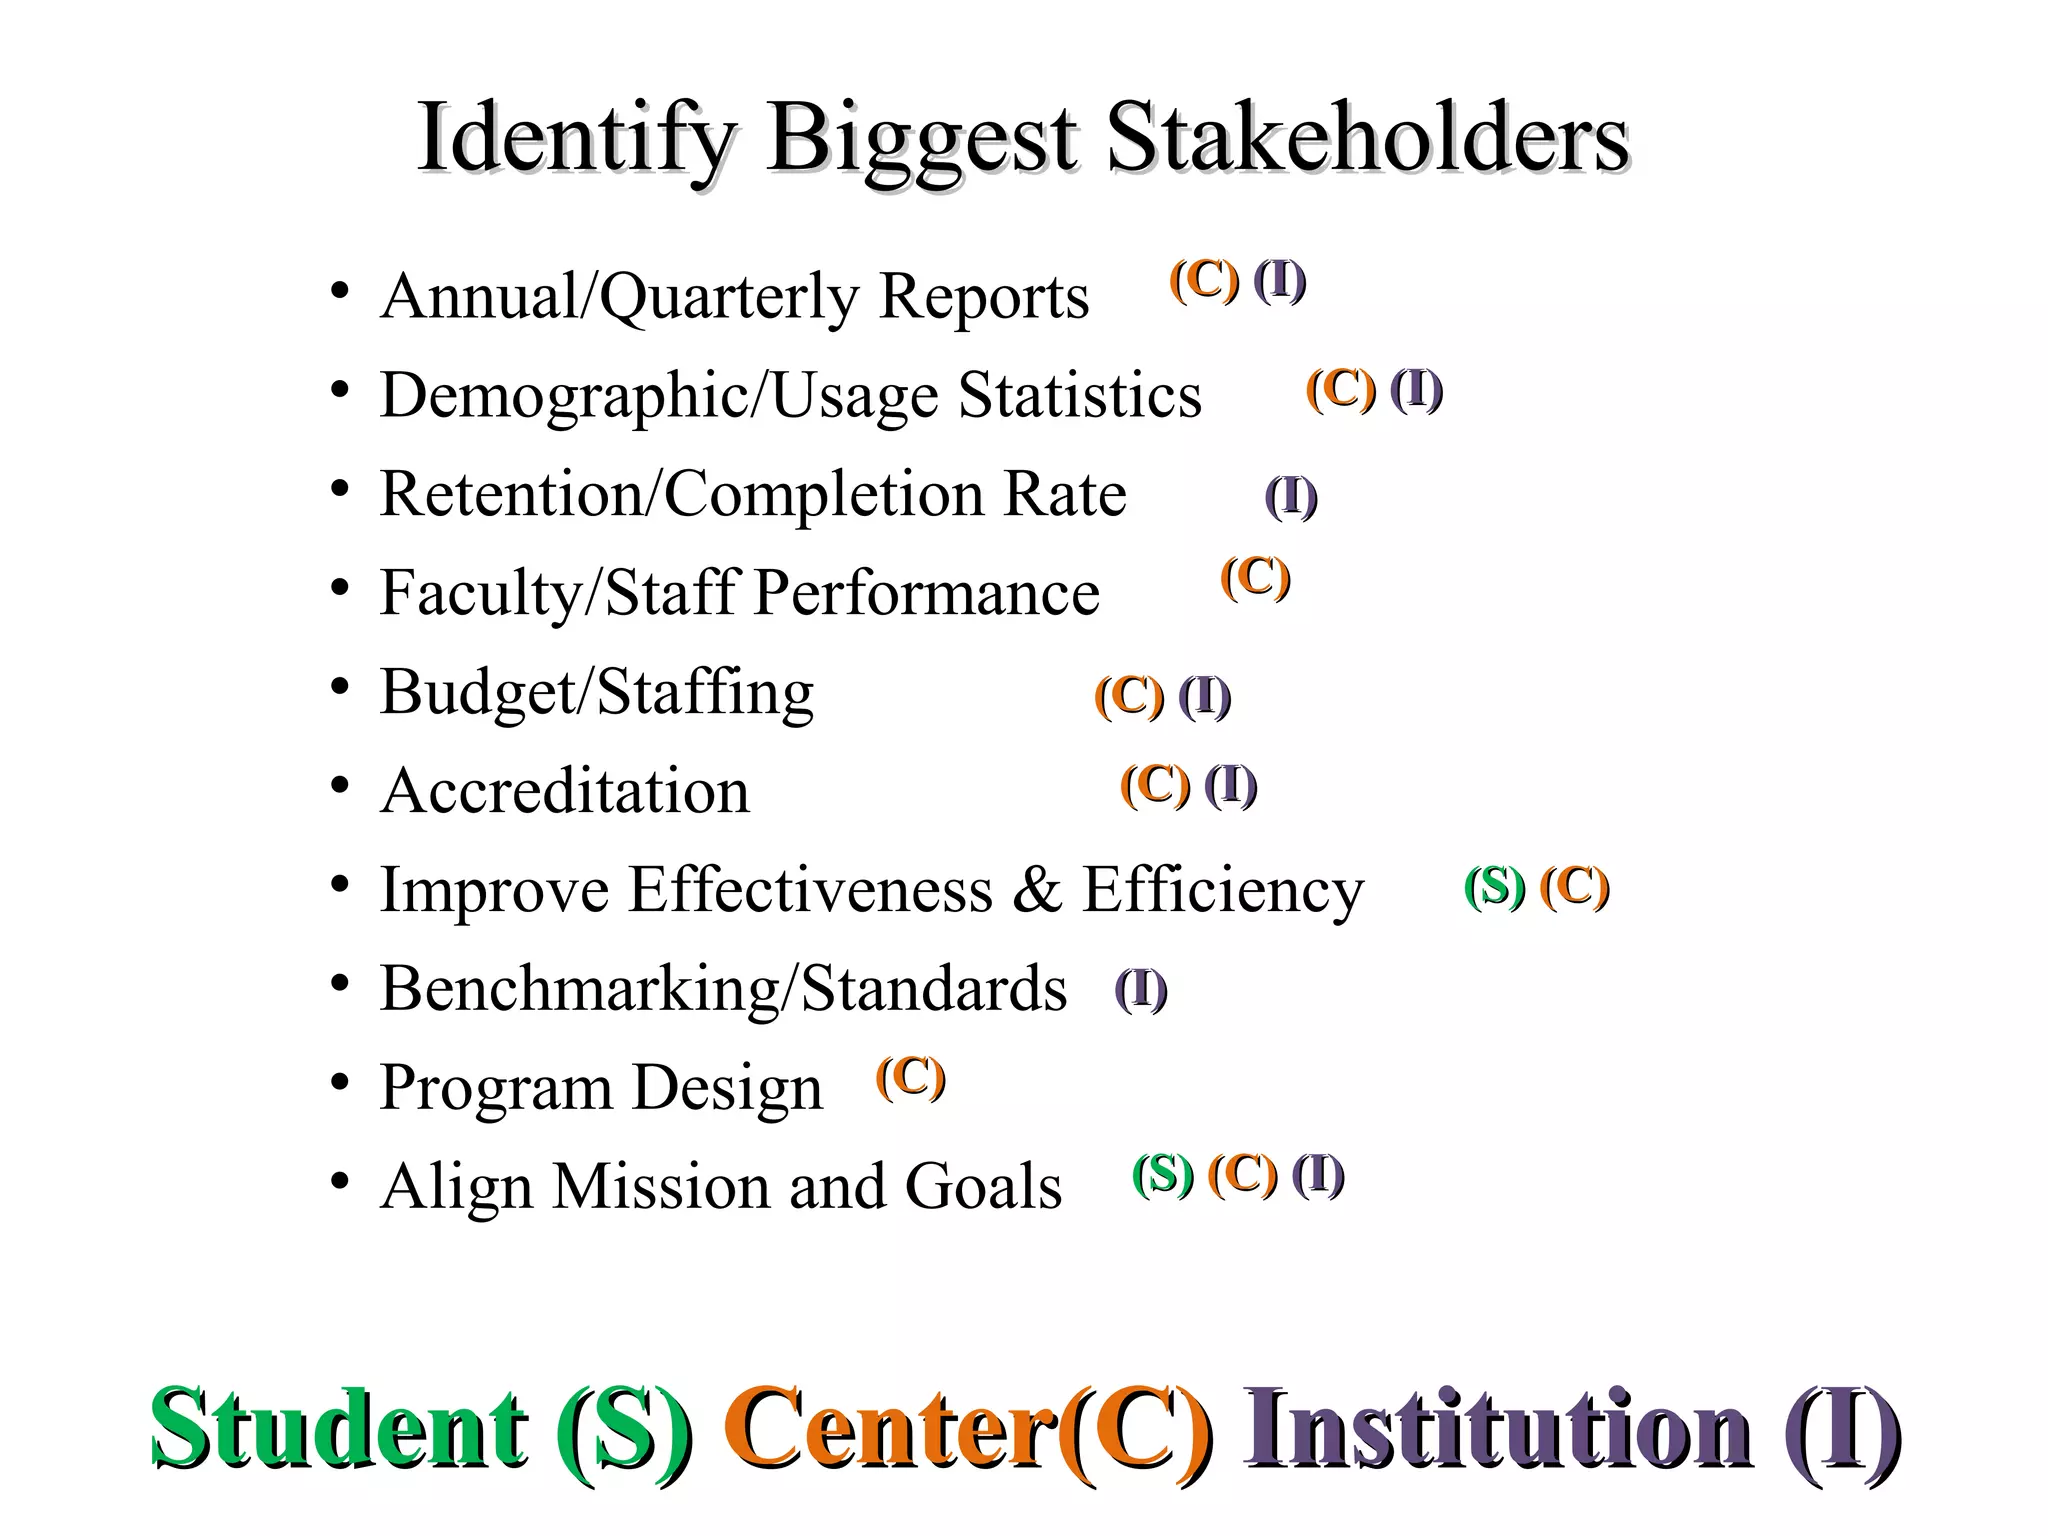
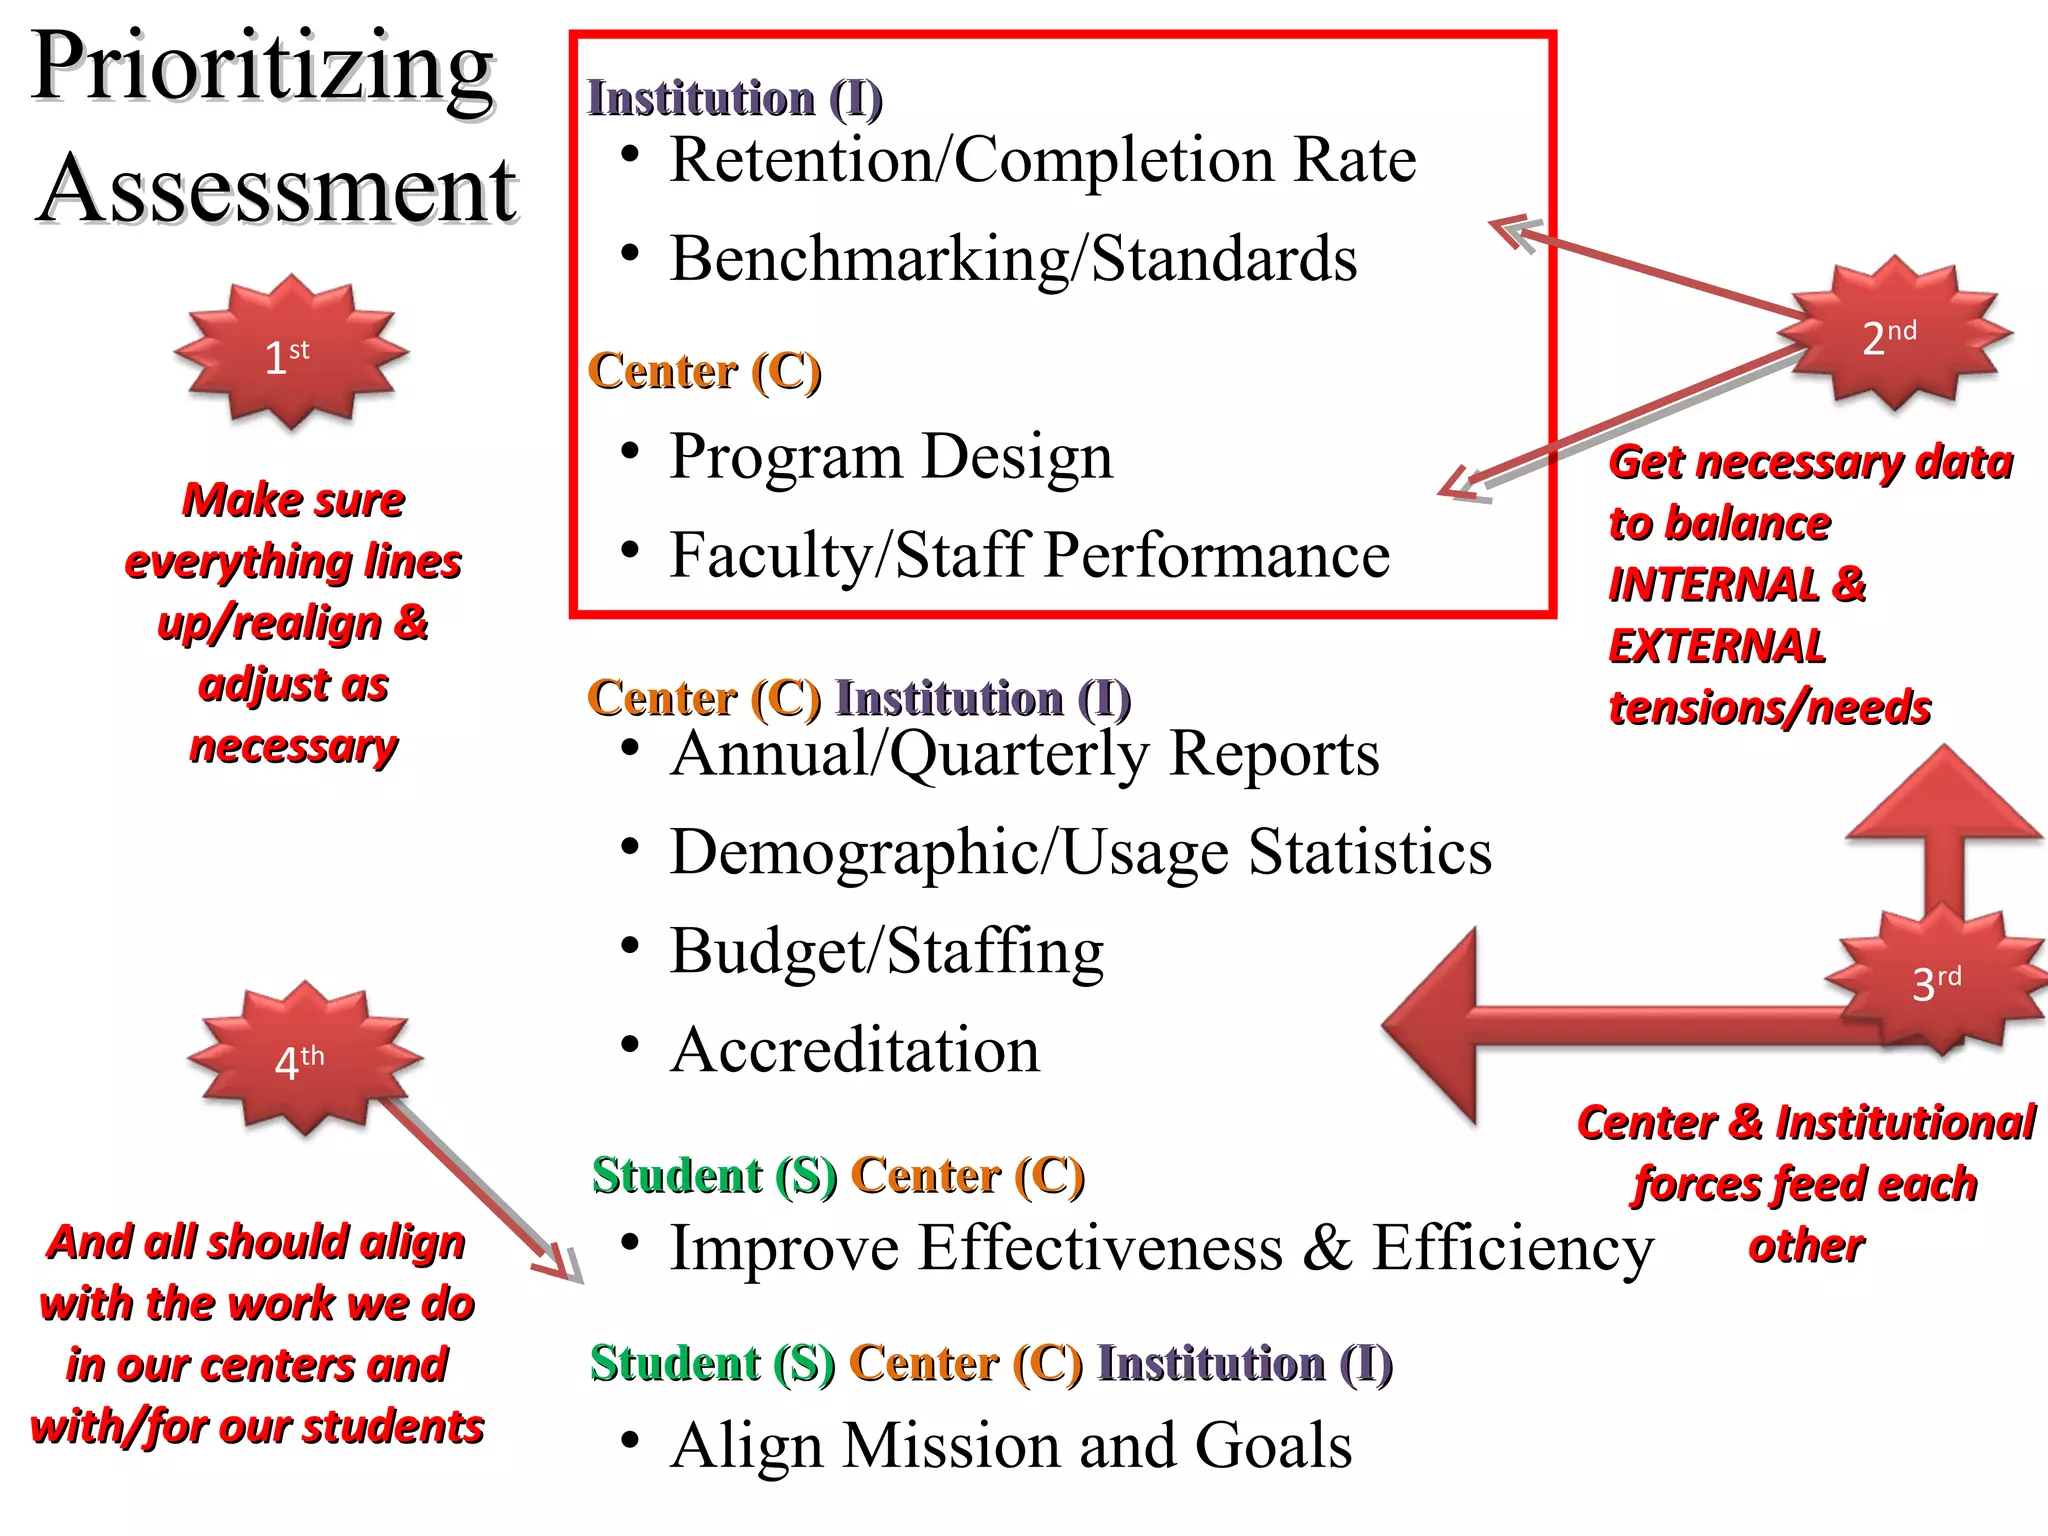
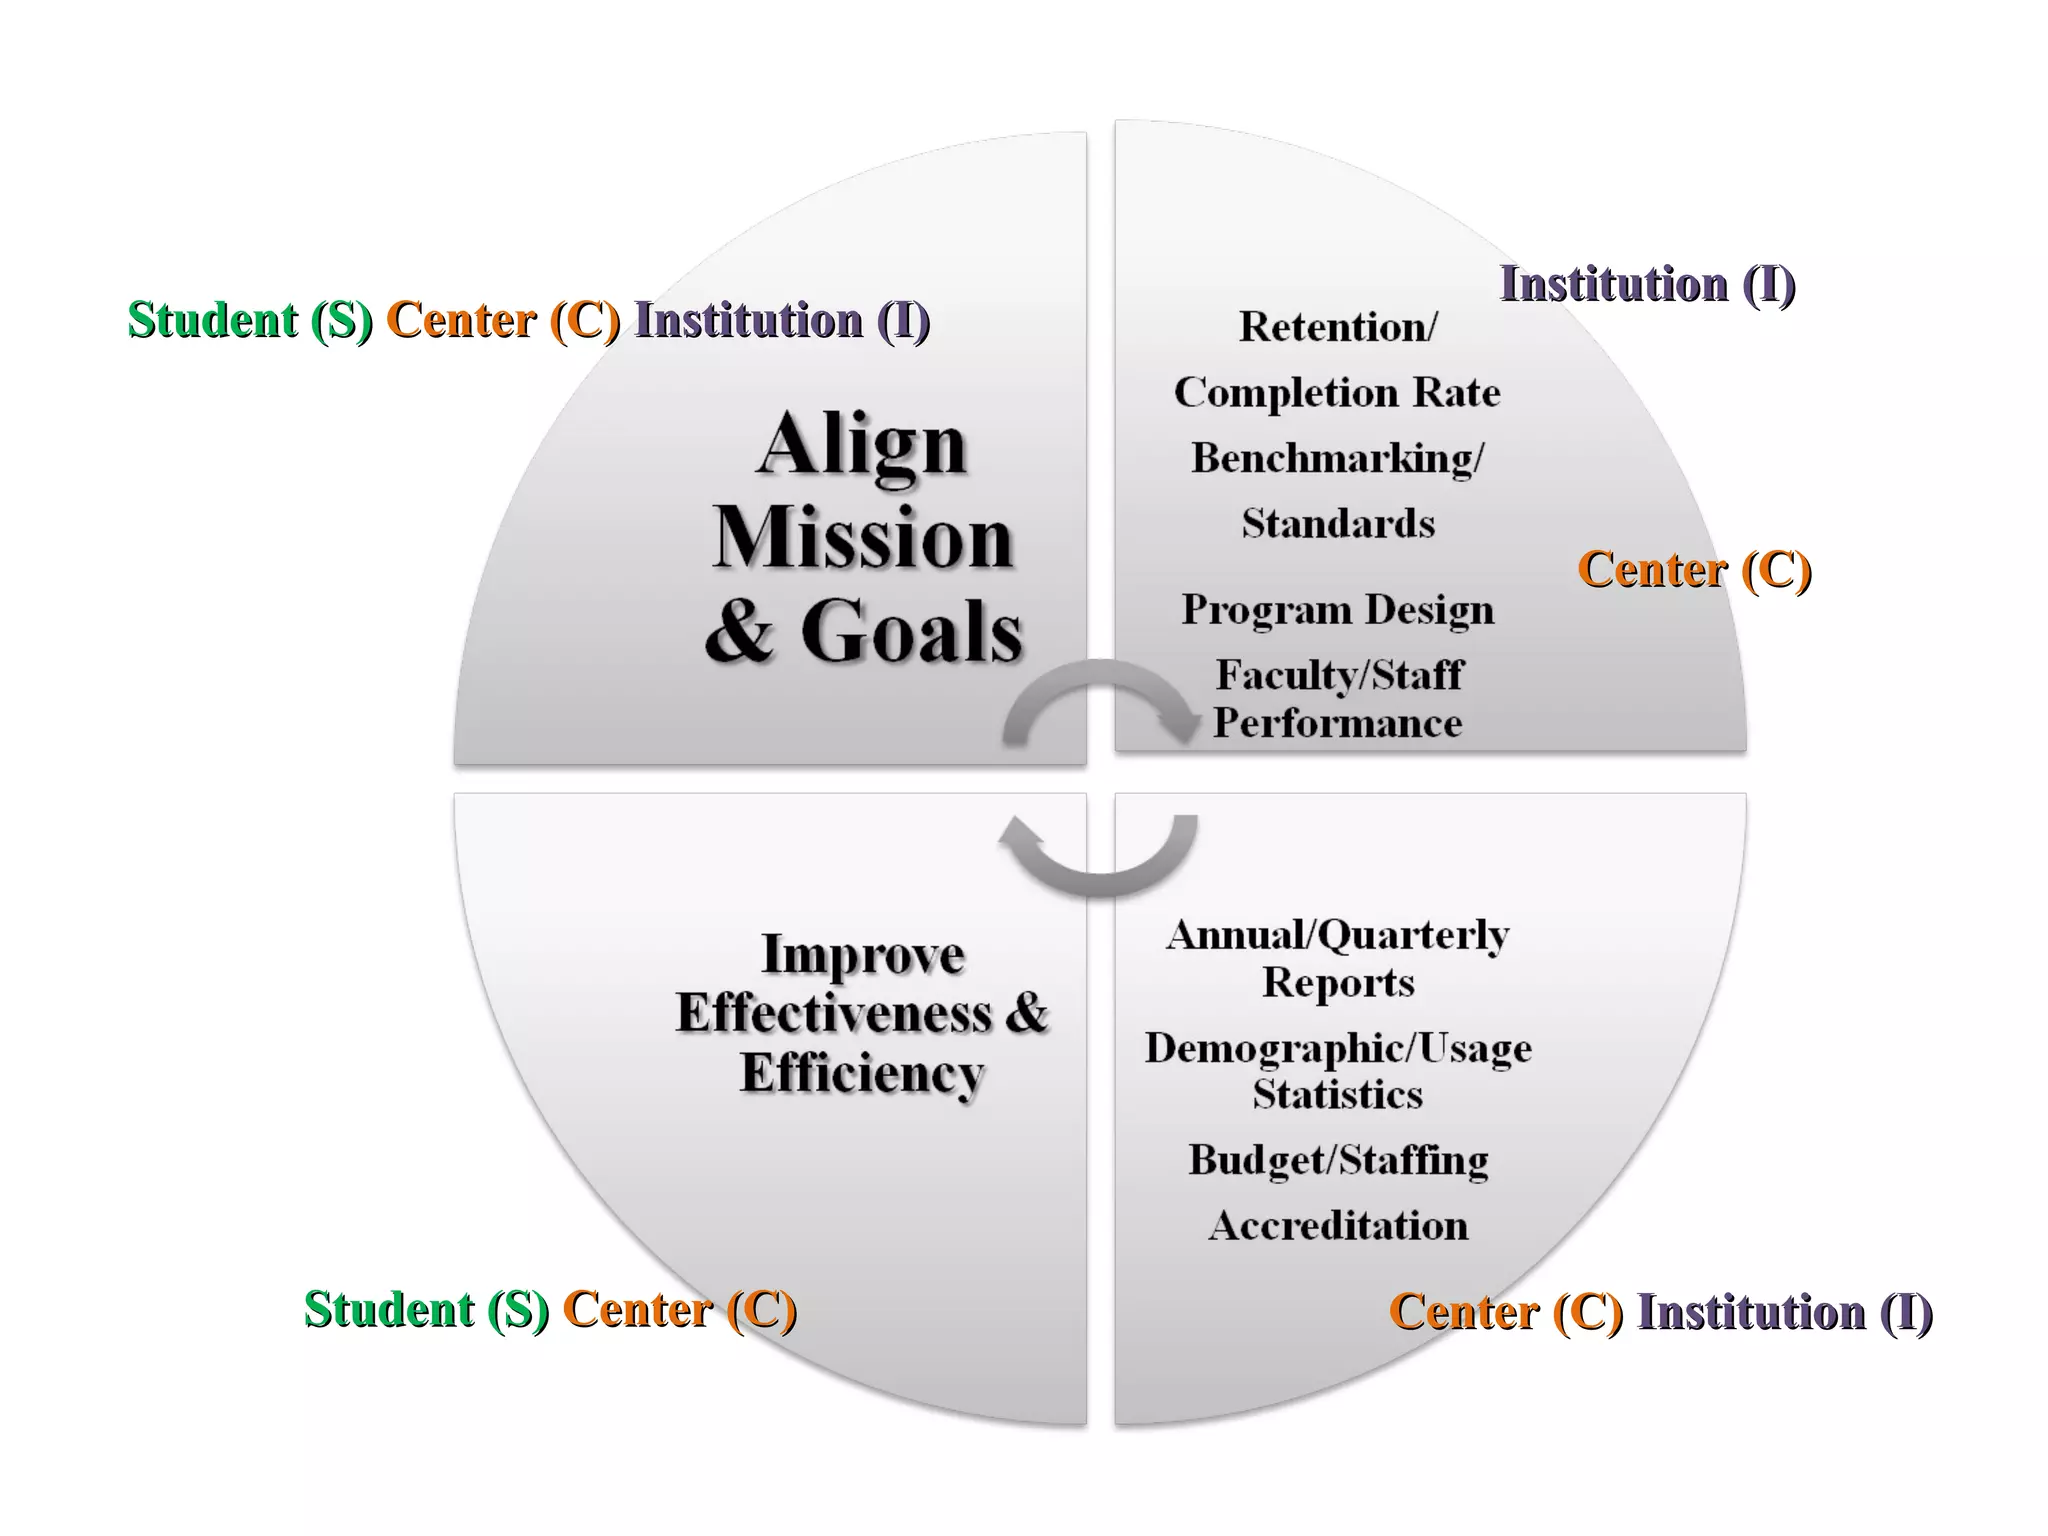
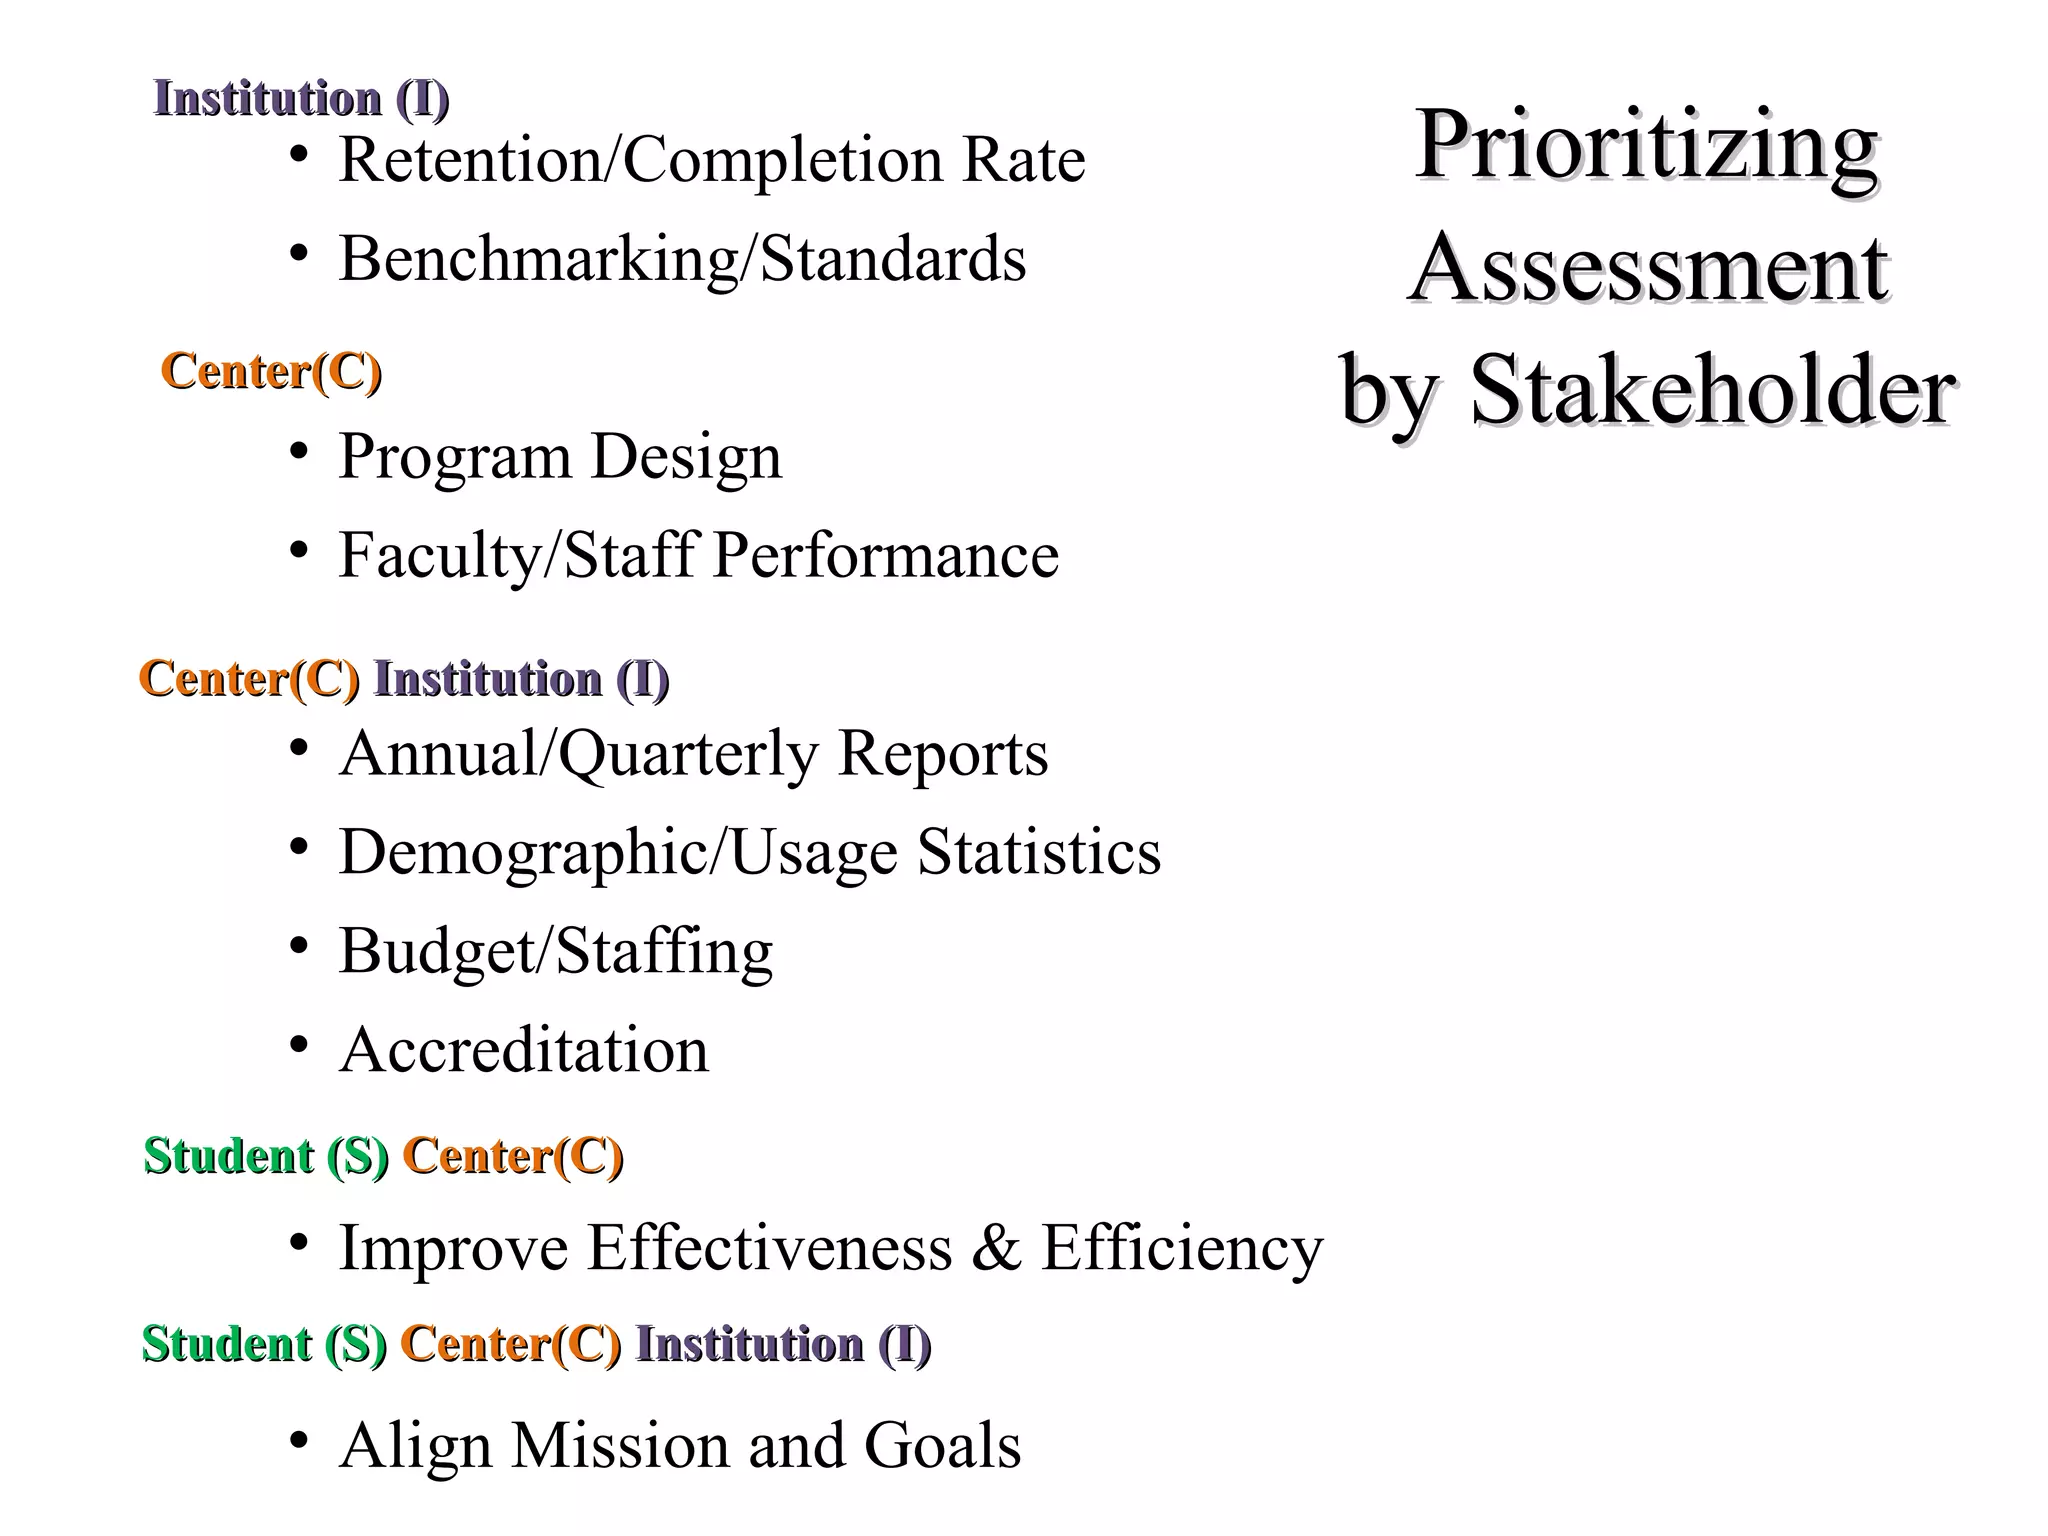
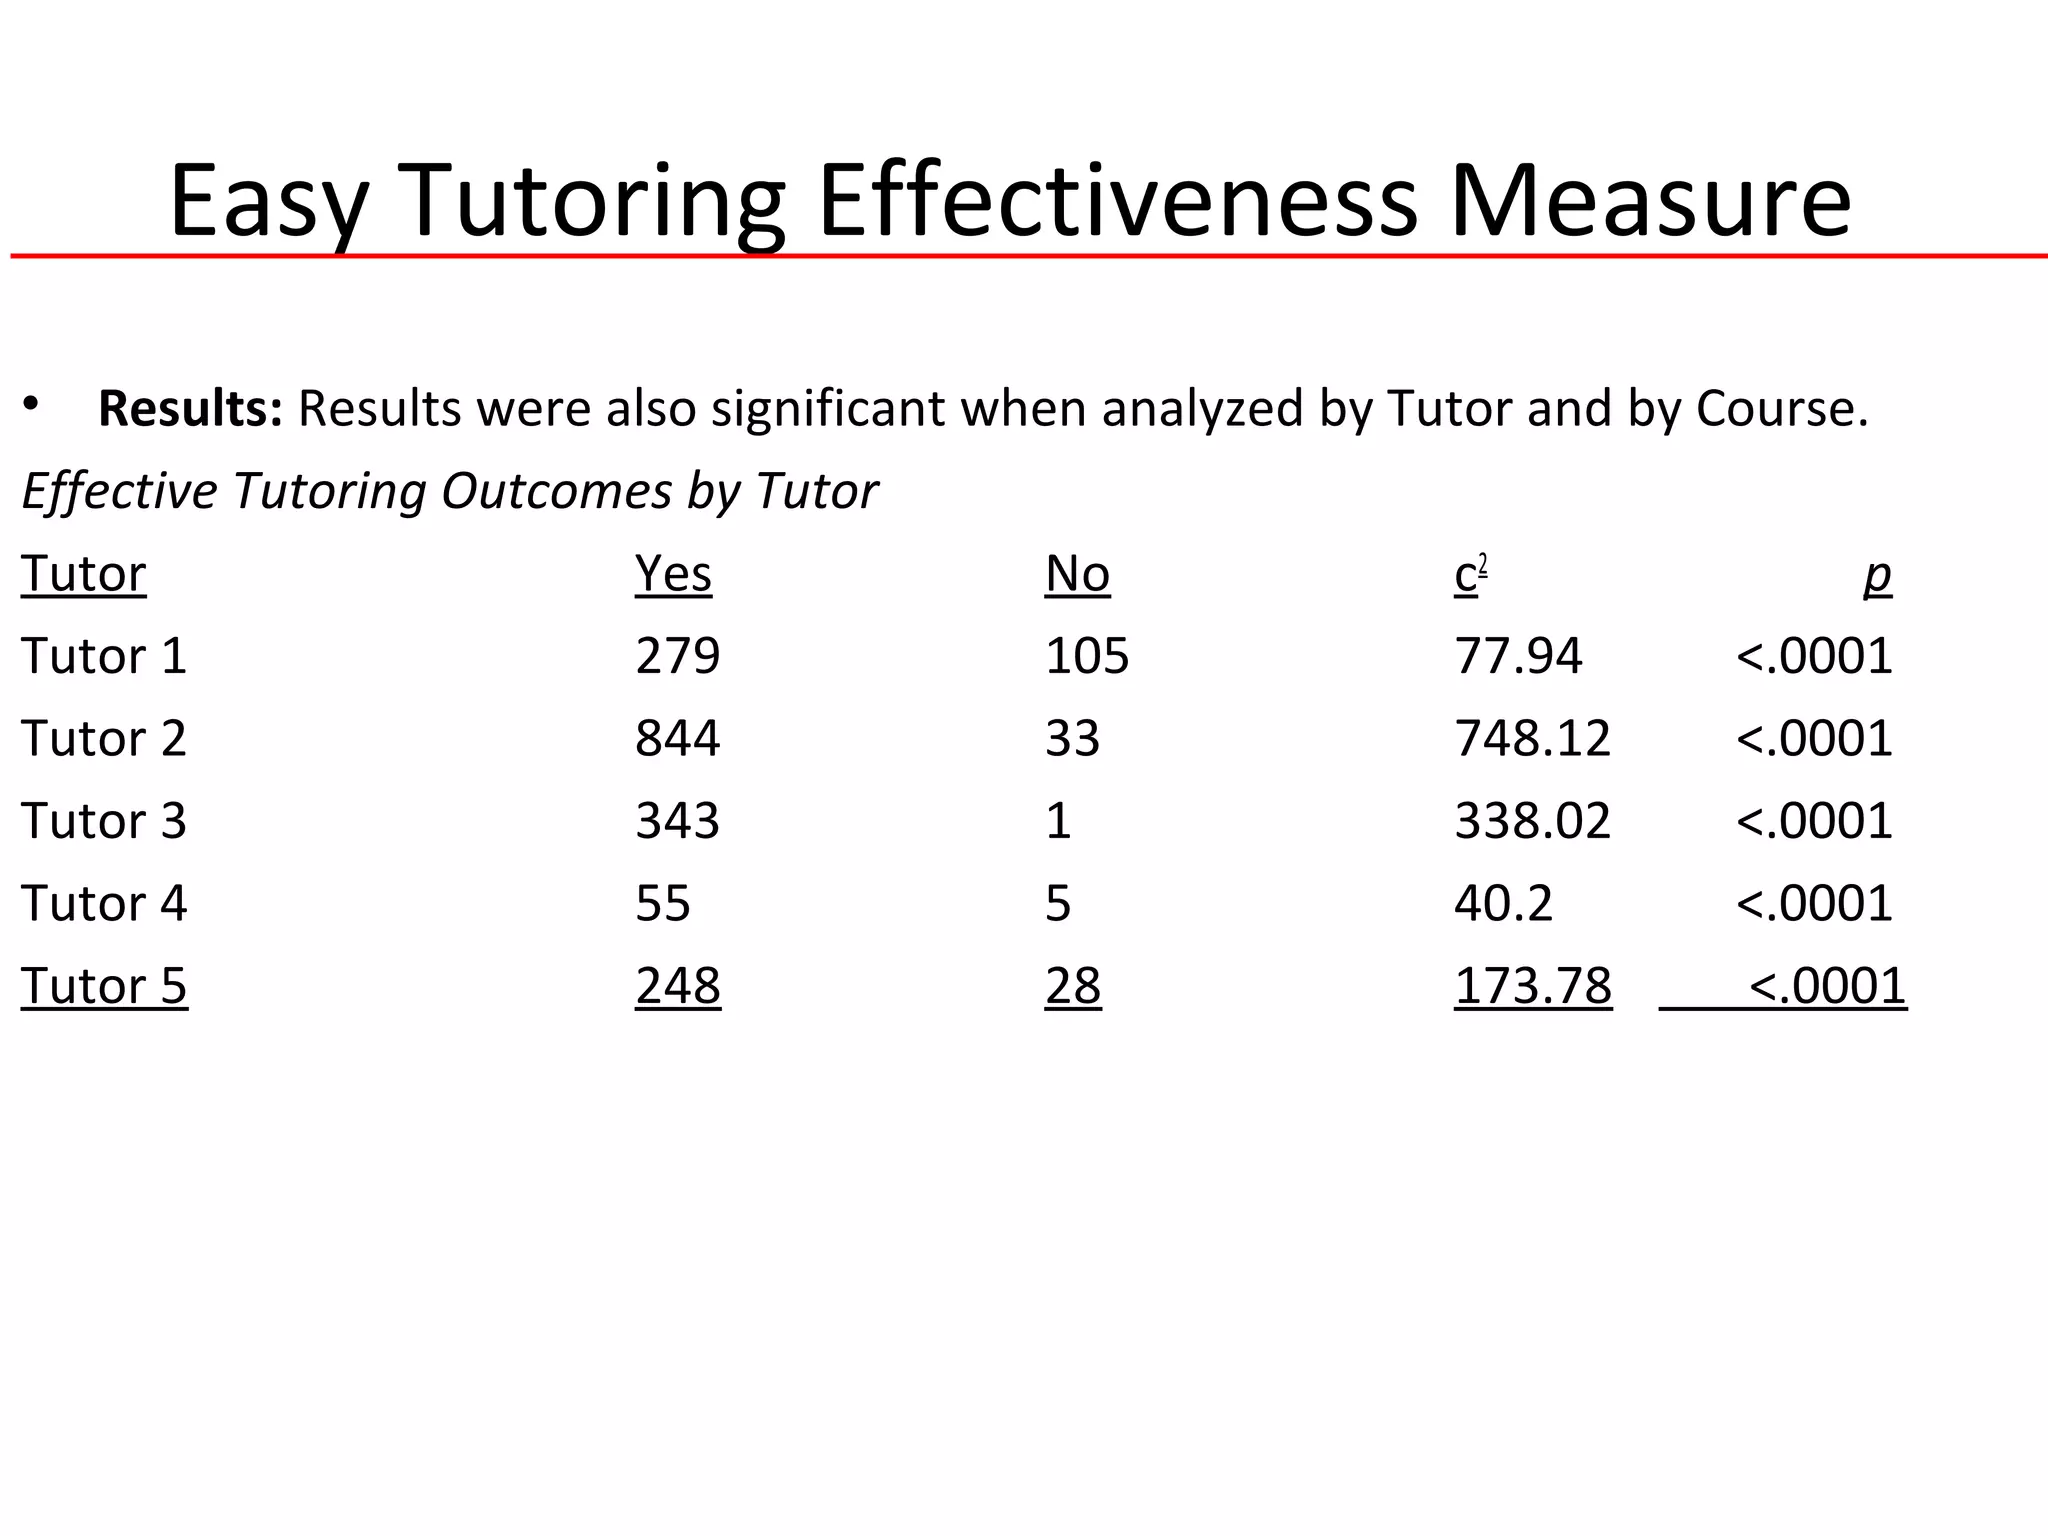
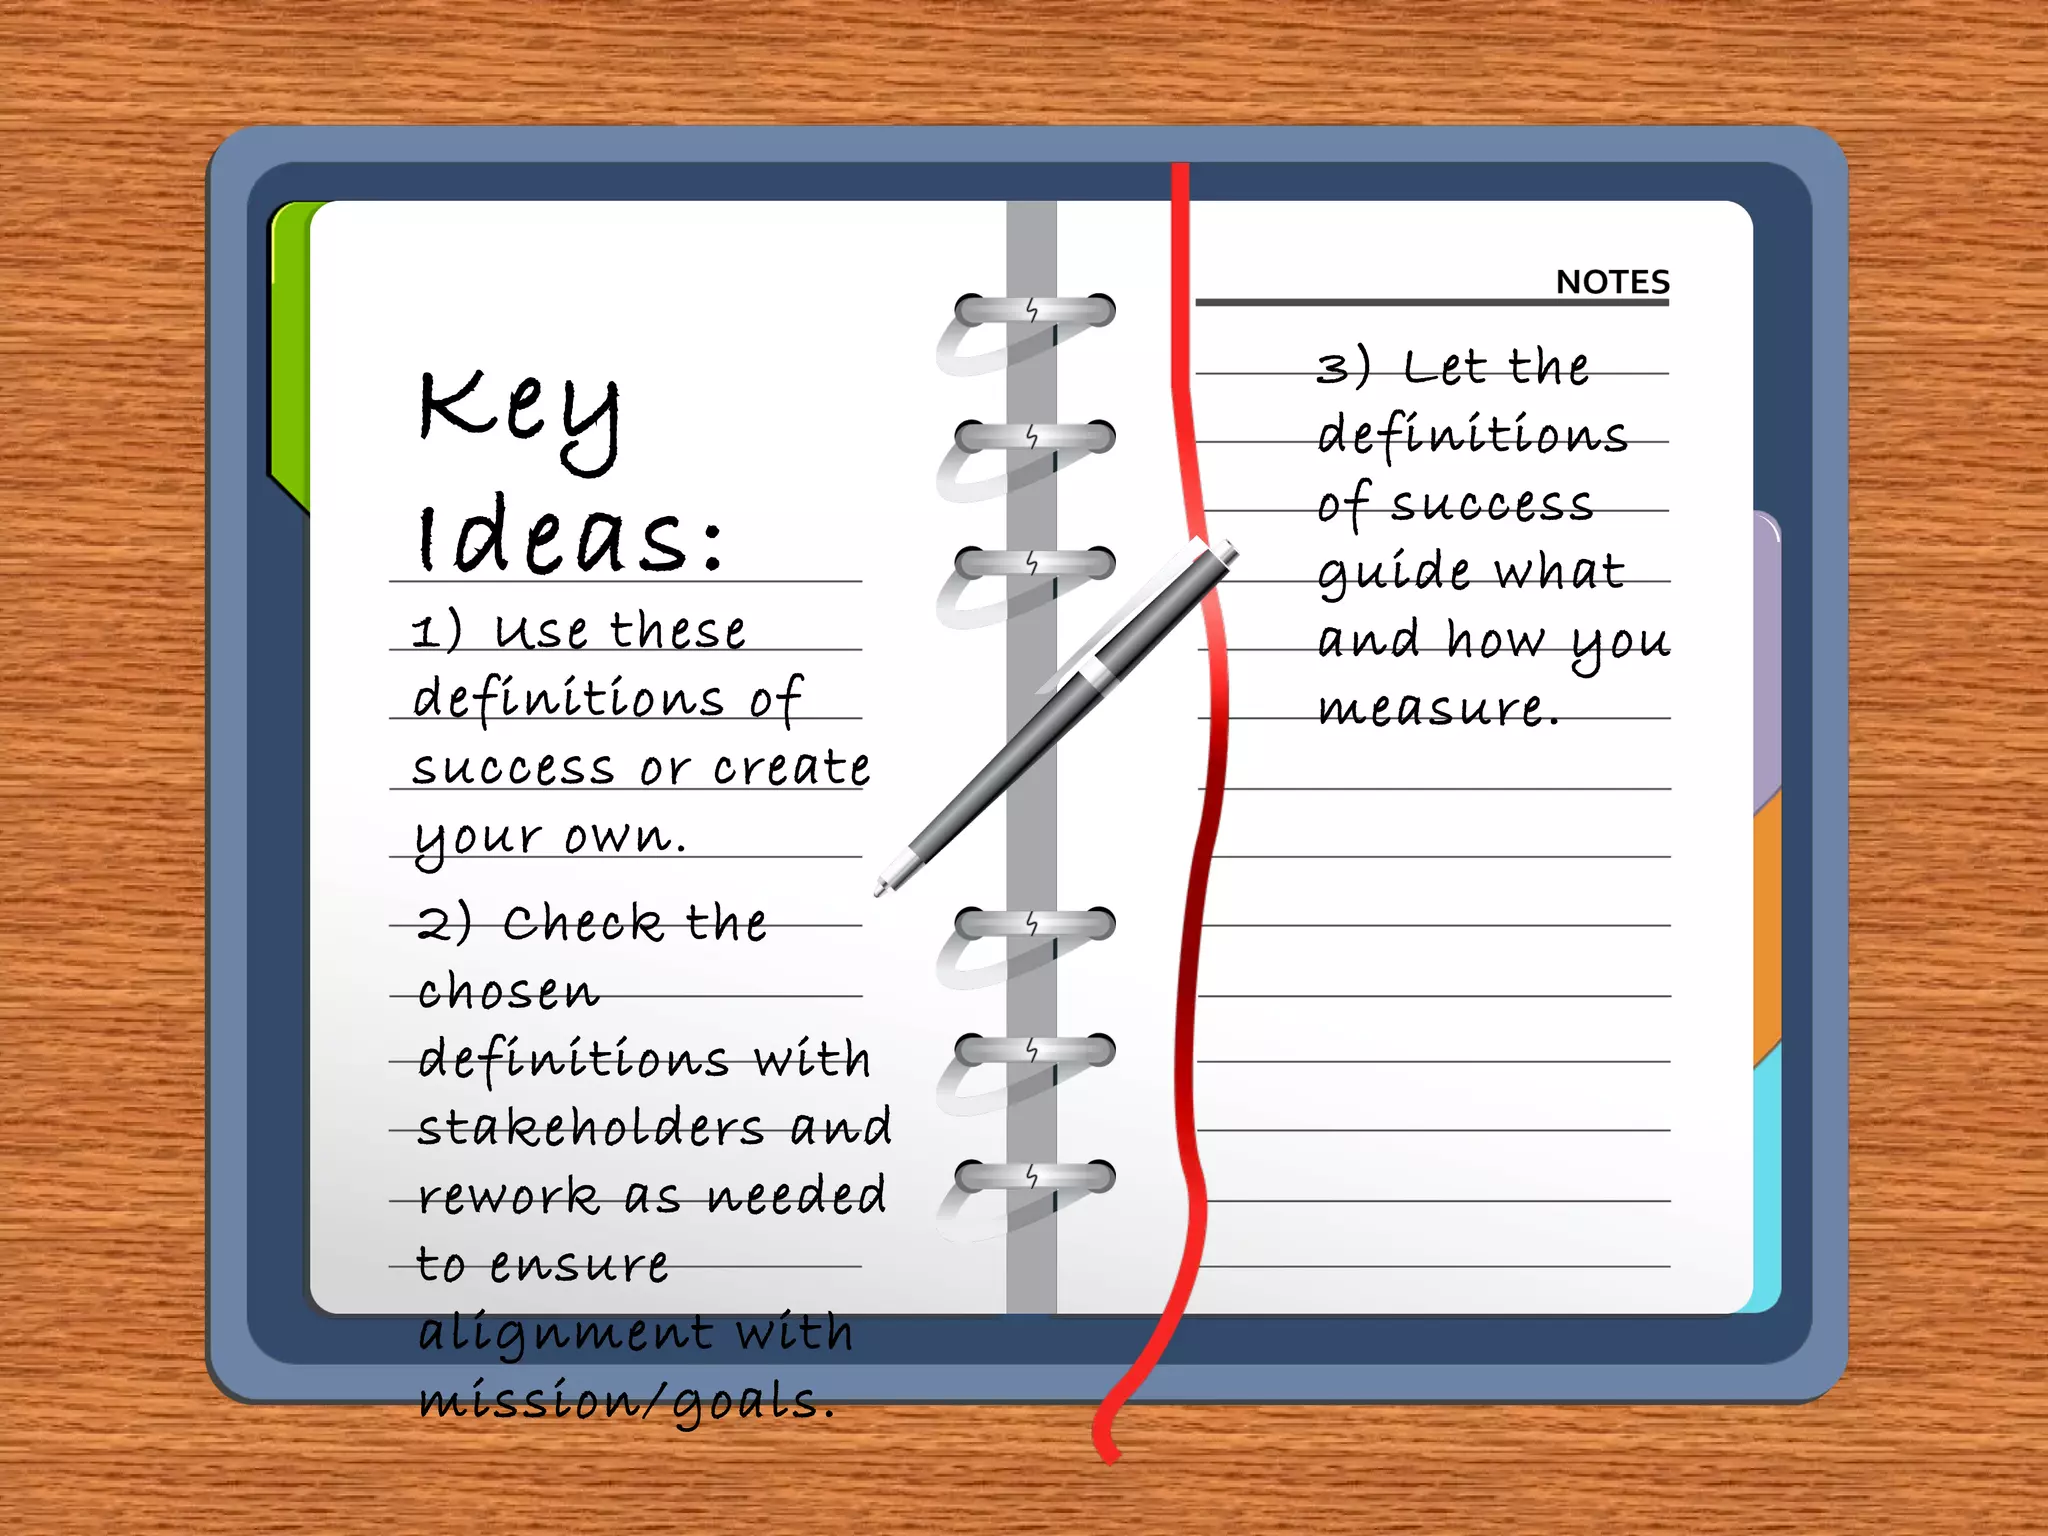
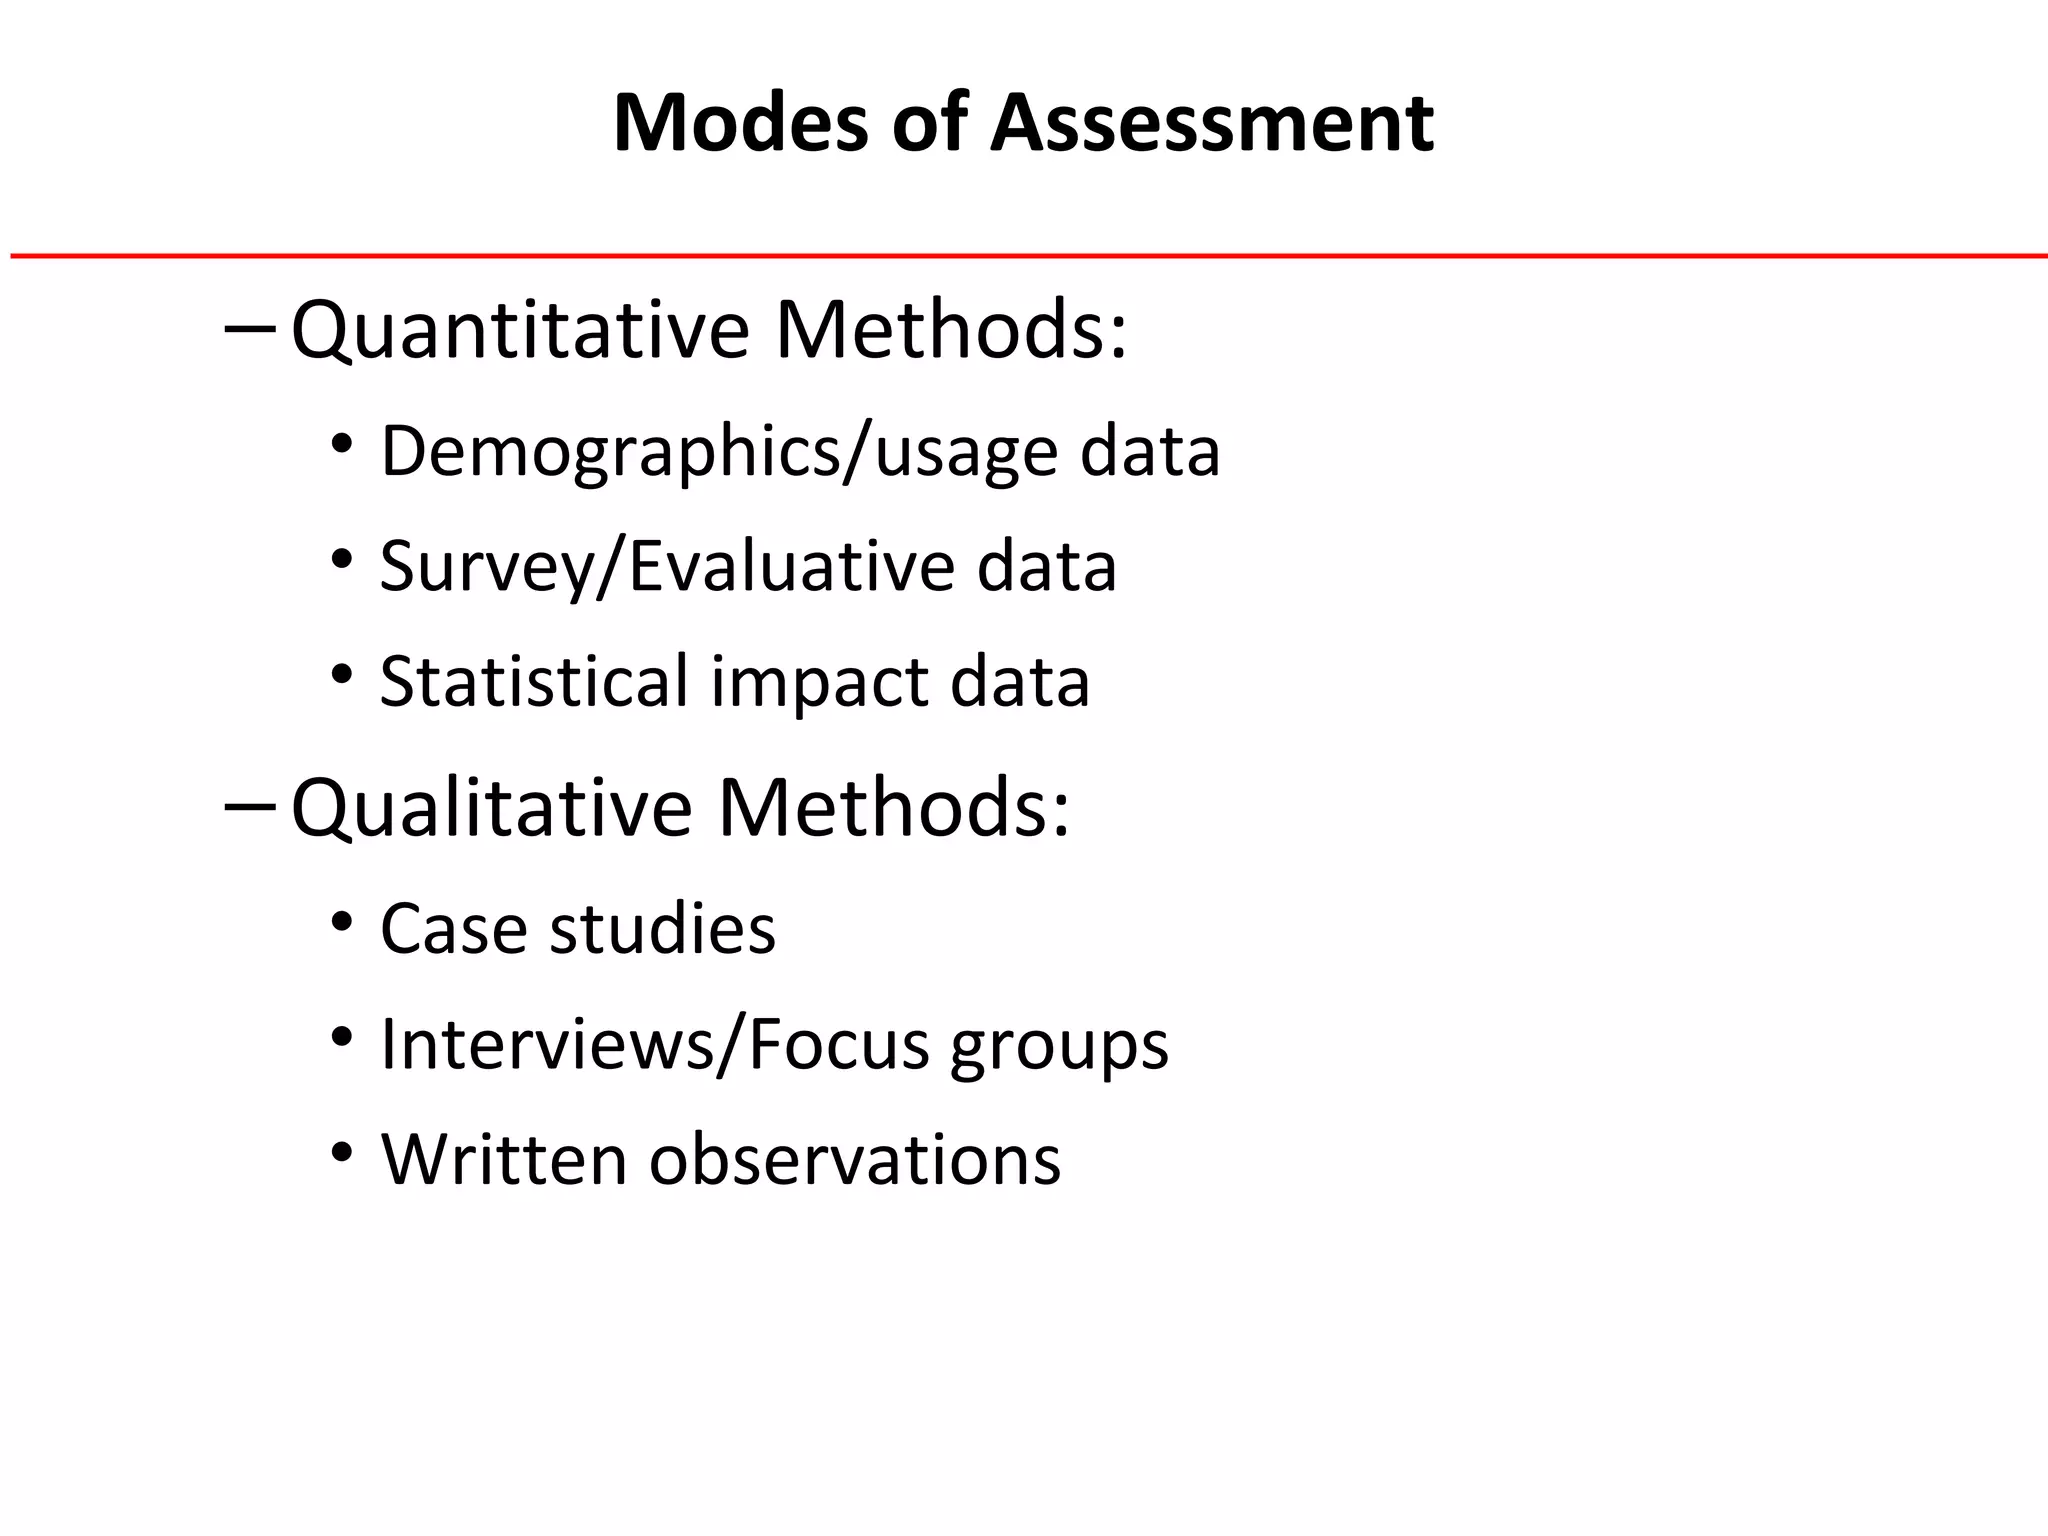
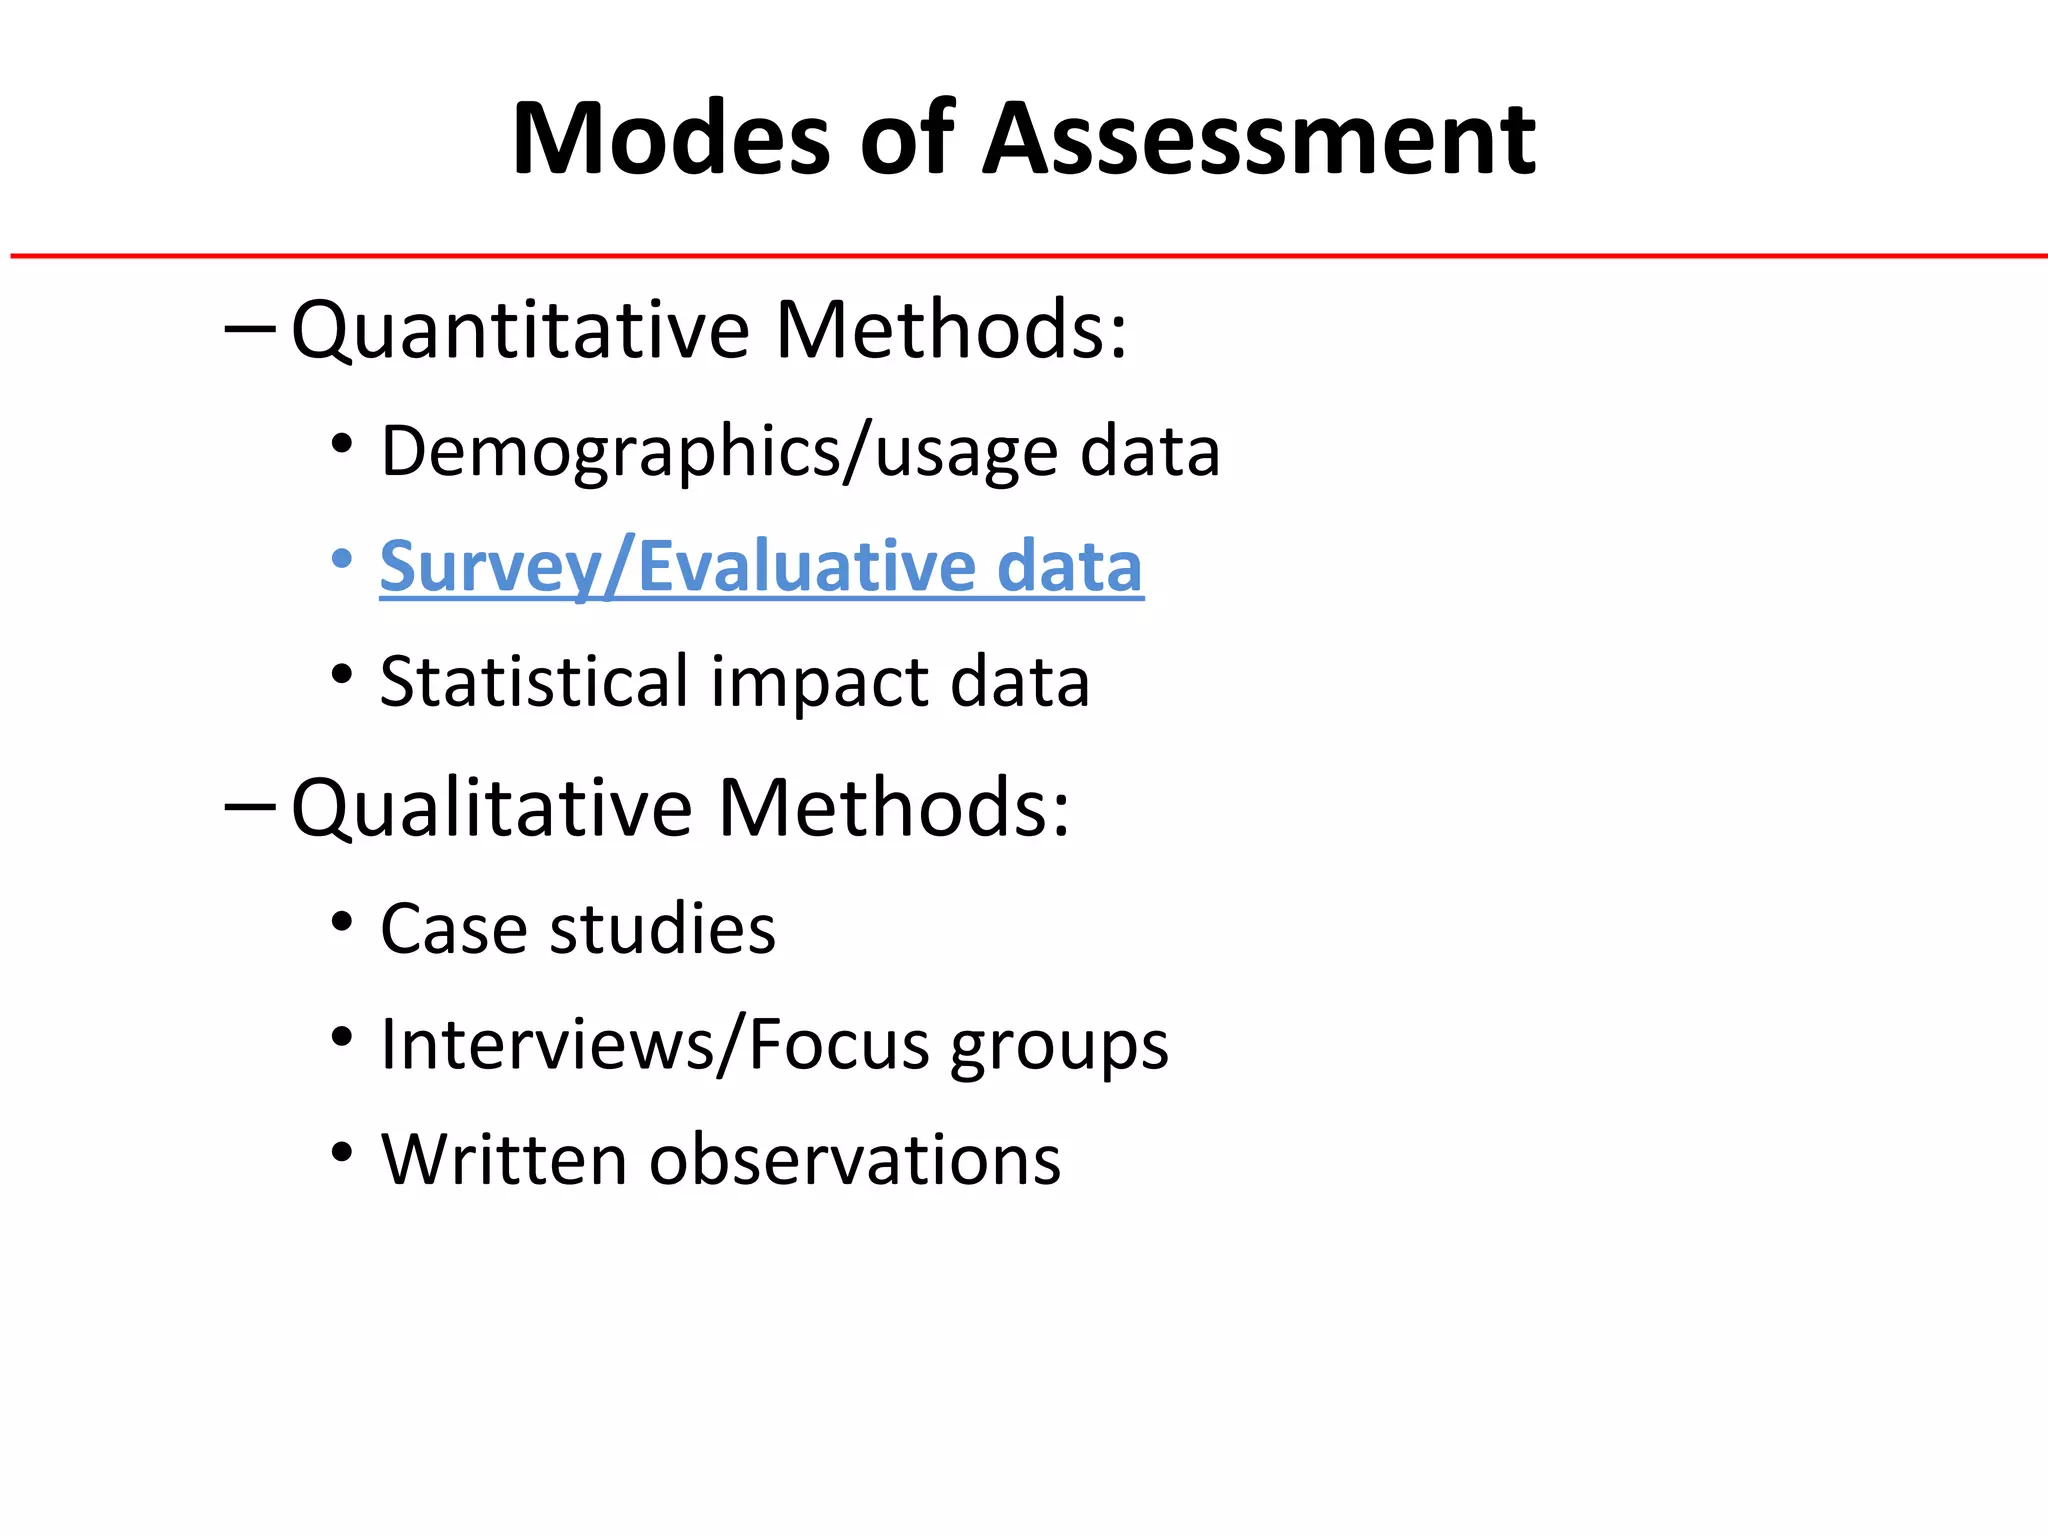
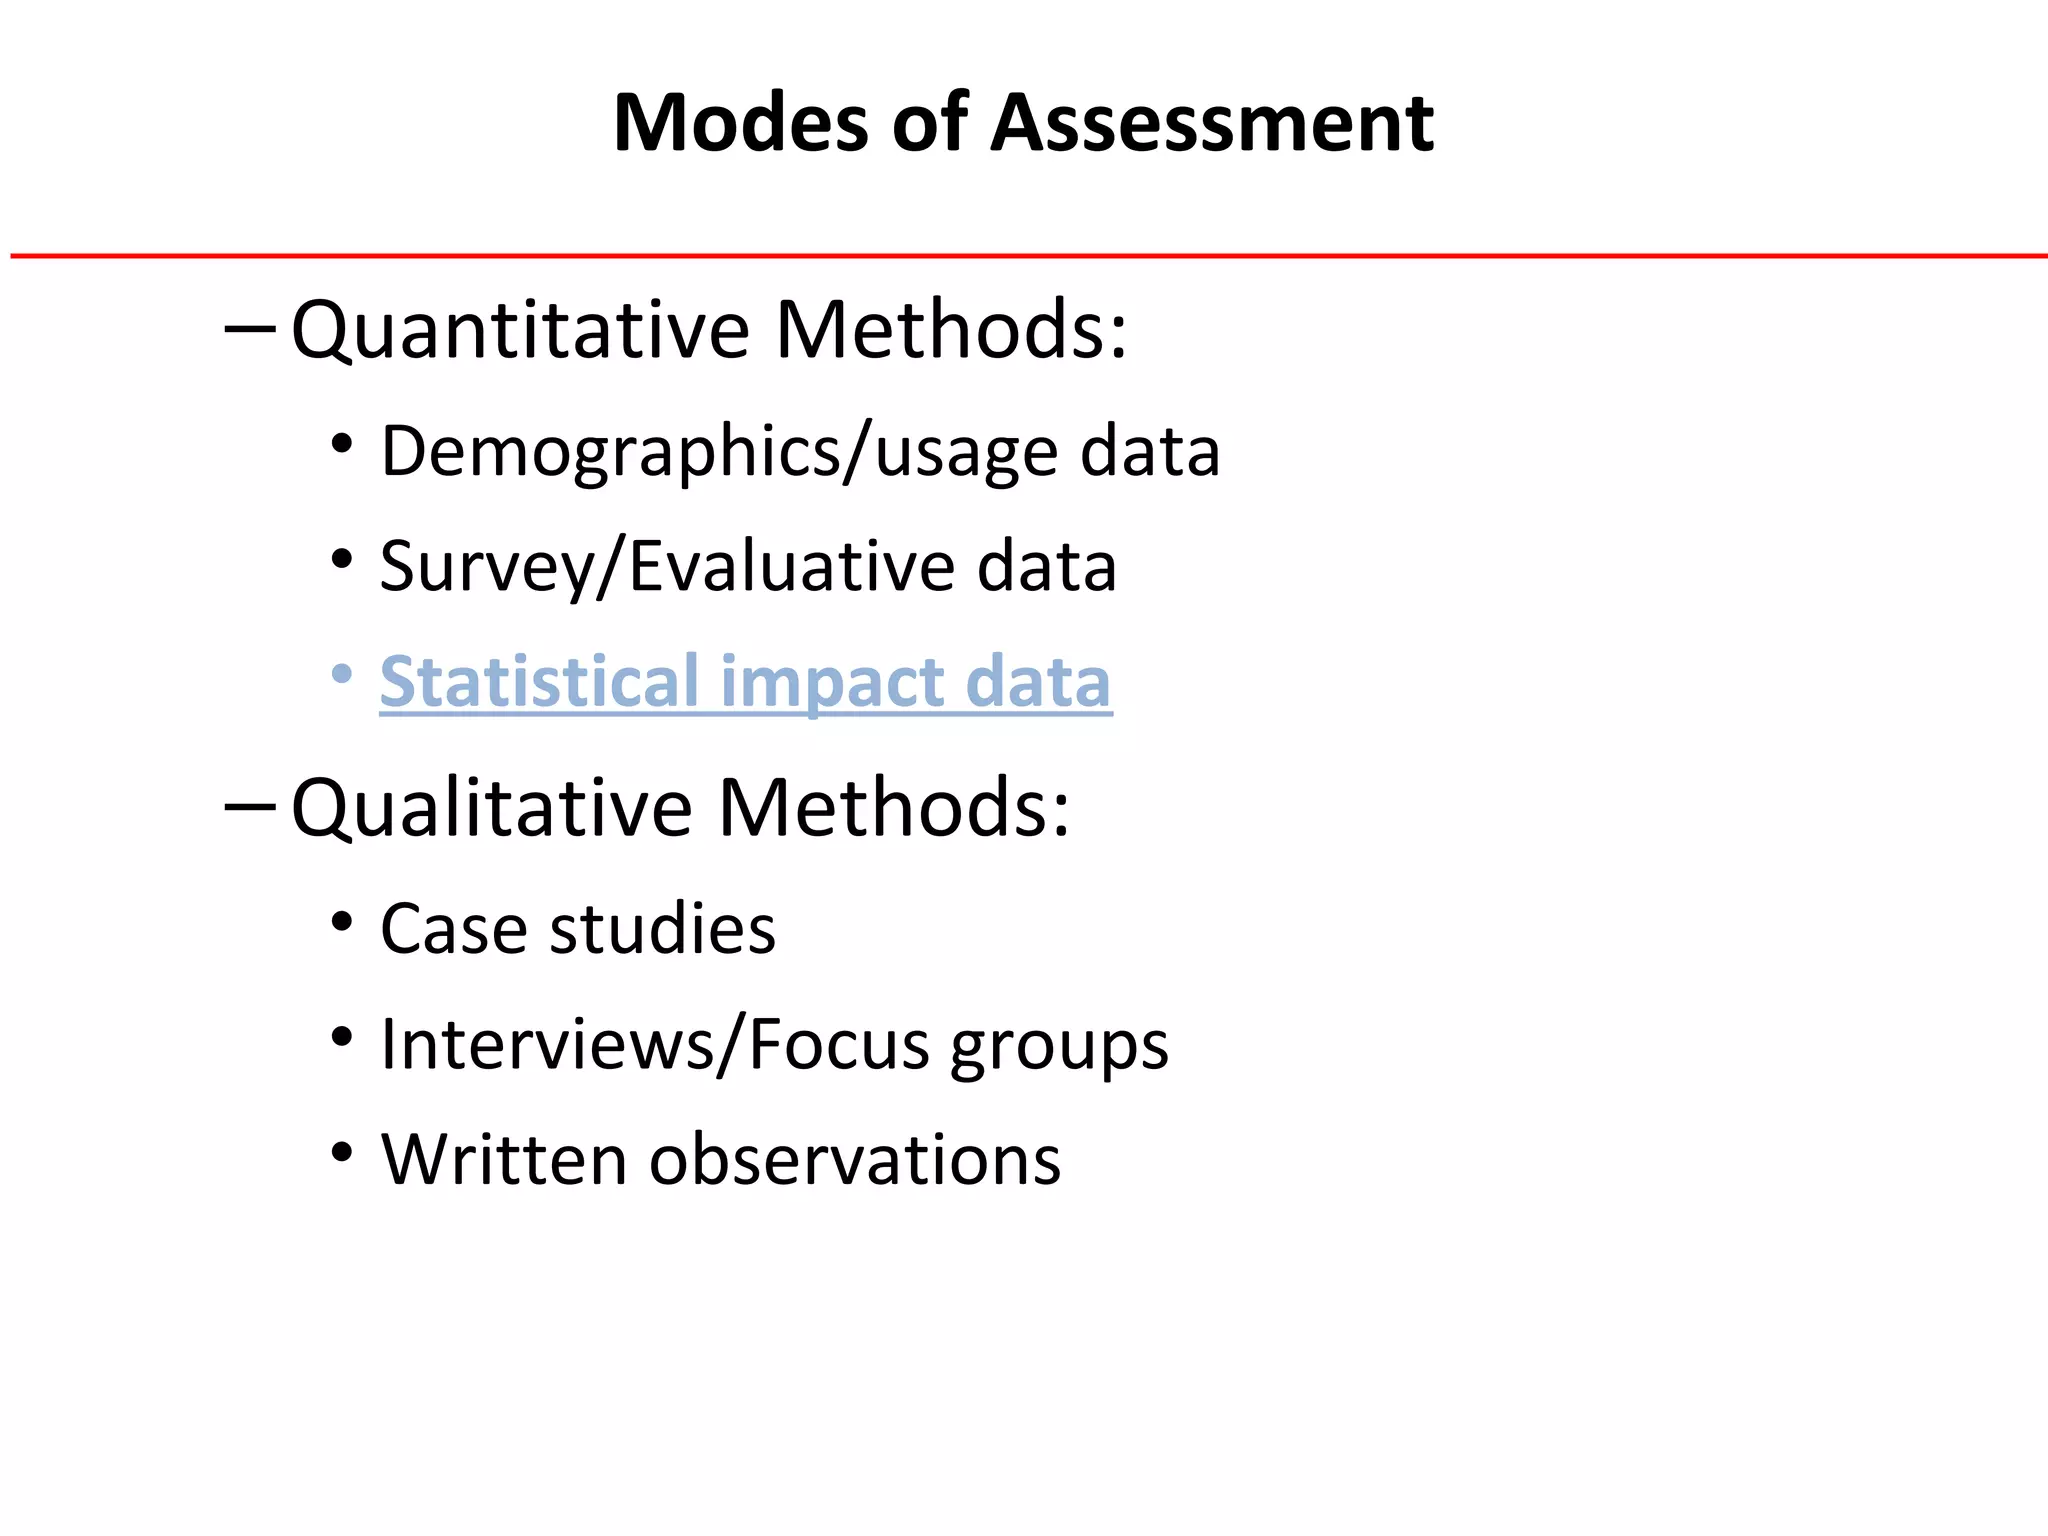
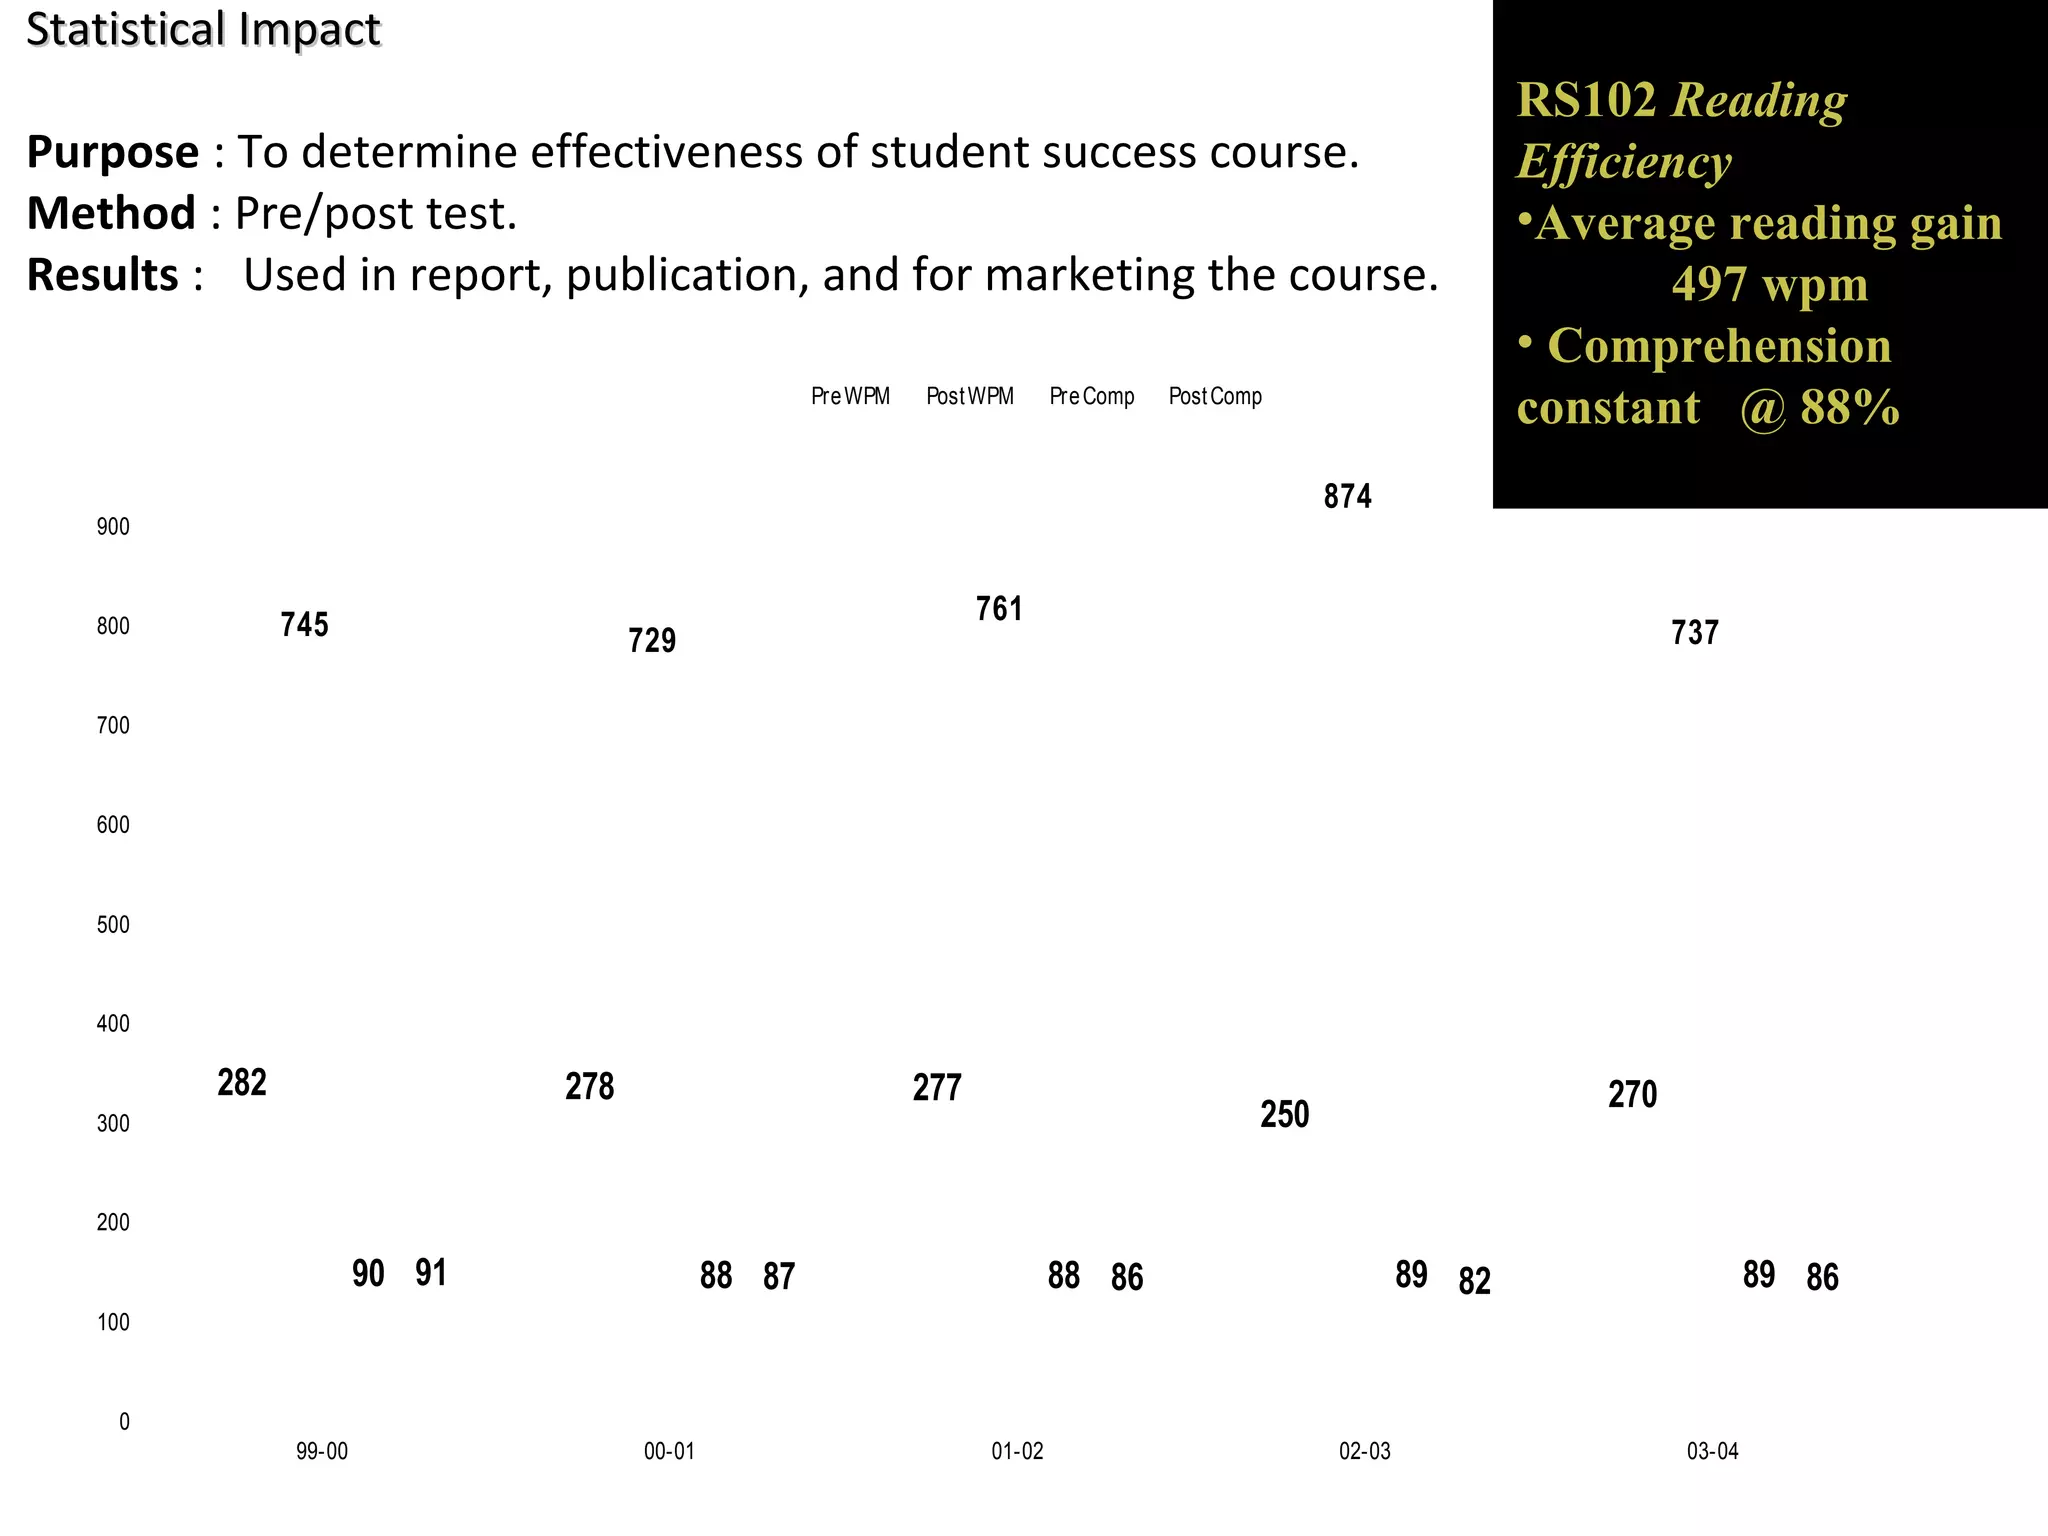
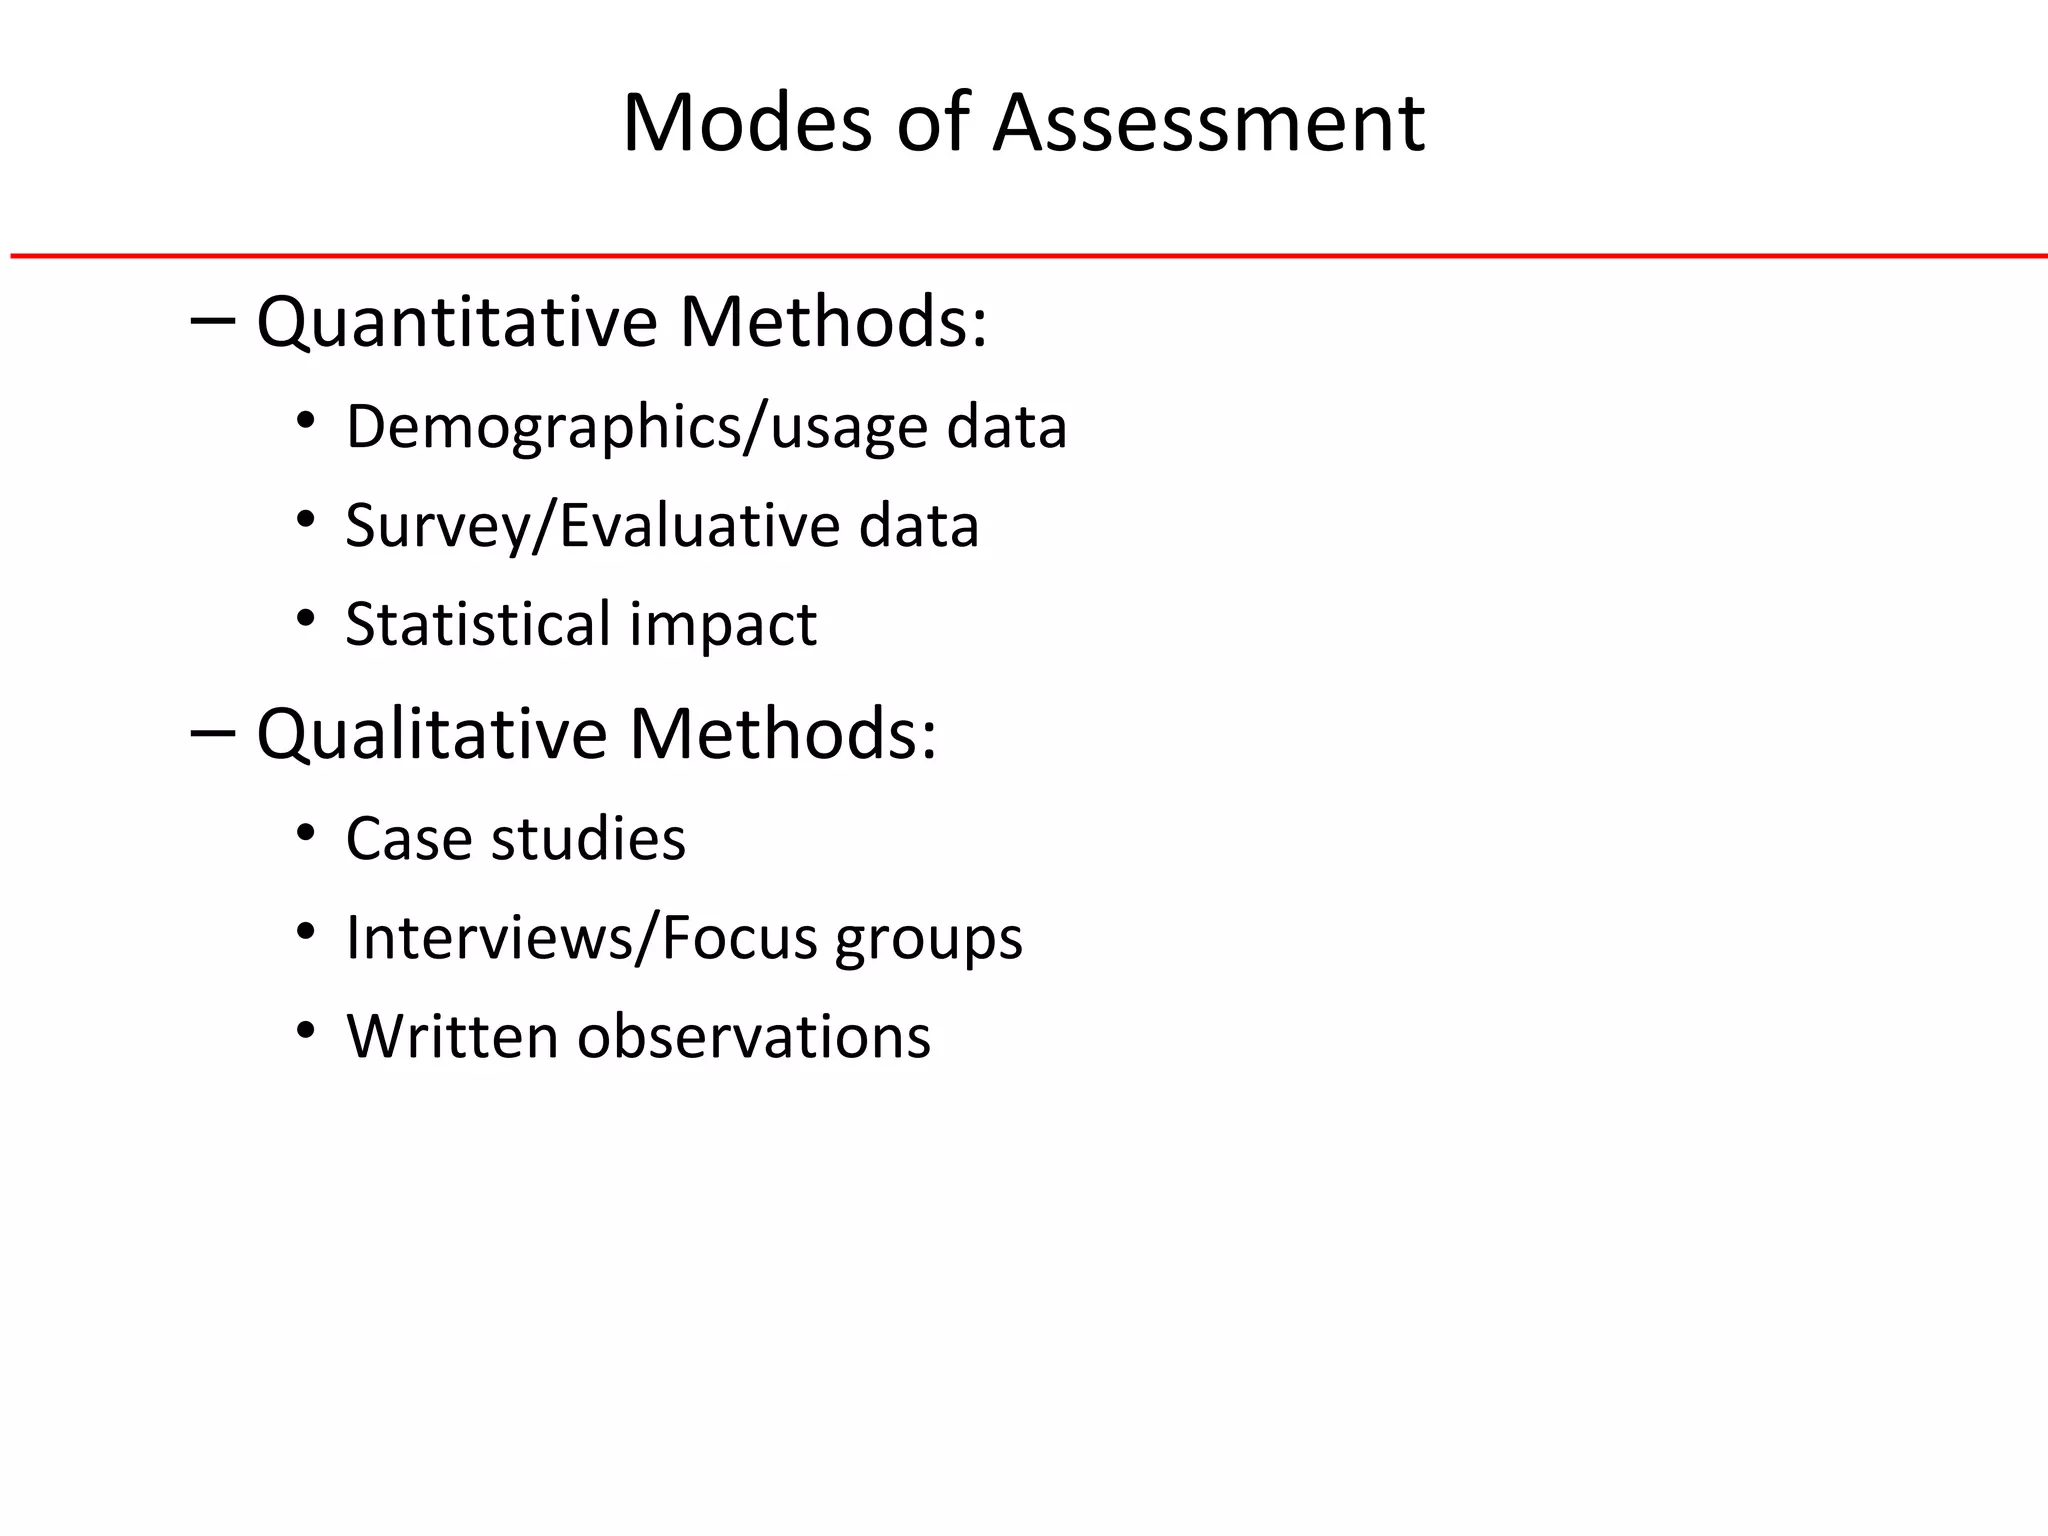
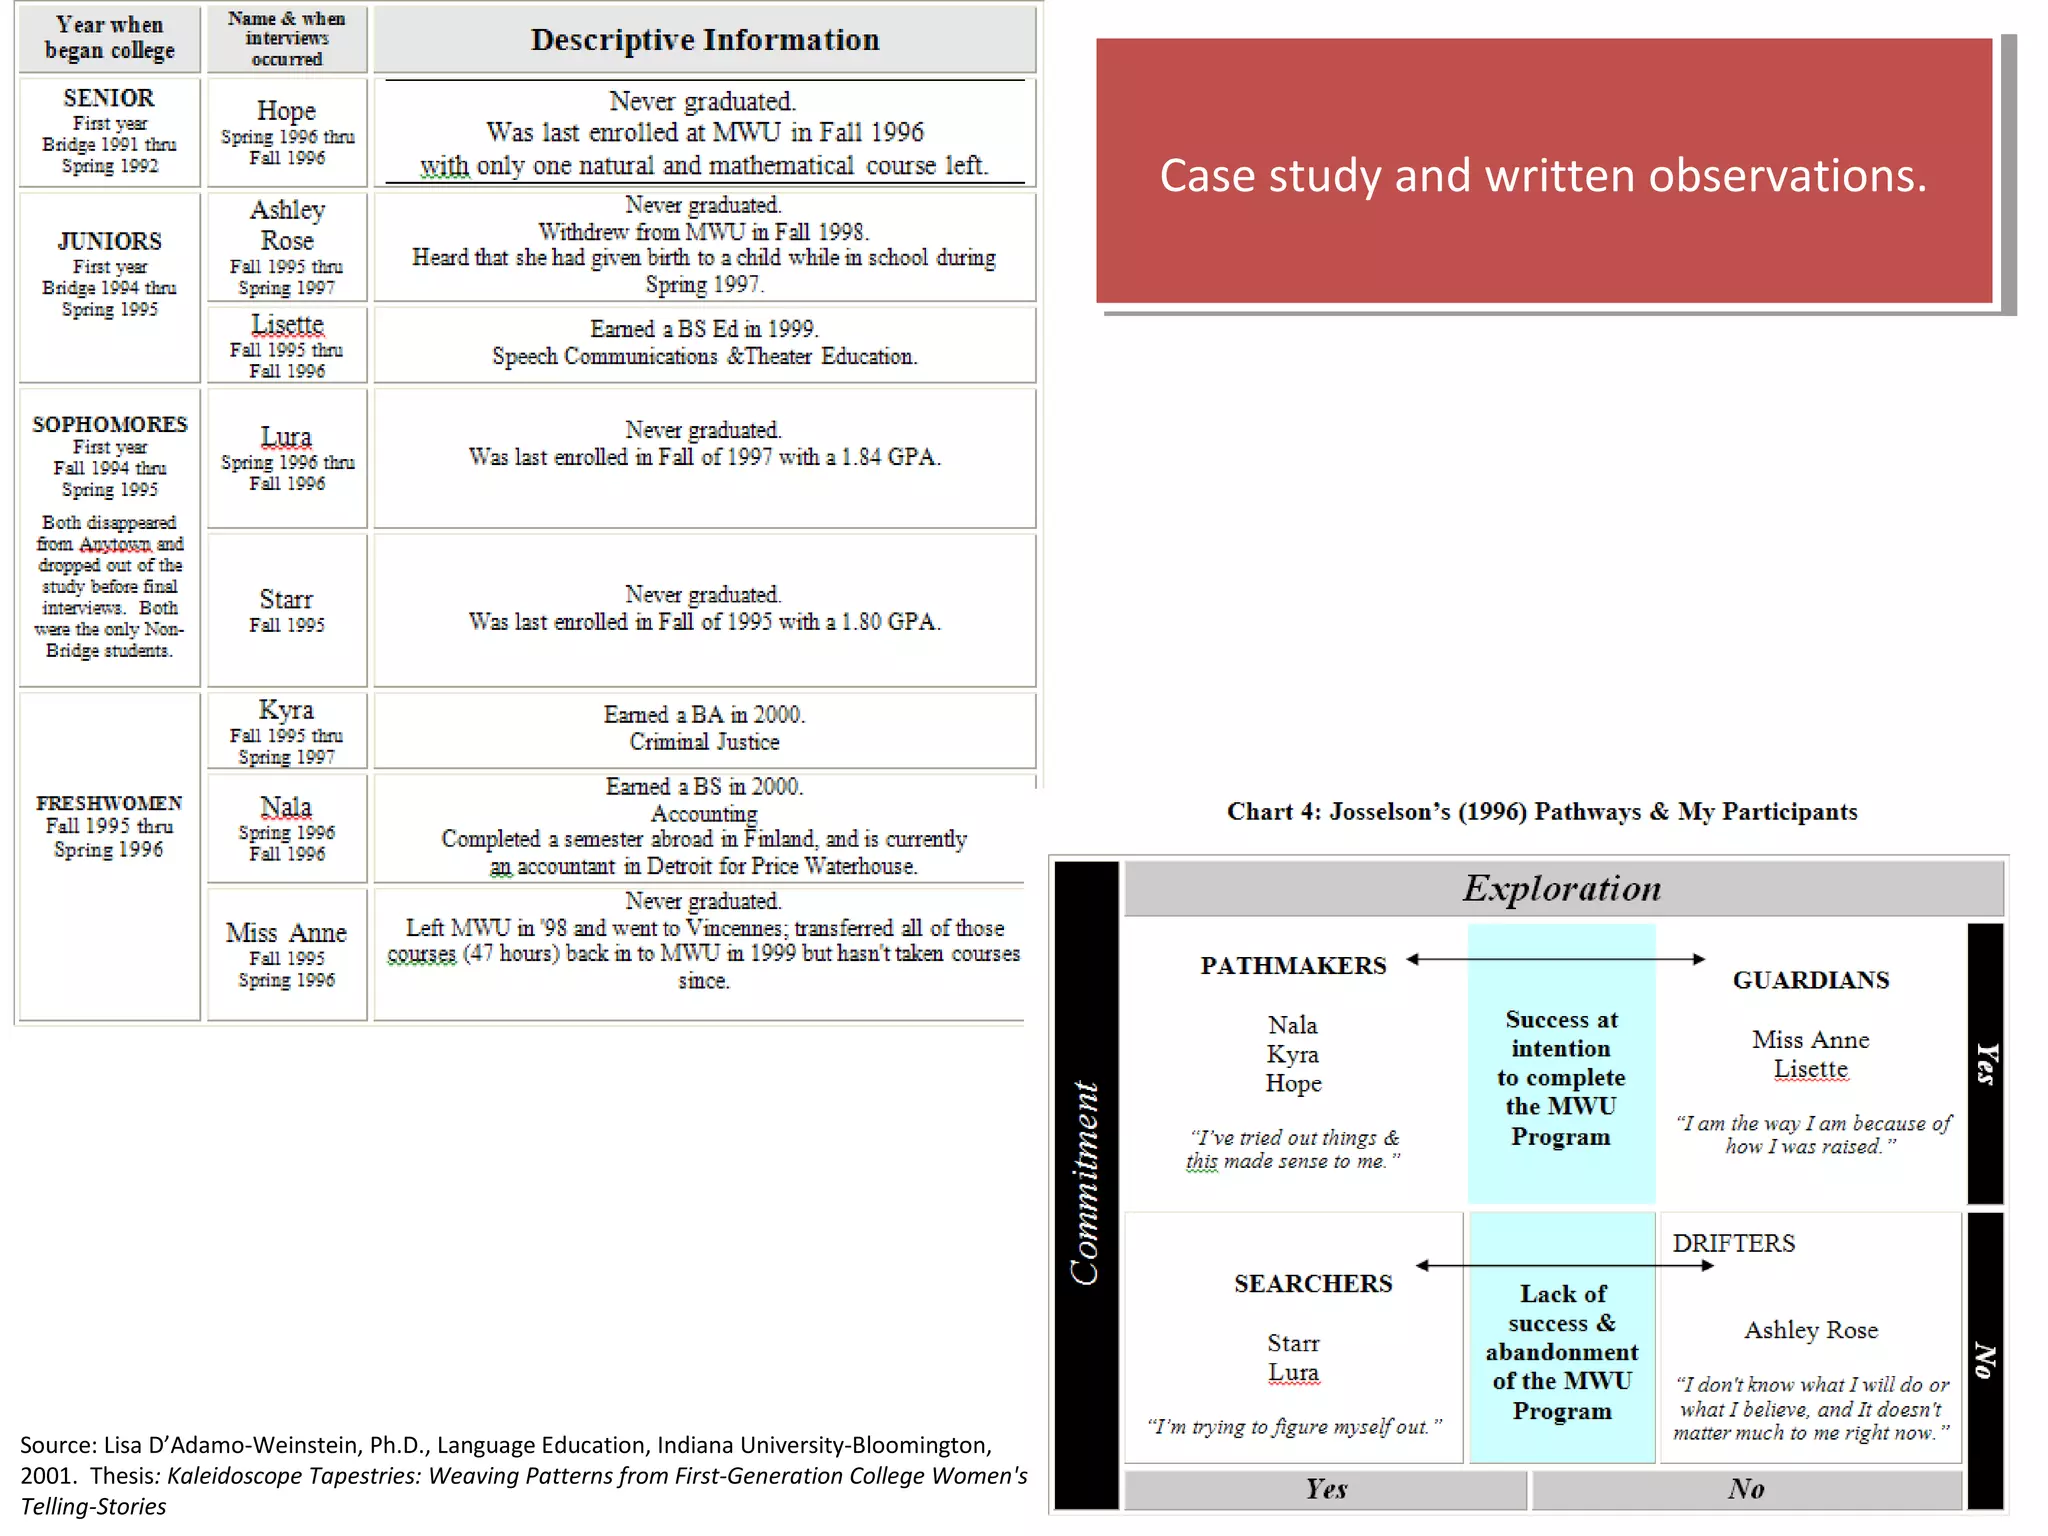
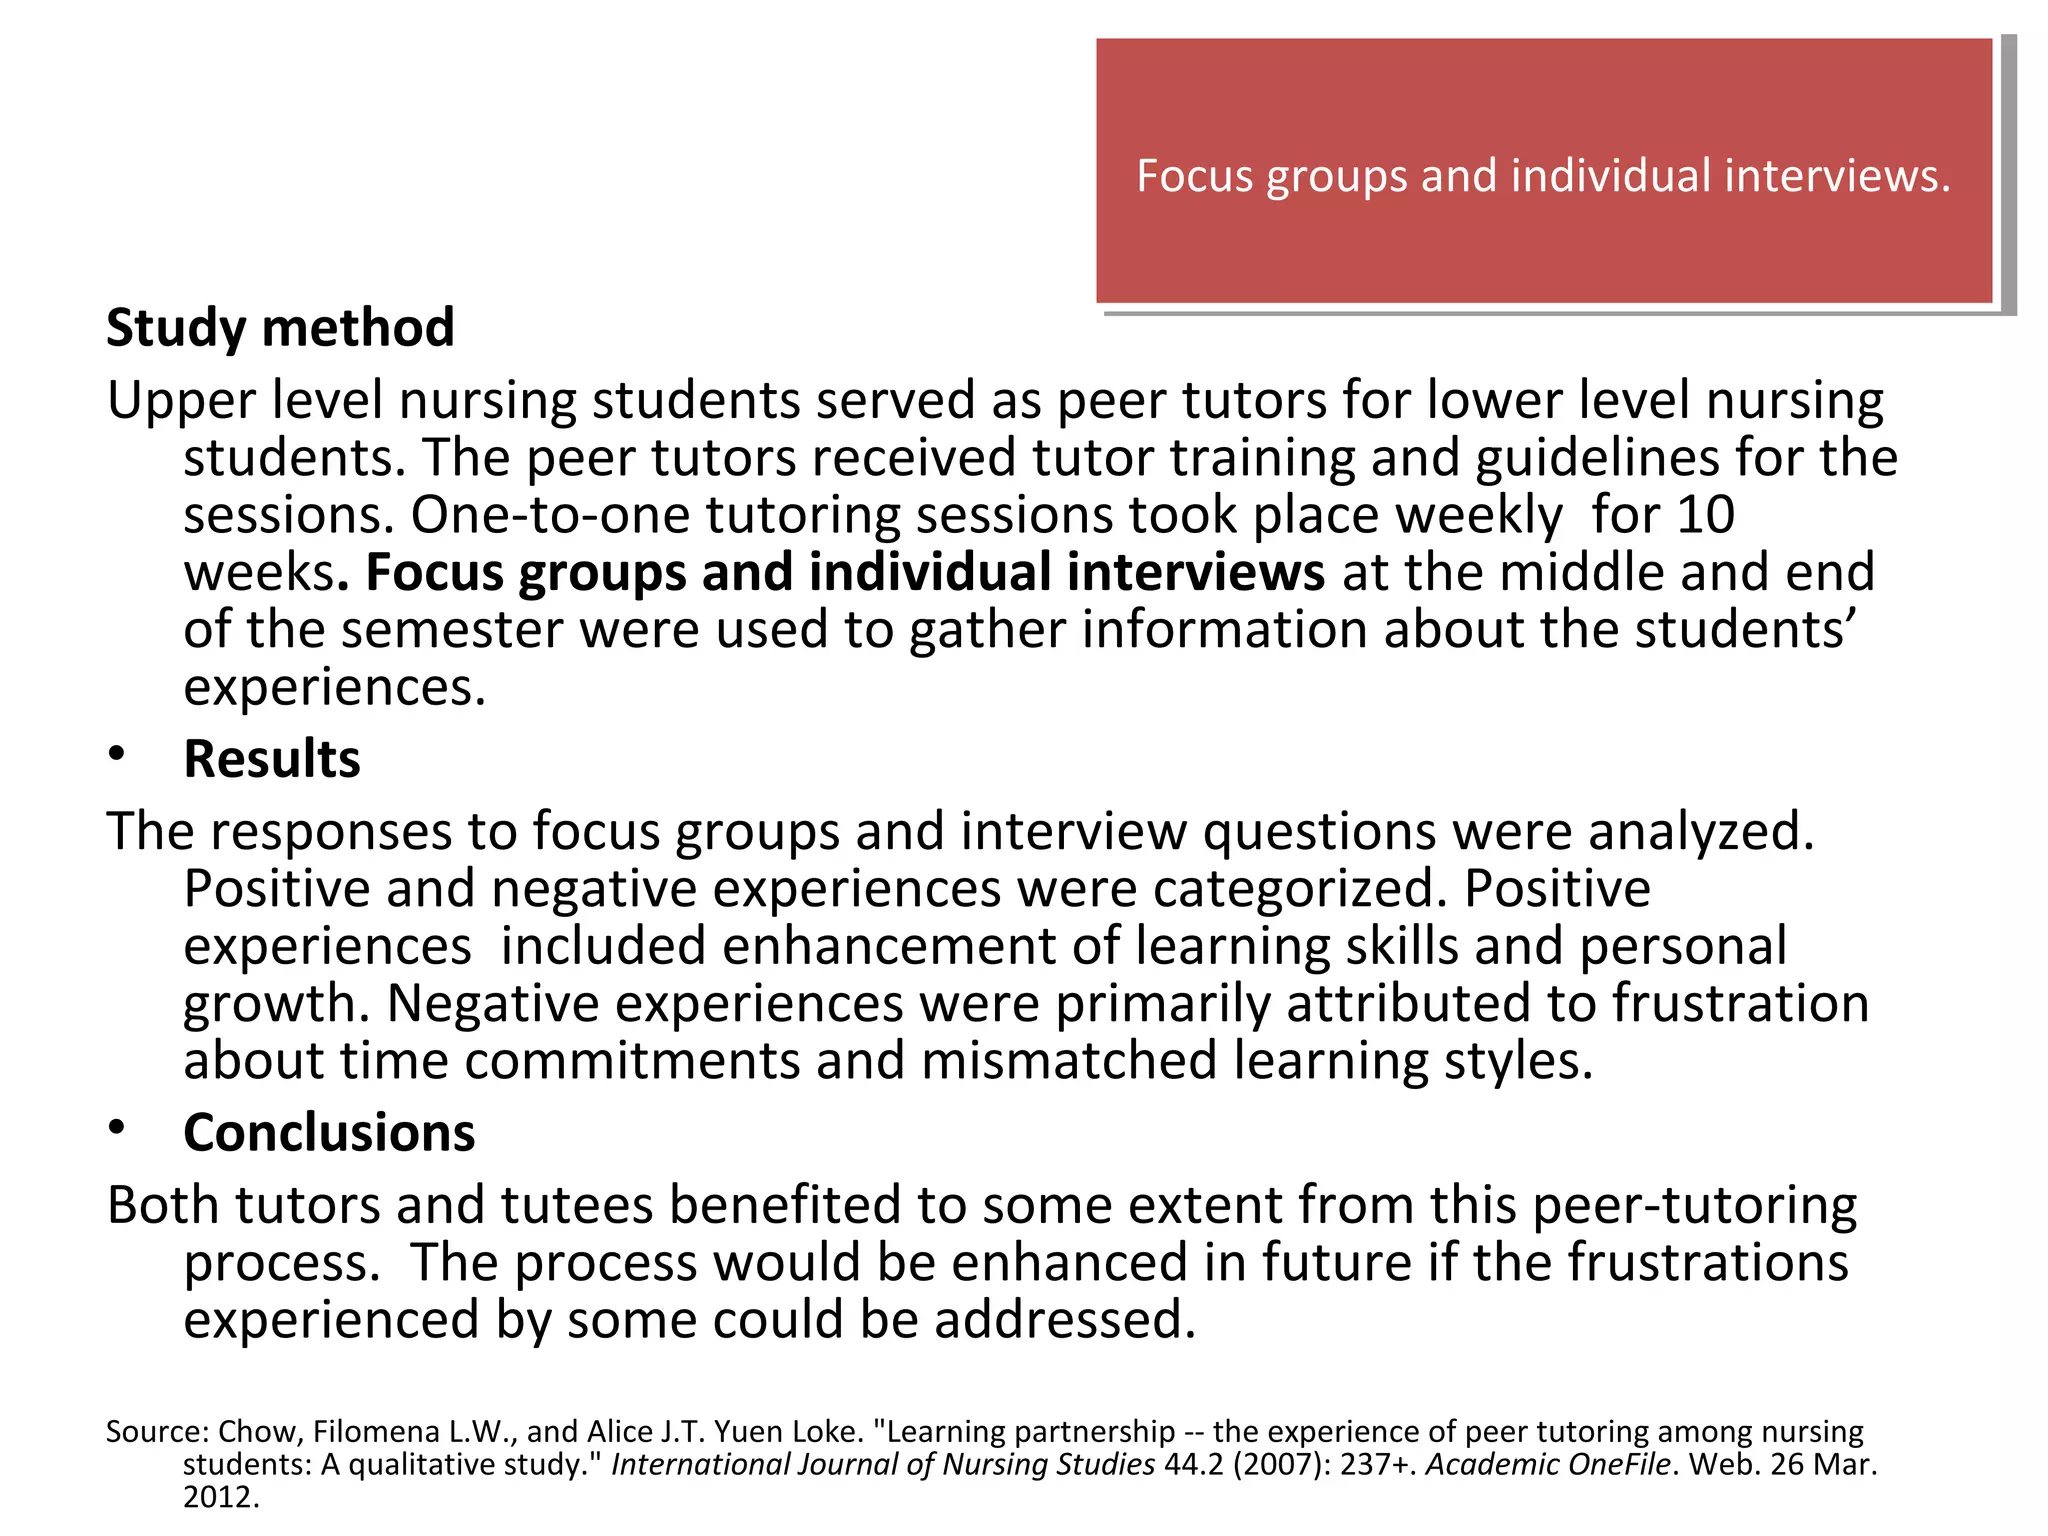
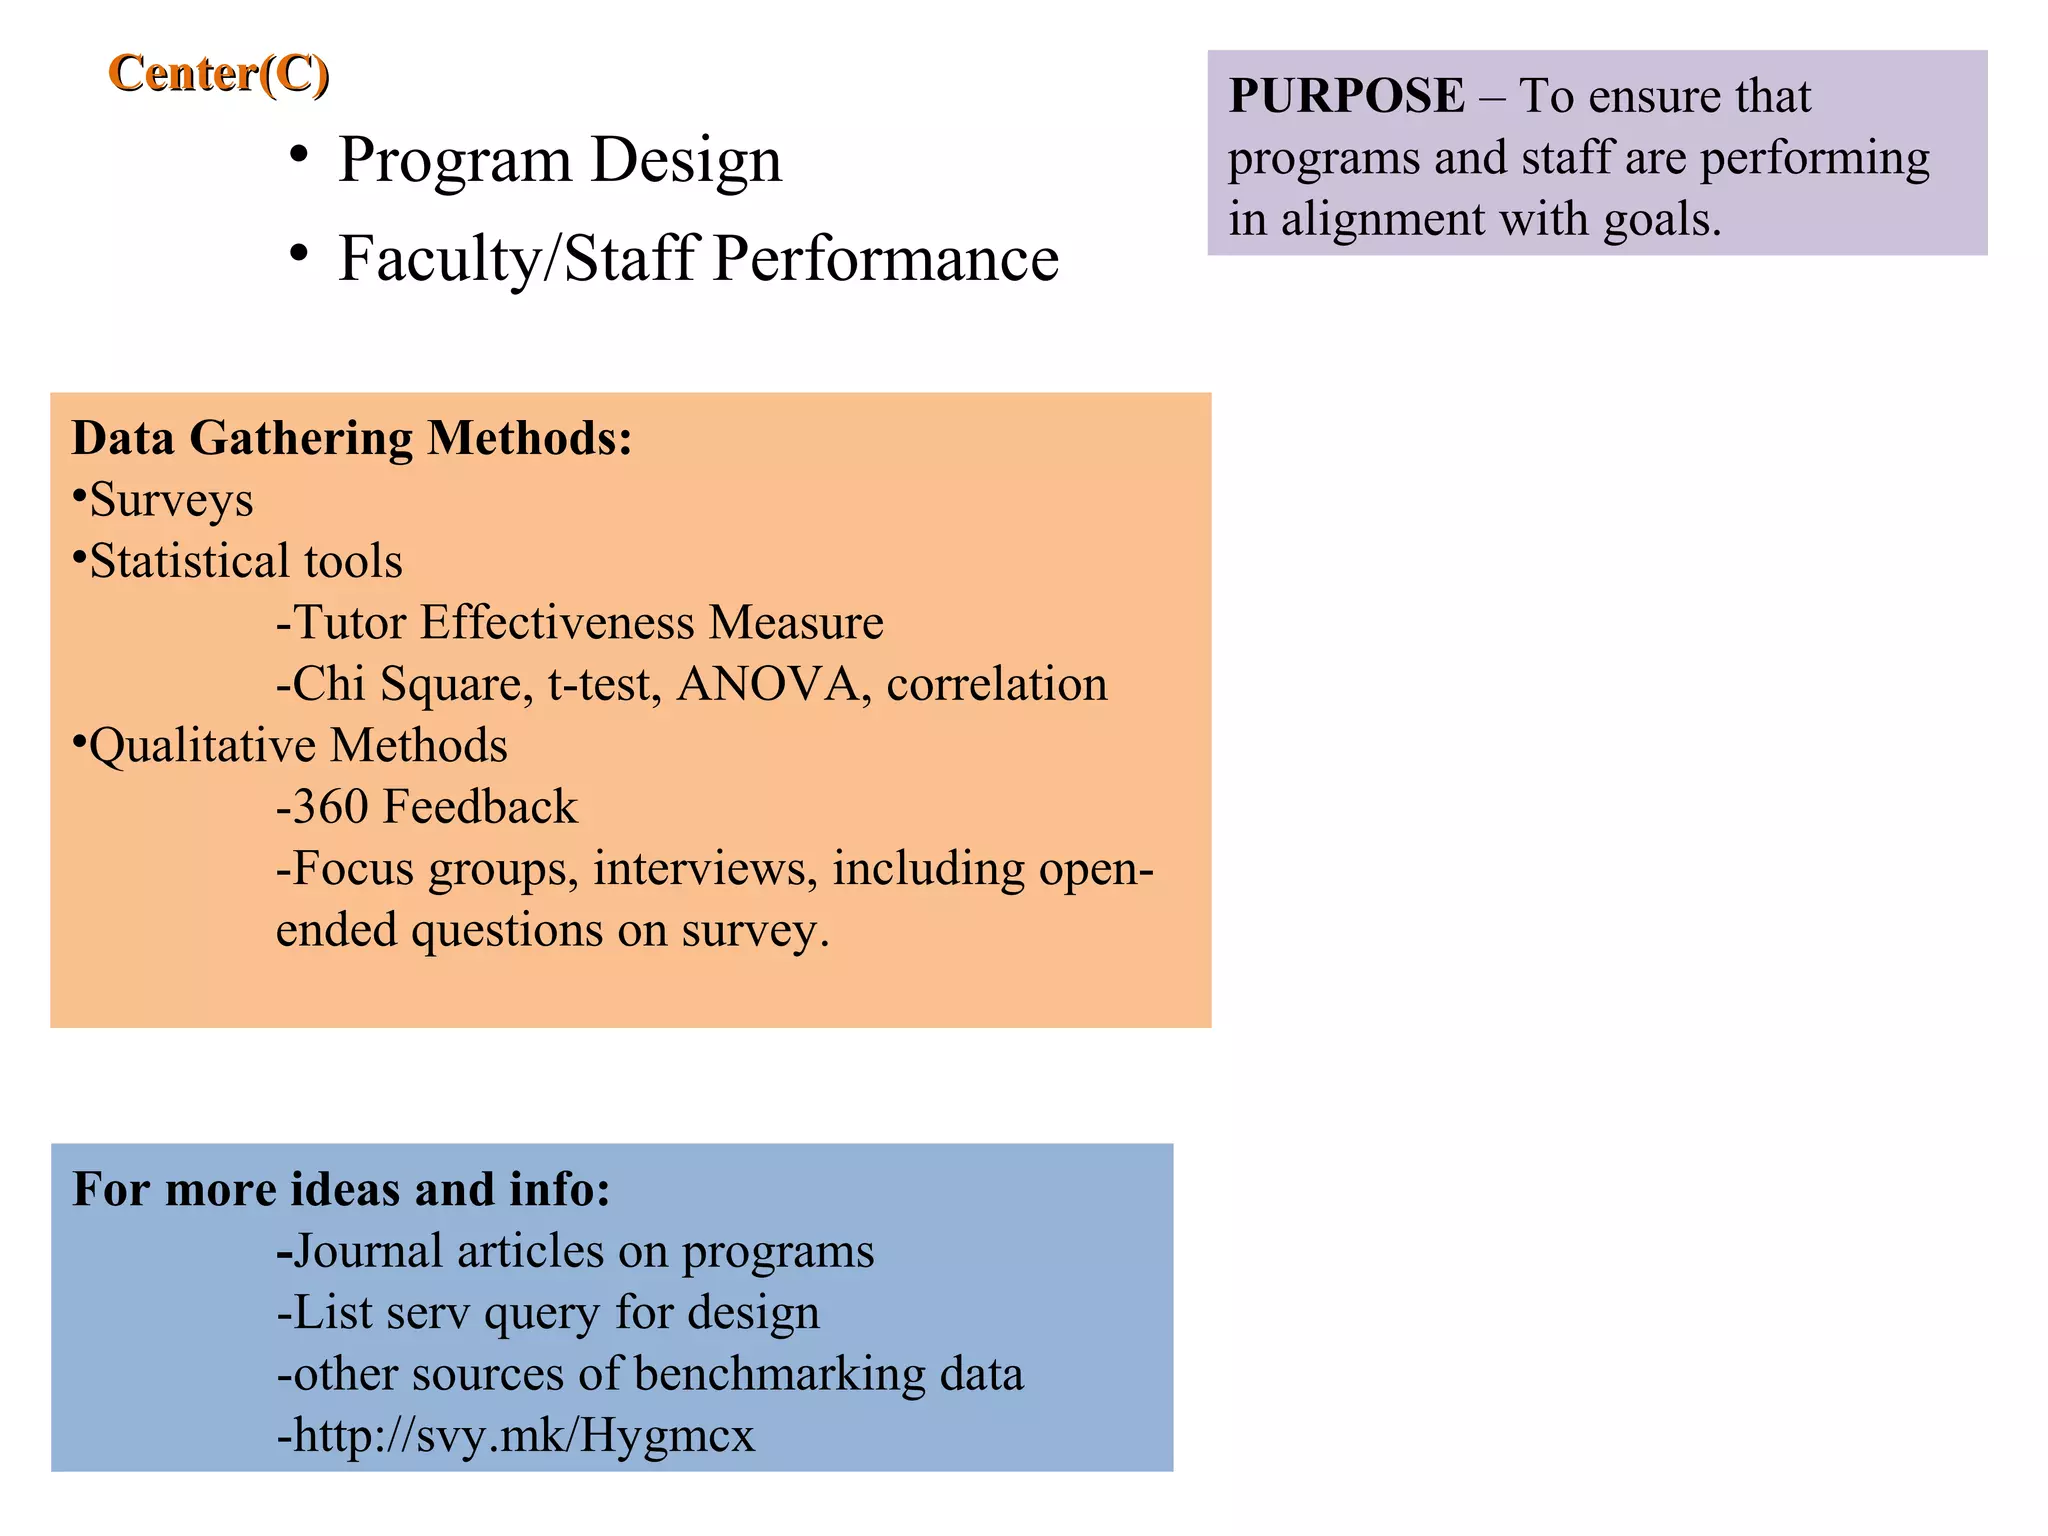
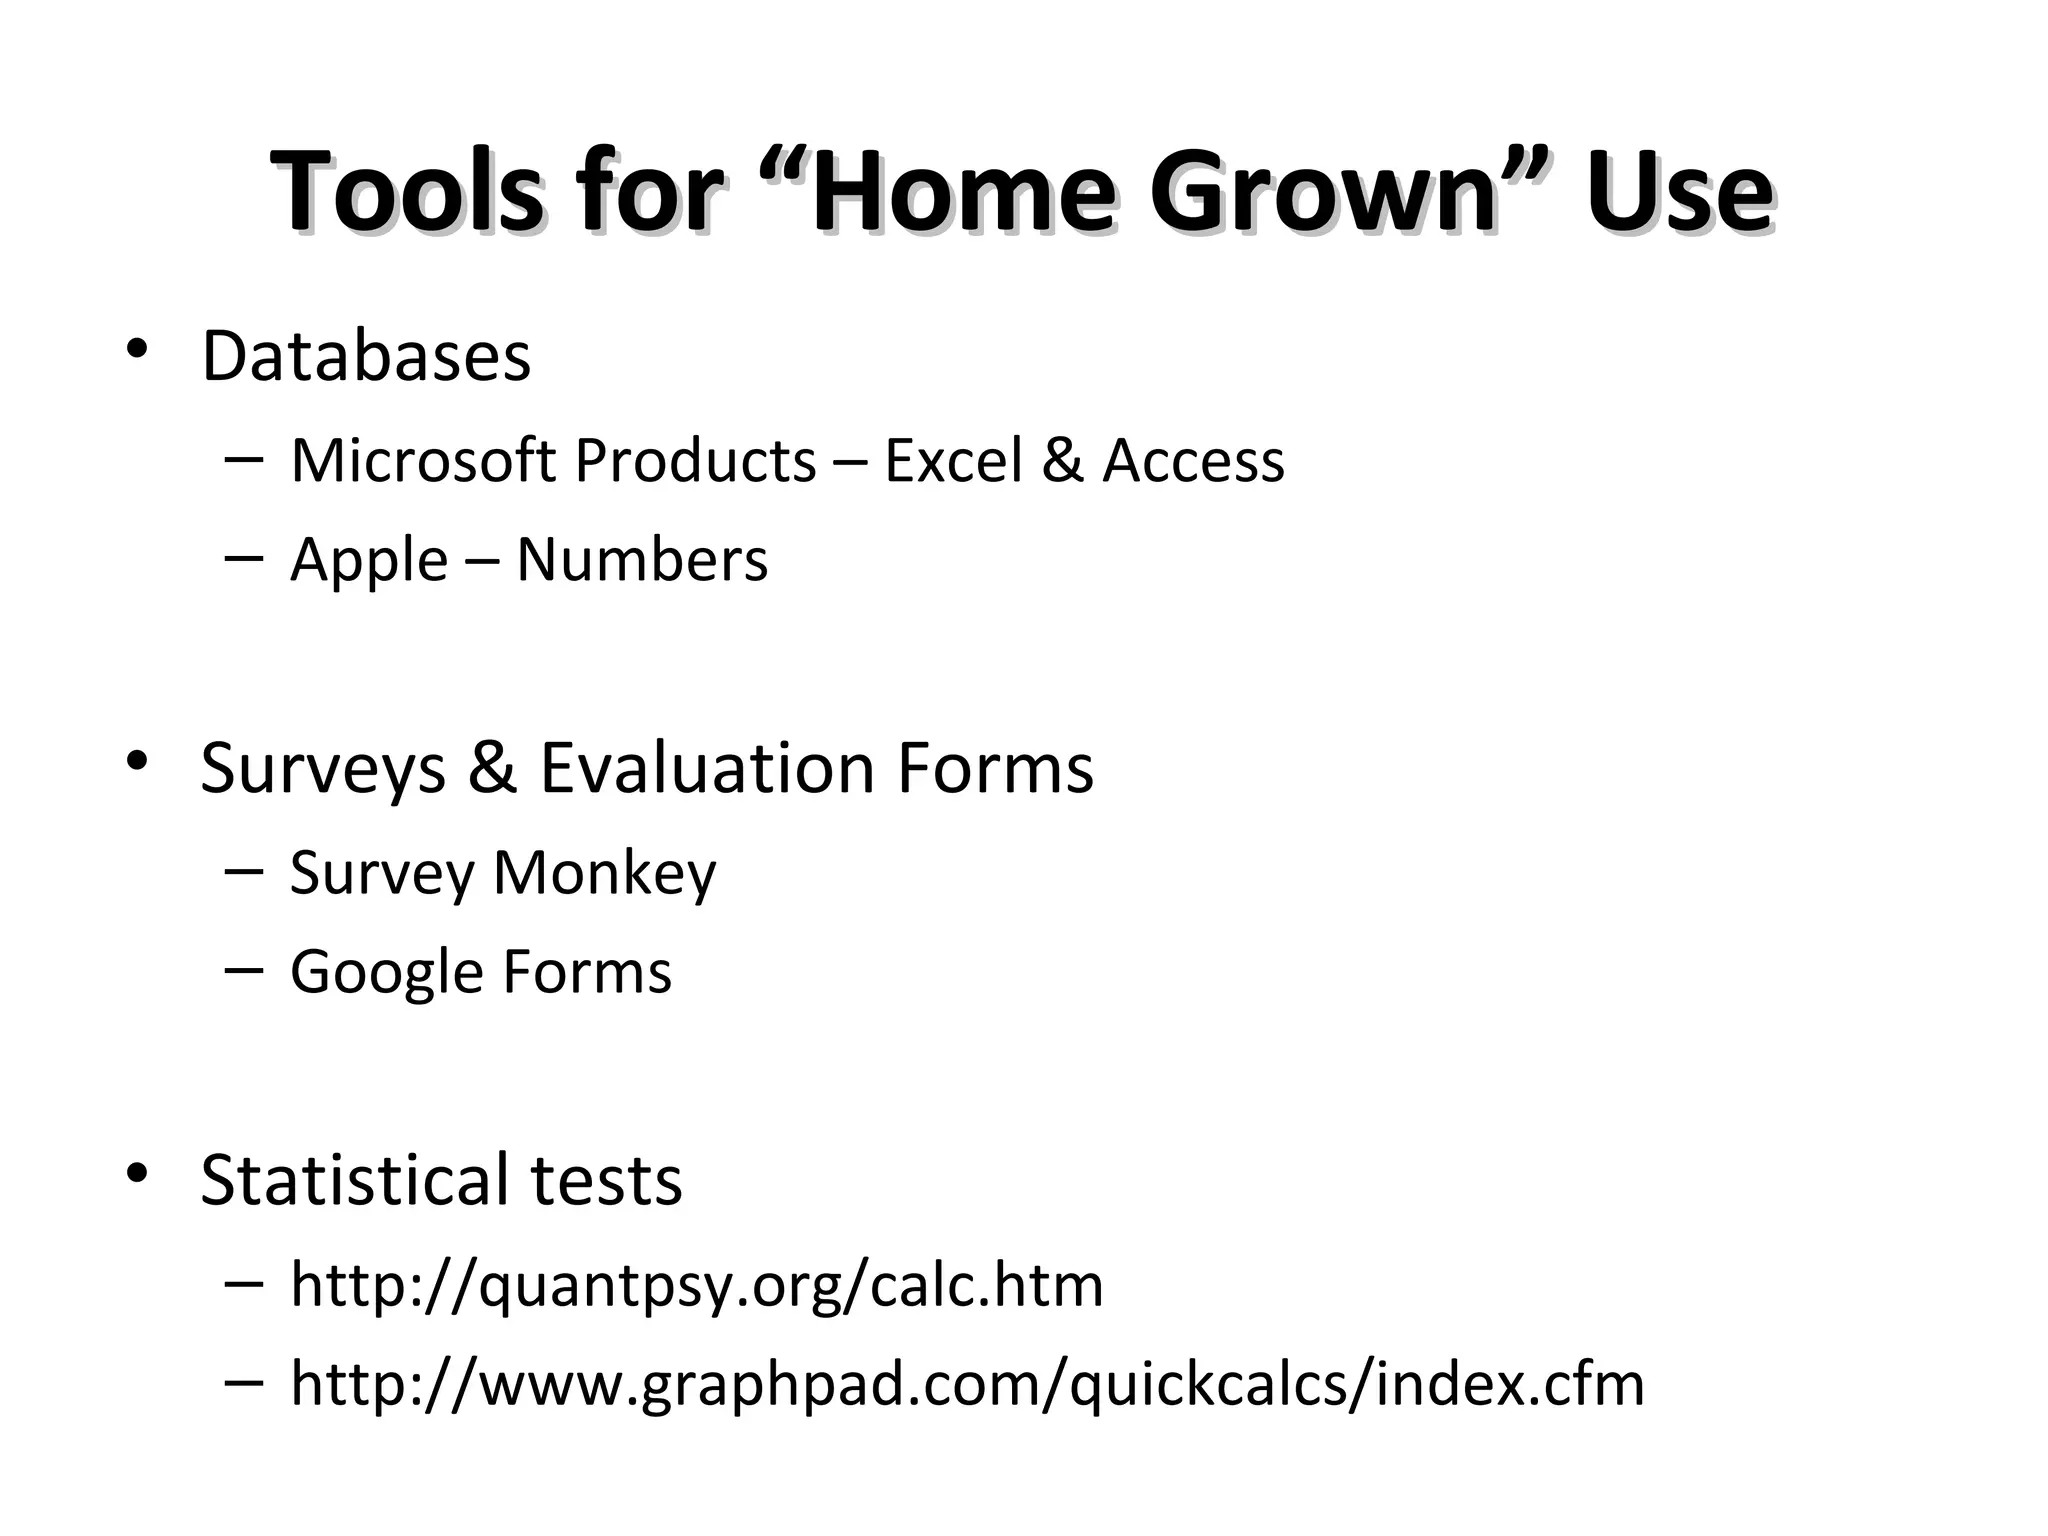
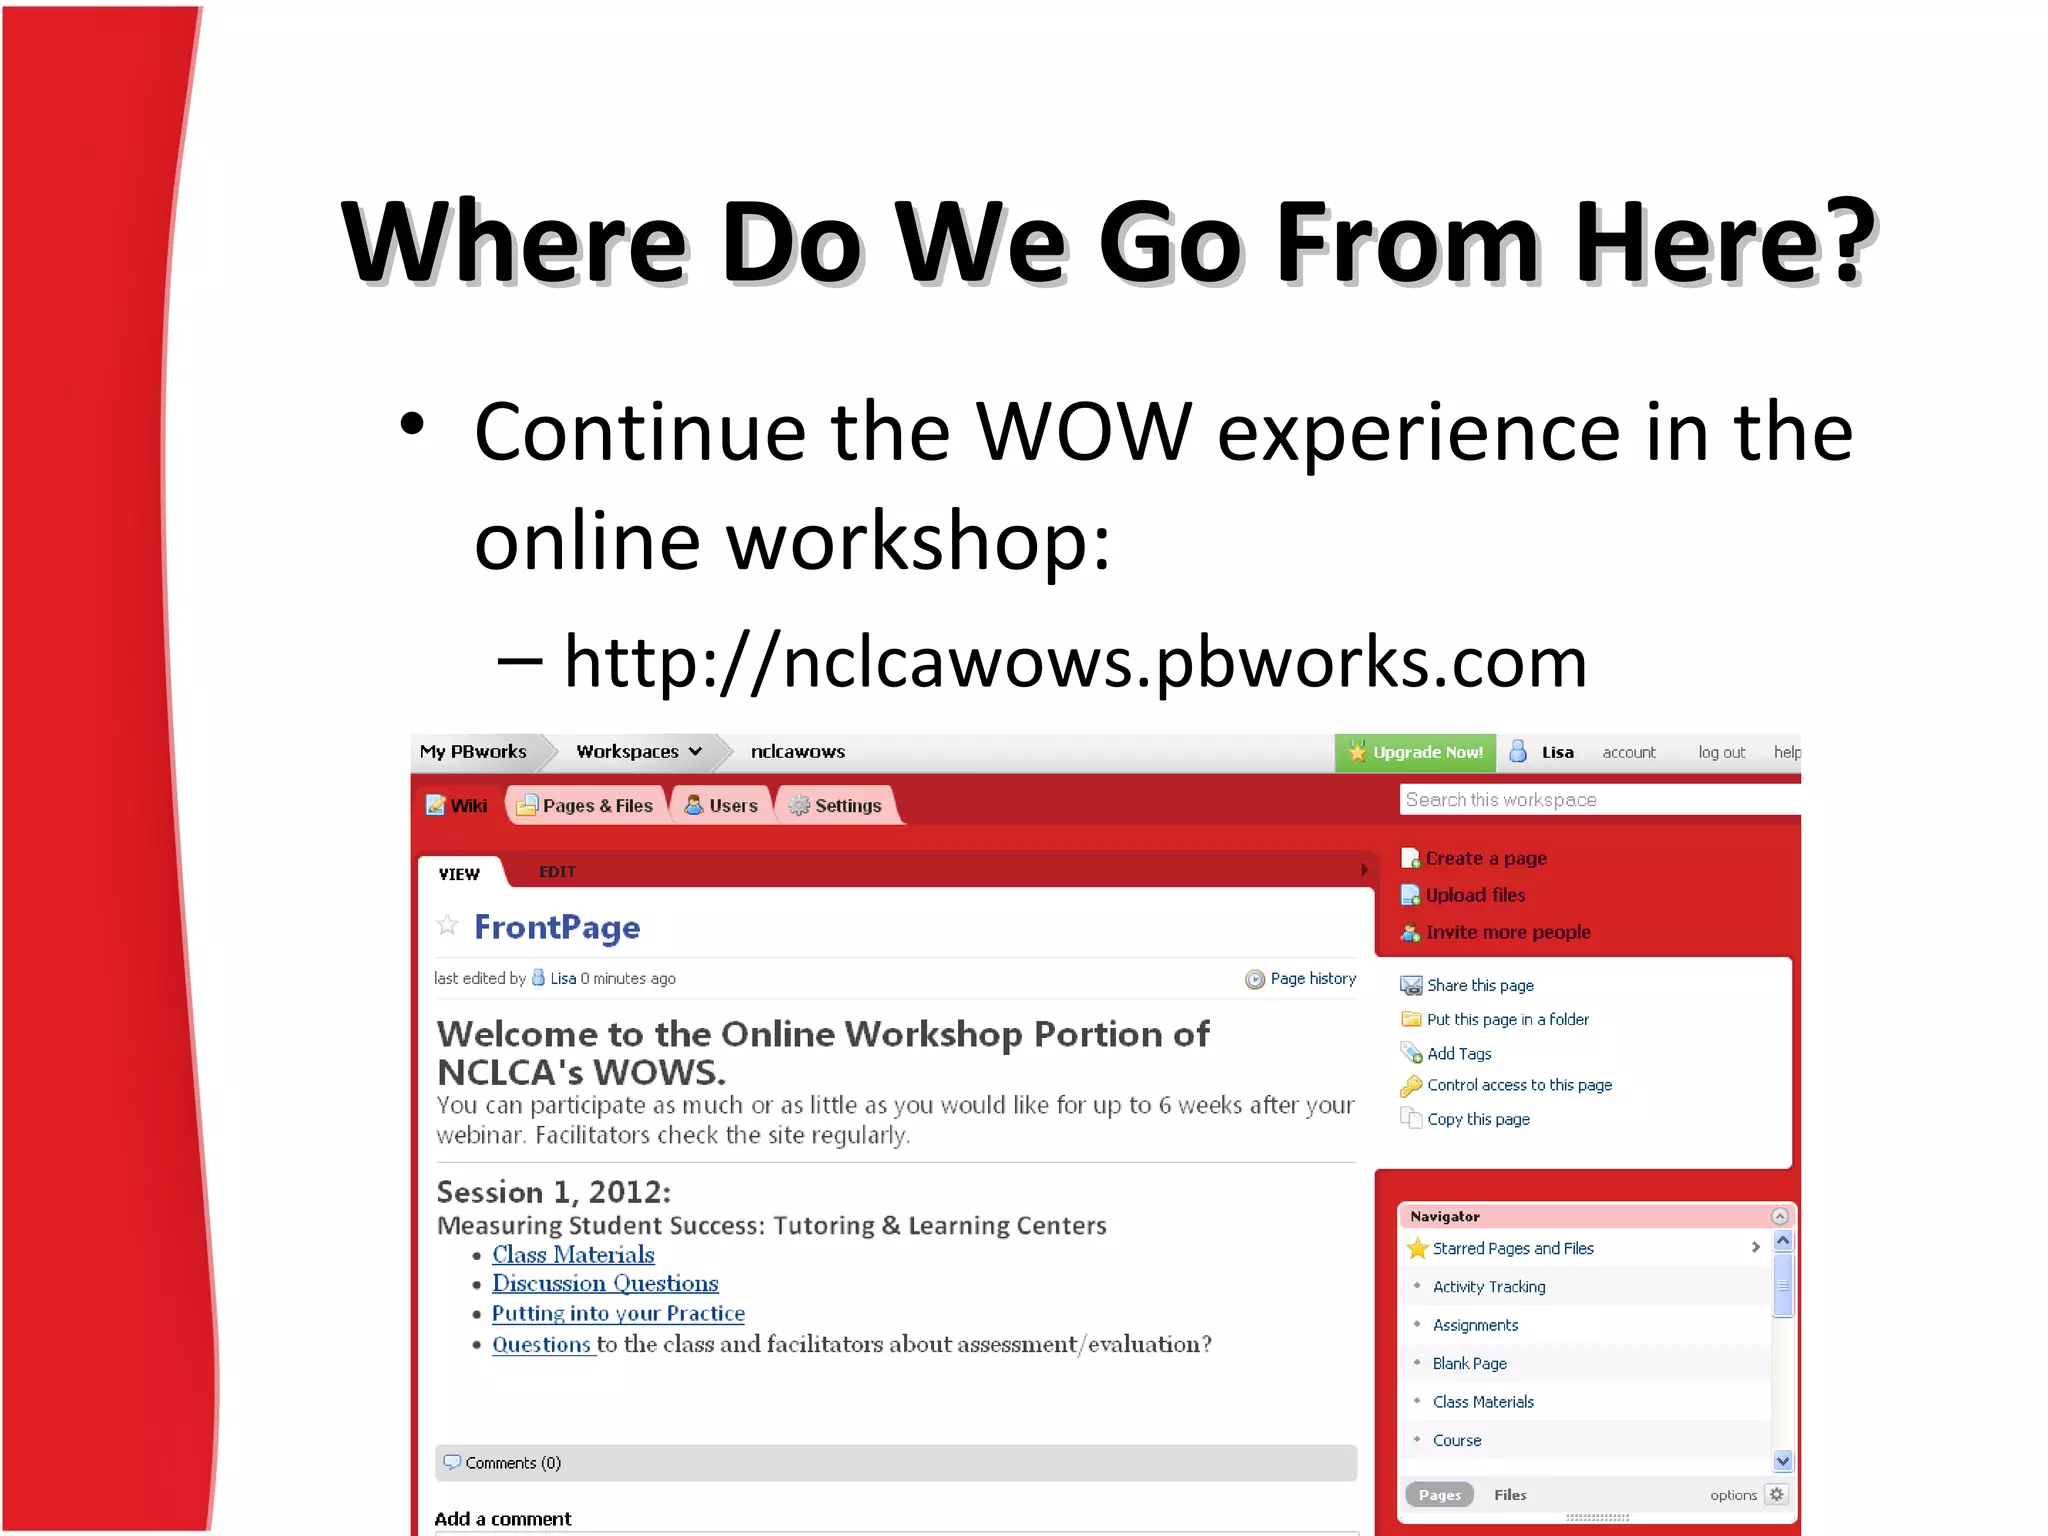
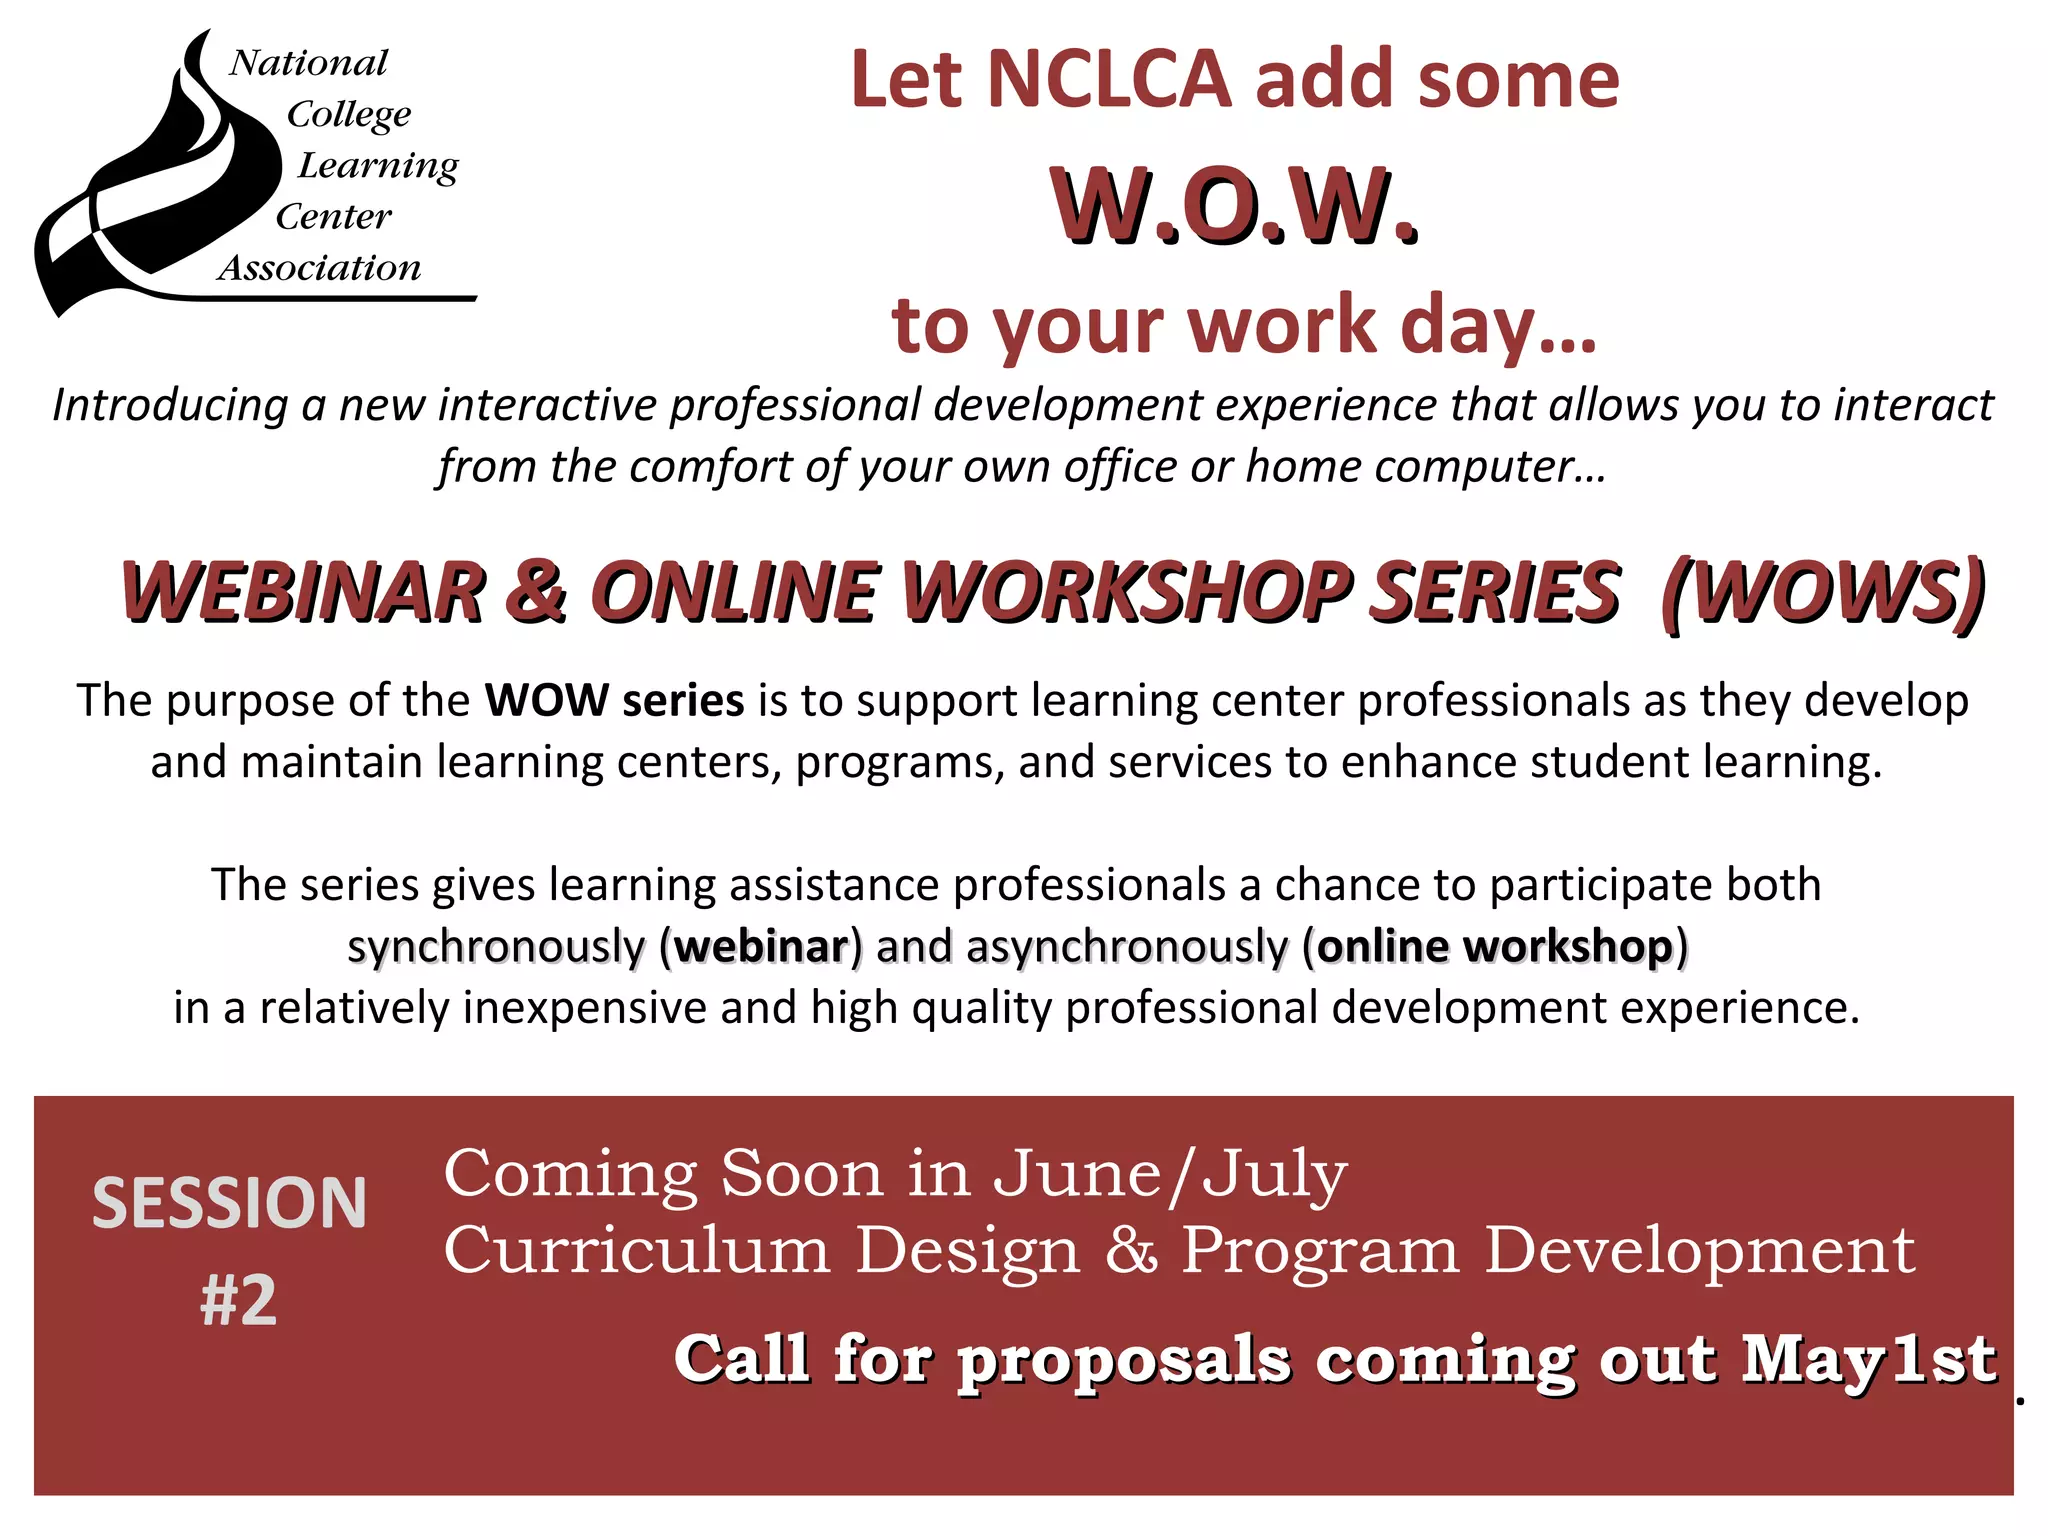
Measuring Student Success:Measuring Student Success:
Tutoring & Learning CentersTutoring & Learning Centers
NCLCA WOWS
April 2012
Dr. Lisa D’Adamo-Weinstein & Dr. Tacy L. Holliday
WEBINAR & ONLINE WORKSHOP SERIESWEBINAR & ONLINE WORKSHOP SERIES
(WOWS)(WOWS)
Welcome to WOW
• Webinar
– A topic overview with practical ideas to
get you thinking about the assessment
process.
– Covers a lot of material quickly.
– You’ll get access to the slides and to the
class recordings so you can spend more
time with any section of interest.
Welcome to WOW
• Online Workshop
– This part of the WOW allows you to “Learn by
doing.” There will be additional resources to
prompt your thinking and online discussions.
Answer the discussion questions will help you
put into practice the material that was covered
in the webinar.
– Culminates in the “Putting it Into Practice”
section where you’ll develop a short action
plan for your assessment.
– Gives you an opportunity to ask questions
about assessment and get support.
Click to show/hide Control Panel. (a)Click to show/hide Control Panel. (a)
Click to maximize/minimize theClick to maximize/minimize the
GoToTraining Viewer. (b)GoToTraining Viewer. (b)
Click to use drawing tools. (c)Click to use drawing tools. (c)
Click to raise/lower hand. (d)Click to raise/lower hand. (d)
Click to mute/unmute your line. (e)Click to mute/unmute your line. (e)
Attendee List. (f)Attendee List. (f)
Audio: Choose how you want to join the audioAudio: Choose how you want to join the audio
portion of the training. (g)portion of the training. (g)
Materials: Documents and links in this section areMaterials: Documents and links in this section are
provided by the organizer.(h)provided by the organizer.(h)
Chat: Where you can post questions or comments.Chat: Where you can post questions or comments.
(i)(i)
Measuring Student Success:Measuring Student Success:
Tutoring & Learning CentersTutoring & Learning Centers
• Introductions to the Class & Training
• The Big Picture
o What is assessment?
o Why should I assess?
• Developing An Assessment Plan
o Modes of Assessment
o Tools for Assessment
– Why should I assess?
– How do I assess?
Introduce yourselfIntroduce yourself
and state oneand state one
challenge you facechallenge you face
or one question youor one question you
have abouthave about
assessment.assessment.
THE
BIG PICTURE
What is assessment?
What are the challenges?
Why should I assess?
WHAT IS ASSESSMENT
Assessment is a continuous process aimed at understanding and
improving student learning and success in a manner that aligns
institutional missions/goals with the design and delivery of
programs and services in tutoring/learning centers.
In Tutoring & Learning Centers
Assessment makes a differencemakes a difference when it begins
with issues of use and illuminates questionsilluminates questions
that peoplepeople really care aboutcare about.
Through assessment, educators meet
responsibilitiesresponsibilities to studentsto students and toto the publicpublic.
Assessment fosters wider improvementwider improvement when
representativesrepresentatives from acrossacross the educationaleducational
communitycommunity are involved.
Assessment is most likely to lead tolead to
improvementimprovement when it is part of a largerlarger set ofset of
conditionsconditions that promote change.
Assumptions – What Assessment Can Do
SOURCE: http://www.aahe.org/assessment/principl.htm
Assessment works best when the programsprograms it
seeks to improve have clearclear,, explicitlyexplicitly statedstated
purposespurposes.
Assessment worksworks bestbest whenwhen it is ongoingongoing
not episodic.
Assessment requires attention to outcomesattention to outcomes
but also and equally to the experiencesexperiences that
lead to those outcomes.
Assessment is most effectiveeffective when it reflectsreflects
an understanding of learningunderstanding of learning as
multidimensionalmultidimensional, integratedintegrated, and revealed
in performance over timeperformance over time.
Assumptions – How Assessment Works Best
SOURCE: http://www.aahe.org/assessment/principl.htm
The Higher Learning Commission (HLC), has identified five fundamental
questions for institutions to use in discussing and defining assessment:
•How are your stated student learning outcomes appropriate to your mission,
programs, and degrees?
•What evidence do you have that students achieve your stated learning
outcomes?
•In what ways do you analyze and use evidence of student learning?
•How do you ensure shared responsibility for assessment of student learning?
•How do you evaluate and improve the effectiveness of your efforts to assess
and improve student learning?
http://www.oaklandcc.edu/assessment/Definition.htm
QUESTIONS TO CONSIDER
InstitutionalInstitutional
SupportSupport
&&
IntegrationIntegration
MISSION & GOALSMISSION & GOALS
STUDENTS’ NEEDSSTUDENTS’ NEEDS
PROGRAMSPROGRAMS
& SERVICES& SERVICES
STAFFING
&
STAFFING
&
RESOURCES
RESOURCES
ASSESSMENTASSESSMENT
&&
EVALUATIONEVALUATION
Qualitative
& Quantitative
Summative
& Formative
Persistence/
Graduation Rates
Annual/Quarterly
Reports
Institutional
Research
NADE
Self-Evaluation Guides
Cassazza
& Silverman
Faculty/Staff
Performance
Impact/
Effectiveness
Demographic/
Use Statistics
Case
Studies
Benchmarking
Cost/Benefit
Analysis
Program
Design
Outcomes
Existing
Research
Focus
Groups
Course End
Surveys
Part 1. MISSION
The learning assistance program must develop, record,develop, record,
disseminate, implement and regularly reviewdisseminate, implement and regularly review its
mission and goals. The learning assistance mission
statement must be consistent with the mission and goals of
the institution and with the standards of this document.
The mission statement must address the purpose of the
learning assistance program, the population it serves, the
programs and services it provides, and the goals the
program is to accomplish.
CAS Standards for Learning CentersCAS Standards for Learning Centers
SOURCE - http://www.nade.net/site/documents/CAS/CAS.pdf
CAS Standards for Learning CentersCAS Standards for Learning Centers
Part 4. ORGANIZATION and MANAGEMENT
The learning assistance program must be structuredstructured
purposefully and managed effectively to achieve statedpurposefully and managed effectively to achieve stated
goalsgoals. Evidence of appropriate structure must include current
and accessible policies and procedures, written job
descriptions and performance expectations for all employees,
functional work flow graphics or organizational charts, and
service delivery expectations.
SOURCE - http://www.nade.net/site/documents/CAS/CAS.pdf
CAS Standards for Learning CentersCAS Standards for Learning Centers
Part 13. ASSESSMENT and EVALUATION
The learning assistance program must undergo regular andregular and
systematic qualitative and quantitative evaluationssystematic qualitative and quantitative evaluations to
determinedetermine to what degree the stated mission and goals aredegree the stated mission and goals are
being metbeing met. The learning assistance program should have the
ability to collect and analyze datacollect and analyze data through its own resourcesown resources
and through access to appropriate data generated by theappropriate data generated by the
institutioninstitution. Periodic evaluations of the learning assistance
program and services may be performed by on campus experts
and outside consultants and disseminated to appropriate
administrators.
SOURCE - http://www.nade.net/site/documents/CAS/CAS.pdf
Alexander and Serafass’ (1999)
planning model for educational
institutions.
Alexander, W.F., Serfass, R.W. (1999). Futuring Tools for Strategic Quality Planning in Education. Quality Press; Milwaukee.
The Assessment RealitiesThe Assessment Realities
• Annual/Quarterly Reports
• Demographic/Usage Statistics
• Retention/Completion Rate
• Faculty/Staff Performance
• Budget/Staffing
• Accreditation
• Improve Effectiveness & Efficiency
• Benchmarking/Standards
• Program Design
• Align Mission and Goals
Key
Ideas:
1)Assessment is
valuable to the
extent that it is
considered
within the larger
context of
mission & goals.2)We don’t have
to “reinvent the
wheel” but we do
need to customize
it for our
contexts.
3) We need to
assess in order
to engage in
“honest
advocacy” in
revising and
improving
programs and
services, and in
recognizing
staff
performance.
THE
BIG PICTURE
Developing
An Assessment Plan
Modes of Assessment
Tools for Assessment
A CLOSER LOOK:
DEVELOPING AN ASSESSMENT PLAN
How do I assess?
Developing an Assessment Plan
1. Articulate the Purpose of Assessment
2. Align With & For Success
3. Select Appropriate Measures/Data-gathering
Methods
4. Organize, Analyze & Interpret Results
5. Make Recommendations for Action
Casazza & Silverman (1996)
Learning Assistance & Development Education: A Guide for Effective Practice
Purpose of AssessmentPurpose of Assessment
• Annual/Quarterly Reports
• Demographic/Usage Statistics
• Retention/Completion Rate
• Faculty/Staff Performance
• Budget/Staffing
• Accreditation
• Improve Effectiveness & Efficiency
• Benchmarking/Standards
• Program Design
• Align Mission and Goals
Identify Biggest StakeholdersIdentify Biggest Stakeholders
• Annual/Quarterly Reports
• Demographic/Usage Statistics
• Retention/Completion Rate
• Faculty/Staff Performance
• Budget/Staffing
• Accreditation
• Improve Effectiveness & Efficiency
• Benchmarking/Standards
• Program Design
• Align Mission and Goals
Student (S)Student (S) Center(C)Center(C) Institution (I)Institution (I)
(C)(C) (I)(I)
(C)(C) (I)(I)
(I)(I)
(C)(C)
(C)(C) (I)(I)
(C)(C) (I)(I)
(I)(I)
(C)(C)
(S)(S) (C)(C) (I)(I)
(S)(S) (C)(C)
PrioritizingPrioritizing
AssessmentAssessment • Retention/Completion Rate
• Benchmarking/Standards
• Program Design
• Faculty/Staff Performance
• Annual/Quarterly Reports
• Demographic/Usage Statistics
• Budget/Staffing
• Accreditation
• Improve Effectiveness & Efficiency
• Align Mission and Goals
Institution (I)Institution (I)
Center (C)Center (C)
Center (C)Center (C) Institution (I)Institution (I)
Student (S)Student (S) Center (C)Center (C)
Student (S)Student (S) Center (C)Center (C) Institution (I)Institution (I)
1st 2nd
Make sureMake sure
everything lineseverything lines
up/realign &up/realign &
adjust asadjust as
necessarynecessary
Get necessary dataGet necessary data
to balanceto balance
INTERNAL &INTERNAL &
EXTERNALEXTERNAL
tensions/needstensions/needs
Center & InstitutionalCenter & Institutional
forces feed eachforces feed each
otherother
3rd
4th
And all should alignAnd all should align
with the work we dowith the work we do
in our centers andin our centers and
with/for our studentswith/for our students
Student (S)Student (S) Center (C)Center (C) Institution (I)Institution (I)
Institution (I)Institution (I)
Center (C)Center (C)
Center (C)Center (C) Institution (I)Institution (I)Student (S)Student (S) Center (C)Center (C)
PrioritizingPrioritizing
AssessmentAssessment
by Stakeholderby Stakeholder
• Retention/Completion Rate
• Benchmarking/Standards
• Program Design
• Faculty/Staff Performance
• Annual/Quarterly Reports
• Demographic/Usage Statistics
• Budget/Staffing
• Accreditation
• Improve Effectiveness & Efficiency
• Align Mission and Goals
Institution (I)Institution (I)
Center(C)Center(C)
Center(C)Center(C) Institution (I)Institution (I)
Student (S)Student (S) Center(C)Center(C)
Student (S)Student (S) Center(C)Center(C) Institution (I)Institution (I)
EXAMPLE - Aligning for Success
What does student success “look like” for your institution?
Examples:
•the student demonstrates knowledge of resources
available at the college and the “appropriate” use of those
resources. (Institution (I)Institution (I))
•a student that completes the course/certification
program/transfer program as desired
(Institution (I)Institution (I))
•a student that is able to figure out a way to match their
desires and abilities to their goal
(Institution (I)Institution (I))
Student (S)Student (S) Center (C)Center (C) Institution (I)Institution (I)
EXAMPLE - Aligning for Success
What does student success “look like” for your learning center?
Examples:
•student’s needs were met as evidenced by their questions being answered and
the service being satisfactory. (Center (C)Center (C))
•a student who may need significant assistance when first arriving at MC but that
need declines as the student progresses through each class and through their
program of study. (Center (C)Center (C))
•a student that can demonstrate the ability to obtain knowledge pertaining to a
specific class/discipline. (Center (C)Center (C))
•being able to apply knowledge to a novel situation—demonstrating critical
thinking skills, being an independent learner and seeker of knowledge.
(Center (C)Center (C))
•the student gains proficiency in study skills. (Center (C)Center (C))
•a student that understands the explained material and is able to do similar
problems and able to explain the concept to another student. (Center (C)Center (C))
ExampleExample
Easy Tutoring Effectiveness Measure
Purpose: Determine whether a relationship existed between tutoring and
student learning.
Goals: Minimize the amount of recordkeeping. Obtain meaningful data.
Plan:
•Focus on the immediate result of tutoring, which was classified in one of two
ways: (a) either learning had occurred, or (b) learning had not occurred.
•Student learning was operationally defined as being able to do something
correctly after working with a tutor the student could not do correctly before
working with the tutor.
•The demonstration of learning was (a) correctly solving a problem, (b)
correctly explaining a concept, or (c) correctly applying a previously unclear
or incorrect concept.
Source: Holliday, T. (Fall, 2013). Evaluating the Effectiveness of Tutoring: An Easier way . The Learning Assistance Review. National College Learning Center
Association.
Easy Tutoring Effectiveness Measure
Method: To determine whether learning had occurred, a simplified version of
a pretest, posttest modality was utilized.
•Pre-tutoring Condition: Student doesn’t understand or know how to do
something.
•Post-tutoring Condition: Either the student does understand or know how
to do something or the student does not.
Results:
The frequency of observations where students could demonstrate
understanding after tutoring and the frequency of observations where
students could not demonstrate understanding after tutoring were analyzed
with a Chi Square goodness of fit test. The results were significant, c2
(1, N =
1756) = 1195.68, p < .0001. Students demonstrated understanding
significantly more than not after they received tutoring.
Easy Tutoring Effectiveness Measure
• Results: Results were also significant when analyzed by Tutor and by Course.
Effective Tutoring Outcomes by Tutor
Tutor Yes No c2
p
Tutor 1 279 105 77.94 <.0001
Tutor 2 844 33 748.12 <.0001
Tutor 3 343 1 338.02 <.0001
Tutor 4 55 5 40.2 <.0001
Tutor 5 248 28 173.78 <.0001
Key
Ideas:
1) Use these
definitions of
success or create
your own.
2) Check the
chosen
definitions with
stakeholders and
rework as needed
to ensure
alignment with
mission/goals.
3) Let the
definitions
of success
guide what
and how you
measure.
A CLOSER LOOK: MODES OF ASSESSMENT
How do I assess?
Modes of Assessment
–Quantitative Methods:
• Demographics/usage data
• Survey/Evaluative data
• Statistical impact data
–Qualitative Methods:
• Case studies
• Interviews/Focus groups
• Written observations
Demographic/Usage Data
• Which students use your Center/Tutoring?
– Categories of interest (major, special populations,
ethnicity, age, GPA)
– Tip: Are the demographics of your Center representative
of your College/Mission? Look at who isn’t using your
Center and see how they can be reached.
• Why do they use your Center?
• How often do they use your Center?
– Repeat business
– Contact hours
ExamplesExamples
DEMOGRAPHICSDEMOGRAPHICS
Purpose : Who is using the center and for what classes
Method : Survey Monkey
Results : Used to plan tutor schedule and allocate resources.
Spring
2006
Fall 2006 Spring
2007
Fall 2007
Total
Logins
7800 7638 7883 7902
Total
Number of
Unique
Students
790 846 750 774
Total
Number of
Unique
Students
for
Tutoring
265 277 286 290
DEMOGRAPHICSDEMOGRAPHICS
Purpose : How many students visit the Center and for how many times.
Method : Access Database done when students sign in to use the Center.
Results : Used to show busyness and repeat data.
0
50
100
150
200
250
300
350
1to2Visits 3to5 6to10 11to15 16+
Spring 2006
Fall2006
Spring 2007
Fall2007
DEMOGRAPHICSDEMOGRAPHICS
Purpose : Categorize individual appointments – how, content and # of students
Method : Excel database completed by staff after appointment.
Results : Used for annual report and to allocate resources.
DEMOGRAPHICSDEMOGRAPHICS
Purpose : Captures Peer Coaching Program usage - content and # of students
Method : Excel database completed by Peer Coaching Program Coordinator.
Results : Used for CRLA hours of tutoring and annual report.
Modes of Assessment
–Quantitative Methods:
• Demographics/usage data
• Survey/Evaluative data
• Statistical impact data
–Qualitative Methods:
• Case studies
• Interviews/Focus groups
• Written observations
Survey DataSurvey Data
• What feedback do you get about your Center/Tutoring?
– Categories of interest (programs, services, location, hours.
Etc.)
• How effective are your services and programs?
– Self-reports & evaluation
– “Customer” satisfaction
– Product/Service review/improvements
ExamplesExamples
SURVEY DATASURVEY DATA
Purpose : Used as checklist for what I want tutors to do. Making tutor behavior observable.
Method : Survey Monkey. Online access 24/7. Survey “push” 2x per semester.
Results : Used for report and to identify areas for improvement through training/coaching staff.
Category Spring 2011
SLC was well organized: 4.73
The hours were sufficient: 4.56
Tutors knew material well: 4.7
Tutors used various materials: 4.7
Tutors showed care and respect: 4.75
Tutors presented materials in an
understandable manner:
4.78
Student would recommend the SLC to
others:
4.83
SURVEY DATASURVEY DATA
Purpose : Used as checklist for student success behaviors and to assess those desired outcomes.
Method : Survey Monkey. Online access 24/7. Survey “push” 2x per semester.
Results : Used for report and to identify areas for improving service.
Service was satisfactory: 4.69
Student’s questions were answered: 4.67
Student’s skills improved: 4.6
Student could demonstrate
improvement by doing problems:
4.59
Student could demonstrate
improvement by explaining:
4.55
Student could demonstrate
improvement applying to different
situations:
4.66
Student learned to become a more
independent learner:
4.38
Student gained confidence: 4.64
Student received better grade: 4.67
SURVEY DATASURVEY DATA
Purpose : Used to assess how students are using a tool. In this case a resource/date book.
Method : Survey Monkey.
Results : Used to assess implementation success and to plan for future viability.
Modes of Assessment
–Quantitative Methods:
• Demographics/usage data
• Survey/Evaluative data
• Statistical impact data
–Qualitative Methods:
• Case studies
• Interviews/Focus groups
• Written observations
Basic Statistics
• Correlations (directional relationship between
two variables)
• T-tests (difference between two groups)
• ANOVAS (difference among three or more
groups)
• Chi Squares (difference between two groups
with one group being a category)
Statistical Impact Data
• Retention Data
• GPA
• Scores Between Groups (follow-up with statistical
test)
• Pre-test/Post-test on exams
• Tips:
– Correlation is not causation.
– Get follow-up data from students who did not come
back.
– Be careful with other variables.
ExamplesExamples
• 76 students participating in a tutoring program
for at risk students were retained (66%). These
students used tutoring services more than those
not students who were not retained (t =5.27 p
<.001). Students with higher high school GPAs
were more likely to use tutoring (r =.198, p =.040)
Source: Laskey, M. L., & Hetzel, C. J. (Spring, 2011). Investigating factors related to retention of at-risk college students. The
Learning Assistance Review 16(1), 31-43.
Statistical ImpactStatistical Impact
Purpose : To determine retention rate based on tutoring.
Method : Used institutional research data to determine correlation and get data for t-test.
Results : Used in report and publication.
Intro to Bio Intro to Bio Intro to Bio Intro to Bio
paired with
Study Skills
67.3 62.9 59.75 70.4
Statistical ImpactStatistical Impact
Purpose : To determine whether including study skills training with a course was effective.
Method : Mean exam scores calculated. Difference among groups. ANOVA for more in-depth.
Results : Used for deciding whether the do again. Used to market the study skills.
RS101: Student Success Course
 Performance Better than Predicted (based upon CEER scores)
- RS101 cadets outperform predicted APS by approx 0.1 on 4.0 scale
- Non-RS101 cadets under perform predicted APS by approx. 0.05 (p=.0001)
 Small but Statistically Significant Positive Effect on Graduation Rates
 Increased Confidence in Ability to Apply Good Learner/Study Strategies
- Class ’04 Pre/Post SBI Scores show increased confidence in routine academic
tasks (p=.002)
Statistical ImpactStatistical Impact
Purpose : To determine effectiveness of student success course.
Method : Difference between groups. Pre/post test.
Results : Used in report, publication, and for marketing the course.
0
100
200
300
400
500
600
700
800
900
99-00 00-01 01-02 02-03 03-04
282 278 277
250
270
745 729
761
874
737
90 88 88 89 8991 87 86 82 86
PreWPM PostWPM PreComp PostComp
Statistical ImpactStatistical Impact
Purpose : To determine effectiveness of student success course.
Method : Pre/post test.
Results : Used in report, publication, and for marketing the course.
RS102 Reading
Efficiency
•Average reading gain
497 wpm
• Comprehension
constant @ 88%
Modes of Assessment
– Quantitative Methods:
• Demographics/usage data
• Survey/Evaluative data
• Statistical impact
– Qualitative Methods:
• Case studies
• Interviews/Focus groups
• Written observations
ExamplesExamples
Case study and written observations.Case study and written observations.
Source: Lisa D’Adamo-Weinstein, Ph.D., Language Education, Indiana University-Bloomington,
2001. Thesis: Kaleidoscope Tapestries: Weaving Patterns from First-Generation College Women's
Telling-Stories
Study method
Upper level nursing students served as peer tutors for lower level nursing
students. The peer tutors received tutor training and guidelines for the
sessions. One-to-one tutoring sessions took place weekly for 10
weeks. Focus groups and individual interviews at the middle and end
of the semester were used to gather information about the students’
experiences.
• Results
The responses to focus groups and interview questions were analyzed.
Positive and negative experiences were categorized. Positive
experiences included enhancement of learning skills and personal
growth. Negative experiences were primarily attributed to frustration
about time commitments and mismatched learning styles.
• Conclusions
Both tutors and tutees benefited to some extent from this peer-tutoring
process. The process would be enhanced in future if the frustrations
experienced by some could be addressed.
Source: Chow, Filomena L.W., and Alice J.T. Yuen Loke. "Learning partnership -- the experience of peer tutoring among nursing
students: A qualitative study." International Journal of Nursing Studies 44.2 (2007): 237+. Academic OneFile. Web. 26 Mar.
2012.
Focus groups and individual interviews.Focus groups and individual interviews.
Key
Ideas:
1) Use a variety
of modes.
2) Educate
decision-makers
about why you’re
measuring what
you’re
measuring and
not something
else.
Check InCheck In
A CLOSER LOOK: TOOLS FOR ASSESSMENT
How do I assess?
MatchingMatching
PurposePurpose
with Toolswith Tools
forfor
AssessmentAssessment
• Retention/Completion Rate
• Benchmarking/Standards
Institution (I)Institution (I) PURPOSE – My Dean wants
retention data of students who
utilize our tutoring center and she
wants to know how our students
measure up in comparison with
sister schools.
Data Gathering Methods:
•Institutional Research for graduation and retention
statistics
•Internal database of student use of center
- graduation and persistence data
•Statistical tools – descriptive statistics
For more ideas and info:
-Listserv query
-https://www.noellevitz.com/
- other sources of benchmarking data
• Program Design
• Faculty/Staff Performance
PURPOSE – To ensure that
programs and staff are performing
in alignment with goals.
Data Gathering Methods:
•Surveys
•Statistical tools
-Tutor Effectiveness Measure
-Chi Square, t-test, ANOVA, correlation
•Qualitative Methods
-360 Feedback
-Focus groups, interviews, including open-
ended questions on survey.
Center(C)Center(C)
For more ideas and info:
-Journal articles on programs
-List serv query for design
-other sources of benchmarking data
-http://svy.mk/Hygmcx
Tools for “Home Grown” UseTools for “Home Grown” Use
• Databases
– Microsoft Products – Excel & Access
– Apple – Numbers
• Surveys & Evaluation Forms
– Survey Monkey
– Google Forms
• Statistical tests
– http://quantpsy.org/calc.htm
– http://www.graphpad.com/quickcalcs/index.cfm
What’s Next?What’s Next?
Where Do We Go From Here?Where Do We Go From Here?
• Continue the WOW experience in the
online workshop:
– http://nclcawows.pbworks.com
Let NCLCA add some
W.O.W.W.O.W.
to your work day…
The purpose of the WOW series is to support learning center professionals as they develop
and maintain learning centers, programs, and services to enhance student learning.
The series gives learning assistance professionals a chance to participate both
synchronously (synchronously (webinarwebinar) and asynchronously () and asynchronously (online workshoponline workshop))
in a relatively inexpensive and high quality professional development experience.
Introducing a new interactive professional development experience that allows you to interact
from the comfort of your own office or home computer…
SESSION
#2
Coming Soon in June/July
Curriculum Design & Program Development
Call for proposals coming out May1stCall for proposals coming out May1st .
WEBINAR & ONLINE WORKSHOP SERIES (WOWS)WEBINAR & ONLINE WORKSHOP SERIES (WOWS)

Measuring Student Success: Tutoring and Learning Centers

  • 1.
    Measuring Student Success:MeasuringStudent Success: Tutoring & Learning CentersTutoring & Learning Centers NCLCA WOWS April 2012 Dr. Lisa D’Adamo-Weinstein & Dr. Tacy L. Holliday WEBINAR & ONLINE WORKSHOP SERIESWEBINAR & ONLINE WORKSHOP SERIES (WOWS)(WOWS)
  • 2.
    Welcome to WOW •Webinar – A topic overview with practical ideas to get you thinking about the assessment process. – Covers a lot of material quickly. – You’ll get access to the slides and to the class recordings so you can spend more time with any section of interest.
  • 3.
    Welcome to WOW •Online Workshop – This part of the WOW allows you to “Learn by doing.” There will be additional resources to prompt your thinking and online discussions. Answer the discussion questions will help you put into practice the material that was covered in the webinar. – Culminates in the “Putting it Into Practice” section where you’ll develop a short action plan for your assessment. – Gives you an opportunity to ask questions about assessment and get support.
  • 5.
    Click to show/hideControl Panel. (a)Click to show/hide Control Panel. (a) Click to maximize/minimize theClick to maximize/minimize the GoToTraining Viewer. (b)GoToTraining Viewer. (b) Click to use drawing tools. (c)Click to use drawing tools. (c) Click to raise/lower hand. (d)Click to raise/lower hand. (d) Click to mute/unmute your line. (e)Click to mute/unmute your line. (e) Attendee List. (f)Attendee List. (f) Audio: Choose how you want to join the audioAudio: Choose how you want to join the audio portion of the training. (g)portion of the training. (g) Materials: Documents and links in this section areMaterials: Documents and links in this section are provided by the organizer.(h)provided by the organizer.(h) Chat: Where you can post questions or comments.Chat: Where you can post questions or comments. (i)(i)
  • 6.
    Measuring Student Success:MeasuringStudent Success: Tutoring & Learning CentersTutoring & Learning Centers • Introductions to the Class & Training • The Big Picture o What is assessment? o Why should I assess? • Developing An Assessment Plan o Modes of Assessment o Tools for Assessment – Why should I assess? – How do I assess?
  • 7.
    Introduce yourselfIntroduce yourself andstate oneand state one challenge you facechallenge you face or one question youor one question you have abouthave about assessment.assessment.
  • 8.
    THE BIG PICTURE What isassessment? What are the challenges? Why should I assess?
  • 9.
    WHAT IS ASSESSMENT Assessmentis a continuous process aimed at understanding and improving student learning and success in a manner that aligns institutional missions/goals with the design and delivery of programs and services in tutoring/learning centers. In Tutoring & Learning Centers
  • 10.
    Assessment makes adifferencemakes a difference when it begins with issues of use and illuminates questionsilluminates questions that peoplepeople really care aboutcare about. Through assessment, educators meet responsibilitiesresponsibilities to studentsto students and toto the publicpublic. Assessment fosters wider improvementwider improvement when representativesrepresentatives from acrossacross the educationaleducational communitycommunity are involved. Assessment is most likely to lead tolead to improvementimprovement when it is part of a largerlarger set ofset of conditionsconditions that promote change. Assumptions – What Assessment Can Do SOURCE: http://www.aahe.org/assessment/principl.htm
  • 11.
    Assessment works bestwhen the programsprograms it seeks to improve have clearclear,, explicitlyexplicitly statedstated purposespurposes. Assessment worksworks bestbest whenwhen it is ongoingongoing not episodic. Assessment requires attention to outcomesattention to outcomes but also and equally to the experiencesexperiences that lead to those outcomes. Assessment is most effectiveeffective when it reflectsreflects an understanding of learningunderstanding of learning as multidimensionalmultidimensional, integratedintegrated, and revealed in performance over timeperformance over time. Assumptions – How Assessment Works Best SOURCE: http://www.aahe.org/assessment/principl.htm
  • 12.
    The Higher LearningCommission (HLC), has identified five fundamental questions for institutions to use in discussing and defining assessment: •How are your stated student learning outcomes appropriate to your mission, programs, and degrees? •What evidence do you have that students achieve your stated learning outcomes? •In what ways do you analyze and use evidence of student learning? •How do you ensure shared responsibility for assessment of student learning? •How do you evaluate and improve the effectiveness of your efforts to assess and improve student learning? http://www.oaklandcc.edu/assessment/Definition.htm QUESTIONS TO CONSIDER
  • 13.
    InstitutionalInstitutional SupportSupport && IntegrationIntegration MISSION & GOALSMISSION& GOALS STUDENTS’ NEEDSSTUDENTS’ NEEDS PROGRAMSPROGRAMS & SERVICES& SERVICES STAFFING & STAFFING & RESOURCES RESOURCES ASSESSMENTASSESSMENT && EVALUATIONEVALUATION Qualitative & Quantitative Summative & Formative Persistence/ Graduation Rates Annual/Quarterly Reports Institutional Research NADE Self-Evaluation Guides Cassazza & Silverman Faculty/Staff Performance Impact/ Effectiveness Demographic/ Use Statistics Case Studies Benchmarking Cost/Benefit Analysis Program Design Outcomes Existing Research Focus Groups Course End Surveys
  • 14.
    Part 1. MISSION Thelearning assistance program must develop, record,develop, record, disseminate, implement and regularly reviewdisseminate, implement and regularly review its mission and goals. The learning assistance mission statement must be consistent with the mission and goals of the institution and with the standards of this document. The mission statement must address the purpose of the learning assistance program, the population it serves, the programs and services it provides, and the goals the program is to accomplish. CAS Standards for Learning CentersCAS Standards for Learning Centers SOURCE - http://www.nade.net/site/documents/CAS/CAS.pdf
  • 15.
    CAS Standards forLearning CentersCAS Standards for Learning Centers Part 4. ORGANIZATION and MANAGEMENT The learning assistance program must be structuredstructured purposefully and managed effectively to achieve statedpurposefully and managed effectively to achieve stated goalsgoals. Evidence of appropriate structure must include current and accessible policies and procedures, written job descriptions and performance expectations for all employees, functional work flow graphics or organizational charts, and service delivery expectations. SOURCE - http://www.nade.net/site/documents/CAS/CAS.pdf
  • 16.
    CAS Standards forLearning CentersCAS Standards for Learning Centers Part 13. ASSESSMENT and EVALUATION The learning assistance program must undergo regular andregular and systematic qualitative and quantitative evaluationssystematic qualitative and quantitative evaluations to determinedetermine to what degree the stated mission and goals aredegree the stated mission and goals are being metbeing met. The learning assistance program should have the ability to collect and analyze datacollect and analyze data through its own resourcesown resources and through access to appropriate data generated by theappropriate data generated by the institutioninstitution. Periodic evaluations of the learning assistance program and services may be performed by on campus experts and outside consultants and disseminated to appropriate administrators. SOURCE - http://www.nade.net/site/documents/CAS/CAS.pdf
  • 17.
    Alexander and Serafass’(1999) planning model for educational institutions. Alexander, W.F., Serfass, R.W. (1999). Futuring Tools for Strategic Quality Planning in Education. Quality Press; Milwaukee.
  • 18.
    The Assessment RealitiesTheAssessment Realities • Annual/Quarterly Reports • Demographic/Usage Statistics • Retention/Completion Rate • Faculty/Staff Performance • Budget/Staffing • Accreditation • Improve Effectiveness & Efficiency • Benchmarking/Standards • Program Design • Align Mission and Goals
  • 19.
    Key Ideas: 1)Assessment is valuable tothe extent that it is considered within the larger context of mission & goals.2)We don’t have to “reinvent the wheel” but we do need to customize it for our contexts. 3) We need to assess in order to engage in “honest advocacy” in revising and improving programs and services, and in recognizing staff performance.
  • 20.
    THE BIG PICTURE Developing An AssessmentPlan Modes of Assessment Tools for Assessment
  • 21.
    A CLOSER LOOK: DEVELOPINGAN ASSESSMENT PLAN How do I assess?
  • 22.
    Developing an AssessmentPlan 1. Articulate the Purpose of Assessment 2. Align With & For Success 3. Select Appropriate Measures/Data-gathering Methods 4. Organize, Analyze & Interpret Results 5. Make Recommendations for Action Casazza & Silverman (1996) Learning Assistance & Development Education: A Guide for Effective Practice
  • 23.
    Purpose of AssessmentPurposeof Assessment • Annual/Quarterly Reports • Demographic/Usage Statistics • Retention/Completion Rate • Faculty/Staff Performance • Budget/Staffing • Accreditation • Improve Effectiveness & Efficiency • Benchmarking/Standards • Program Design • Align Mission and Goals
  • 24.
    Identify Biggest StakeholdersIdentifyBiggest Stakeholders • Annual/Quarterly Reports • Demographic/Usage Statistics • Retention/Completion Rate • Faculty/Staff Performance • Budget/Staffing • Accreditation • Improve Effectiveness & Efficiency • Benchmarking/Standards • Program Design • Align Mission and Goals Student (S)Student (S) Center(C)Center(C) Institution (I)Institution (I) (C)(C) (I)(I) (C)(C) (I)(I) (I)(I) (C)(C) (C)(C) (I)(I) (C)(C) (I)(I) (I)(I) (C)(C) (S)(S) (C)(C) (I)(I) (S)(S) (C)(C)
  • 25.
    PrioritizingPrioritizing AssessmentAssessment • Retention/CompletionRate • Benchmarking/Standards • Program Design • Faculty/Staff Performance • Annual/Quarterly Reports • Demographic/Usage Statistics • Budget/Staffing • Accreditation • Improve Effectiveness & Efficiency • Align Mission and Goals Institution (I)Institution (I) Center (C)Center (C) Center (C)Center (C) Institution (I)Institution (I) Student (S)Student (S) Center (C)Center (C) Student (S)Student (S) Center (C)Center (C) Institution (I)Institution (I) 1st 2nd Make sureMake sure everything lineseverything lines up/realign &up/realign & adjust asadjust as necessarynecessary Get necessary dataGet necessary data to balanceto balance INTERNAL &INTERNAL & EXTERNALEXTERNAL tensions/needstensions/needs Center & InstitutionalCenter & Institutional forces feed eachforces feed each otherother 3rd 4th And all should alignAnd all should align with the work we dowith the work we do in our centers andin our centers and with/for our studentswith/for our students
  • 26.
    Student (S)Student (S)Center (C)Center (C) Institution (I)Institution (I) Institution (I)Institution (I) Center (C)Center (C) Center (C)Center (C) Institution (I)Institution (I)Student (S)Student (S) Center (C)Center (C)
  • 27.
    PrioritizingPrioritizing AssessmentAssessment by Stakeholderby Stakeholder •Retention/Completion Rate • Benchmarking/Standards • Program Design • Faculty/Staff Performance • Annual/Quarterly Reports • Demographic/Usage Statistics • Budget/Staffing • Accreditation • Improve Effectiveness & Efficiency • Align Mission and Goals Institution (I)Institution (I) Center(C)Center(C) Center(C)Center(C) Institution (I)Institution (I) Student (S)Student (S) Center(C)Center(C) Student (S)Student (S) Center(C)Center(C) Institution (I)Institution (I)
  • 28.
    EXAMPLE - Aligningfor Success What does student success “look like” for your institution? Examples: •the student demonstrates knowledge of resources available at the college and the “appropriate” use of those resources. (Institution (I)Institution (I)) •a student that completes the course/certification program/transfer program as desired (Institution (I)Institution (I)) •a student that is able to figure out a way to match their desires and abilities to their goal (Institution (I)Institution (I)) Student (S)Student (S) Center (C)Center (C) Institution (I)Institution (I)
  • 29.
    EXAMPLE - Aligningfor Success What does student success “look like” for your learning center? Examples: •student’s needs were met as evidenced by their questions being answered and the service being satisfactory. (Center (C)Center (C)) •a student who may need significant assistance when first arriving at MC but that need declines as the student progresses through each class and through their program of study. (Center (C)Center (C)) •a student that can demonstrate the ability to obtain knowledge pertaining to a specific class/discipline. (Center (C)Center (C)) •being able to apply knowledge to a novel situation—demonstrating critical thinking skills, being an independent learner and seeker of knowledge. (Center (C)Center (C)) •the student gains proficiency in study skills. (Center (C)Center (C)) •a student that understands the explained material and is able to do similar problems and able to explain the concept to another student. (Center (C)Center (C))
  • 30.
  • 31.
    Easy Tutoring EffectivenessMeasure Purpose: Determine whether a relationship existed between tutoring and student learning. Goals: Minimize the amount of recordkeeping. Obtain meaningful data. Plan: •Focus on the immediate result of tutoring, which was classified in one of two ways: (a) either learning had occurred, or (b) learning had not occurred. •Student learning was operationally defined as being able to do something correctly after working with a tutor the student could not do correctly before working with the tutor. •The demonstration of learning was (a) correctly solving a problem, (b) correctly explaining a concept, or (c) correctly applying a previously unclear or incorrect concept. Source: Holliday, T. (Fall, 2013). Evaluating the Effectiveness of Tutoring: An Easier way . The Learning Assistance Review. National College Learning Center Association.
  • 32.
    Easy Tutoring EffectivenessMeasure Method: To determine whether learning had occurred, a simplified version of a pretest, posttest modality was utilized. •Pre-tutoring Condition: Student doesn’t understand or know how to do something. •Post-tutoring Condition: Either the student does understand or know how to do something or the student does not. Results: The frequency of observations where students could demonstrate understanding after tutoring and the frequency of observations where students could not demonstrate understanding after tutoring were analyzed with a Chi Square goodness of fit test. The results were significant, c2 (1, N = 1756) = 1195.68, p < .0001. Students demonstrated understanding significantly more than not after they received tutoring.
  • 33.
    Easy Tutoring EffectivenessMeasure • Results: Results were also significant when analyzed by Tutor and by Course. Effective Tutoring Outcomes by Tutor Tutor Yes No c2 p Tutor 1 279 105 77.94 <.0001 Tutor 2 844 33 748.12 <.0001 Tutor 3 343 1 338.02 <.0001 Tutor 4 55 5 40.2 <.0001 Tutor 5 248 28 173.78 <.0001
  • 34.
    Key Ideas: 1) Use these definitionsof success or create your own. 2) Check the chosen definitions with stakeholders and rework as needed to ensure alignment with mission/goals. 3) Let the definitions of success guide what and how you measure.
  • 35.
    A CLOSER LOOK:MODES OF ASSESSMENT How do I assess?
  • 36.
    Modes of Assessment –QuantitativeMethods: • Demographics/usage data • Survey/Evaluative data • Statistical impact data –Qualitative Methods: • Case studies • Interviews/Focus groups • Written observations
  • 37.
    Demographic/Usage Data • Whichstudents use your Center/Tutoring? – Categories of interest (major, special populations, ethnicity, age, GPA) – Tip: Are the demographics of your Center representative of your College/Mission? Look at who isn’t using your Center and see how they can be reached. • Why do they use your Center? • How often do they use your Center? – Repeat business – Contact hours
  • 38.
  • 39.
    DEMOGRAPHICSDEMOGRAPHICS Purpose : Whois using the center and for what classes Method : Survey Monkey Results : Used to plan tutor schedule and allocate resources.
  • 40.
    Spring 2006 Fall 2006 Spring 2007 Fall2007 Total Logins 7800 7638 7883 7902 Total Number of Unique Students 790 846 750 774 Total Number of Unique Students for Tutoring 265 277 286 290 DEMOGRAPHICSDEMOGRAPHICS Purpose : How many students visit the Center and for how many times. Method : Access Database done when students sign in to use the Center. Results : Used to show busyness and repeat data. 0 50 100 150 200 250 300 350 1to2Visits 3to5 6to10 11to15 16+ Spring 2006 Fall2006 Spring 2007 Fall2007
  • 41.
    DEMOGRAPHICSDEMOGRAPHICS Purpose : Categorizeindividual appointments – how, content and # of students Method : Excel database completed by staff after appointment. Results : Used for annual report and to allocate resources.
  • 42.
    DEMOGRAPHICSDEMOGRAPHICS Purpose : CapturesPeer Coaching Program usage - content and # of students Method : Excel database completed by Peer Coaching Program Coordinator. Results : Used for CRLA hours of tutoring and annual report.
  • 43.
    Modes of Assessment –QuantitativeMethods: • Demographics/usage data • Survey/Evaluative data • Statistical impact data –Qualitative Methods: • Case studies • Interviews/Focus groups • Written observations
  • 44.
    Survey DataSurvey Data •What feedback do you get about your Center/Tutoring? – Categories of interest (programs, services, location, hours. Etc.) • How effective are your services and programs? – Self-reports & evaluation – “Customer” satisfaction – Product/Service review/improvements
  • 45.
  • 46.
    SURVEY DATASURVEY DATA Purpose: Used as checklist for what I want tutors to do. Making tutor behavior observable. Method : Survey Monkey. Online access 24/7. Survey “push” 2x per semester. Results : Used for report and to identify areas for improvement through training/coaching staff. Category Spring 2011 SLC was well organized: 4.73 The hours were sufficient: 4.56 Tutors knew material well: 4.7 Tutors used various materials: 4.7 Tutors showed care and respect: 4.75 Tutors presented materials in an understandable manner: 4.78 Student would recommend the SLC to others: 4.83
  • 47.
    SURVEY DATASURVEY DATA Purpose: Used as checklist for student success behaviors and to assess those desired outcomes. Method : Survey Monkey. Online access 24/7. Survey “push” 2x per semester. Results : Used for report and to identify areas for improving service. Service was satisfactory: 4.69 Student’s questions were answered: 4.67 Student’s skills improved: 4.6 Student could demonstrate improvement by doing problems: 4.59 Student could demonstrate improvement by explaining: 4.55 Student could demonstrate improvement applying to different situations: 4.66 Student learned to become a more independent learner: 4.38 Student gained confidence: 4.64 Student received better grade: 4.67
  • 48.
    SURVEY DATASURVEY DATA Purpose: Used to assess how students are using a tool. In this case a resource/date book. Method : Survey Monkey. Results : Used to assess implementation success and to plan for future viability.
  • 49.
    Modes of Assessment –QuantitativeMethods: • Demographics/usage data • Survey/Evaluative data • Statistical impact data –Qualitative Methods: • Case studies • Interviews/Focus groups • Written observations
  • 50.
    Basic Statistics • Correlations(directional relationship between two variables) • T-tests (difference between two groups) • ANOVAS (difference among three or more groups) • Chi Squares (difference between two groups with one group being a category)
  • 51.
    Statistical Impact Data •Retention Data • GPA • Scores Between Groups (follow-up with statistical test) • Pre-test/Post-test on exams • Tips: – Correlation is not causation. – Get follow-up data from students who did not come back. – Be careful with other variables.
  • 52.
  • 53.
    • 76 studentsparticipating in a tutoring program for at risk students were retained (66%). These students used tutoring services more than those not students who were not retained (t =5.27 p <.001). Students with higher high school GPAs were more likely to use tutoring (r =.198, p =.040) Source: Laskey, M. L., & Hetzel, C. J. (Spring, 2011). Investigating factors related to retention of at-risk college students. The Learning Assistance Review 16(1), 31-43. Statistical ImpactStatistical Impact Purpose : To determine retention rate based on tutoring. Method : Used institutional research data to determine correlation and get data for t-test. Results : Used in report and publication.
  • 54.
    Intro to BioIntro to Bio Intro to Bio Intro to Bio paired with Study Skills 67.3 62.9 59.75 70.4 Statistical ImpactStatistical Impact Purpose : To determine whether including study skills training with a course was effective. Method : Mean exam scores calculated. Difference among groups. ANOVA for more in-depth. Results : Used for deciding whether the do again. Used to market the study skills.
  • 55.
    RS101: Student SuccessCourse  Performance Better than Predicted (based upon CEER scores) - RS101 cadets outperform predicted APS by approx 0.1 on 4.0 scale - Non-RS101 cadets under perform predicted APS by approx. 0.05 (p=.0001)  Small but Statistically Significant Positive Effect on Graduation Rates  Increased Confidence in Ability to Apply Good Learner/Study Strategies - Class ’04 Pre/Post SBI Scores show increased confidence in routine academic tasks (p=.002) Statistical ImpactStatistical Impact Purpose : To determine effectiveness of student success course. Method : Difference between groups. Pre/post test. Results : Used in report, publication, and for marketing the course.
  • 56.
    0 100 200 300 400 500 600 700 800 900 99-00 00-01 01-0202-03 03-04 282 278 277 250 270 745 729 761 874 737 90 88 88 89 8991 87 86 82 86 PreWPM PostWPM PreComp PostComp Statistical ImpactStatistical Impact Purpose : To determine effectiveness of student success course. Method : Pre/post test. Results : Used in report, publication, and for marketing the course. RS102 Reading Efficiency •Average reading gain 497 wpm • Comprehension constant @ 88%
  • 57.
    Modes of Assessment –Quantitative Methods: • Demographics/usage data • Survey/Evaluative data • Statistical impact – Qualitative Methods: • Case studies • Interviews/Focus groups • Written observations
  • 58.
  • 59.
    Case study andwritten observations.Case study and written observations. Source: Lisa D’Adamo-Weinstein, Ph.D., Language Education, Indiana University-Bloomington, 2001. Thesis: Kaleidoscope Tapestries: Weaving Patterns from First-Generation College Women's Telling-Stories
  • 60.
    Study method Upper levelnursing students served as peer tutors for lower level nursing students. The peer tutors received tutor training and guidelines for the sessions. One-to-one tutoring sessions took place weekly for 10 weeks. Focus groups and individual interviews at the middle and end of the semester were used to gather information about the students’ experiences. • Results The responses to focus groups and interview questions were analyzed. Positive and negative experiences were categorized. Positive experiences included enhancement of learning skills and personal growth. Negative experiences were primarily attributed to frustration about time commitments and mismatched learning styles. • Conclusions Both tutors and tutees benefited to some extent from this peer-tutoring process. The process would be enhanced in future if the frustrations experienced by some could be addressed. Source: Chow, Filomena L.W., and Alice J.T. Yuen Loke. "Learning partnership -- the experience of peer tutoring among nursing students: A qualitative study." International Journal of Nursing Studies 44.2 (2007): 237+. Academic OneFile. Web. 26 Mar. 2012. Focus groups and individual interviews.Focus groups and individual interviews.
  • 61.
    Key Ideas: 1) Use avariety of modes. 2) Educate decision-makers about why you’re measuring what you’re measuring and not something else.
  • 62.
  • 63.
    A CLOSER LOOK:TOOLS FOR ASSESSMENT How do I assess?
  • 65.
    MatchingMatching PurposePurpose with Toolswith Tools forfor AssessmentAssessment •Retention/Completion Rate • Benchmarking/Standards Institution (I)Institution (I) PURPOSE – My Dean wants retention data of students who utilize our tutoring center and she wants to know how our students measure up in comparison with sister schools. Data Gathering Methods: •Institutional Research for graduation and retention statistics •Internal database of student use of center - graduation and persistence data •Statistical tools – descriptive statistics For more ideas and info: -Listserv query -https://www.noellevitz.com/ - other sources of benchmarking data
  • 66.
    • Program Design •Faculty/Staff Performance PURPOSE – To ensure that programs and staff are performing in alignment with goals. Data Gathering Methods: •Surveys •Statistical tools -Tutor Effectiveness Measure -Chi Square, t-test, ANOVA, correlation •Qualitative Methods -360 Feedback -Focus groups, interviews, including open- ended questions on survey. Center(C)Center(C) For more ideas and info: -Journal articles on programs -List serv query for design -other sources of benchmarking data -http://svy.mk/Hygmcx
  • 67.
    Tools for “HomeGrown” UseTools for “Home Grown” Use • Databases – Microsoft Products – Excel & Access – Apple – Numbers • Surveys & Evaluation Forms – Survey Monkey – Google Forms • Statistical tests – http://quantpsy.org/calc.htm – http://www.graphpad.com/quickcalcs/index.cfm
  • 68.
  • 69.
    Where Do WeGo From Here?Where Do We Go From Here? • Continue the WOW experience in the online workshop: – http://nclcawows.pbworks.com
  • 70.
    Let NCLCA addsome W.O.W.W.O.W. to your work day… The purpose of the WOW series is to support learning center professionals as they develop and maintain learning centers, programs, and services to enhance student learning. The series gives learning assistance professionals a chance to participate both synchronously (synchronously (webinarwebinar) and asynchronously () and asynchronously (online workshoponline workshop)) in a relatively inexpensive and high quality professional development experience. Introducing a new interactive professional development experience that allows you to interact from the comfort of your own office or home computer… SESSION #2 Coming Soon in June/July Curriculum Design & Program Development Call for proposals coming out May1stCall for proposals coming out May1st . WEBINAR & ONLINE WORKSHOP SERIES (WOWS)WEBINAR & ONLINE WORKSHOP SERIES (WOWS)

Editor's Notes

  • #2 Introduce ourselves -
  • #6 lisa
  • #7 Tacy
  • #9 Tacy
  • #10 Tacy
  • #11 Tacy
  • #12 Tacy
  • #13 Tacy
  • #14 Lisa
  • #15 Lisa…split into 3 sep slides.
  • #16 Lisa…split into 3 sep slides.
  • #17 Lisa…split into 3 sep slides.
  • #18 Lisa…If you don’t have these things, you can still do assessment in smaller parts This might be a way to grow in your capacity to evaluate. “Beyond the antidote”
  • #19 Tacy--Despite the challenges, why do we do it? Learning center administrators and other advocates of learning assistance in higher education must be able to demonstrate positive outcomes to support favorable resource allocation decisions prompted by dwindling budgets, to use resources more effectively, and most importantly to help assure that we are fulfilling our mission as a learning center, or as a tutoring program, etc..
  • #20 Tacy
  • #21 Lisa
  • #22 Lisa
  • #24 Lisa
  • #25 Lisa
  • #26 Tacy &amp; Lisa
  • #27 Another way of picturing the interaction – T&amp;L
  • #28 Lisa-
  • #29 Tacy…how we did alignment for success…These may be different depending on your institutions’ mission/vision.
  • #30 Tacy…how we did alignment for success…These may be different depending on your institutions’ mission/vision.
  • #31 Tacy
  • #32 Tacy
  • #33 Tacy
  • #34 Tacy
  • #36 Lisa
  • #37 Lisa
  • #38 Tacy
  • #39 Tacy
  • #40 Tacy
  • #41 tacy
  • #42 Lisa
  • #43 Lisa
  • #44 Lisa
  • #45 Lisa
  • #46 Tacy
  • #47 Tacy
  • #48 Tacy
  • #49 lisa
  • #50 Tacy
  • #51 Tacy We’ll provide a link to learn more about specific tests in the online workshop…
  • #53 Tacy
  • #54 Tacy
  • #55 tacy
  • #56 Lisa
  • #57 Lisa
  • #58 Lisa
  • #59 Tacy
  • #60 Lisa
  • #61 tacy
  • #62 Lisa
  • #64 tacy
  • #66 Tacy - Scenario Example
  • #67 Lisa Scenario Example
  • #68 Lisa
  • #70 Lisa Put a graphic here Will post recording We both talk it through and go live?? If time???