The document discusses how poverty is measured in the Philippines. It provides details on:
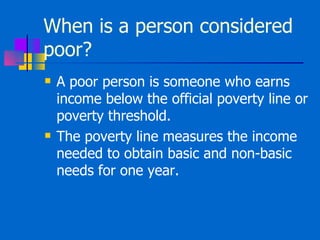
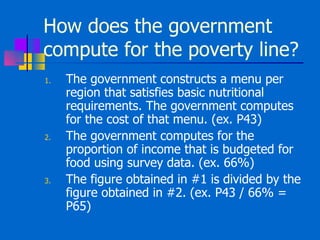
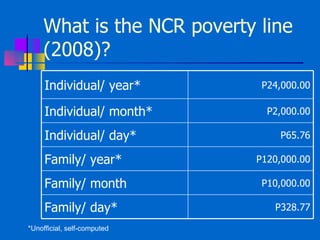
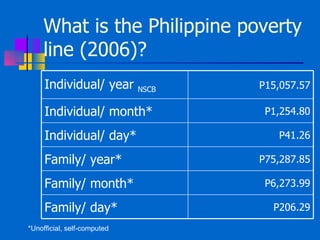
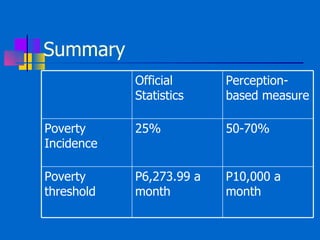
1) The official poverty line used by the Philippine government to determine if a person is considered poor based on their income.
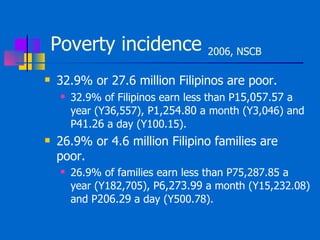
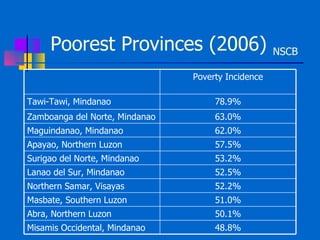
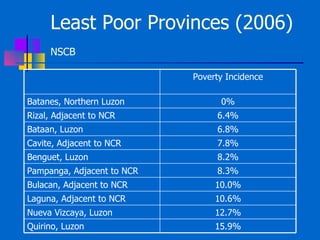
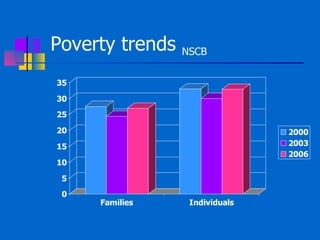
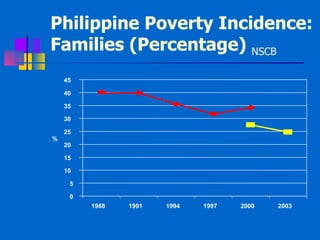
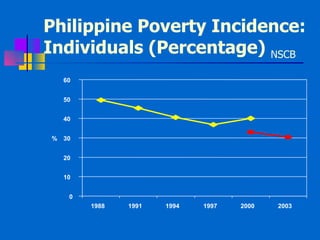
2) Poverty incidence statistics from 2006 that show approximately 32.9% of Filipinos were living below the poverty line.
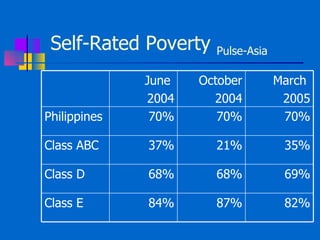
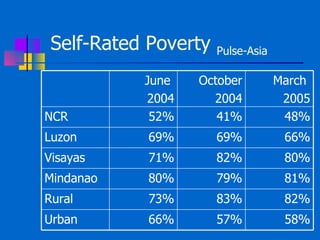
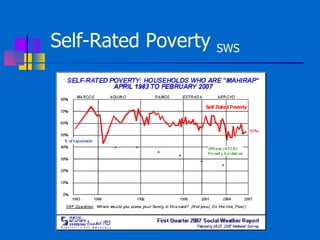
3) Perception-based measures from surveys that indicate a higher percentage of Filipinos self-rate as poor compared to official statistics.