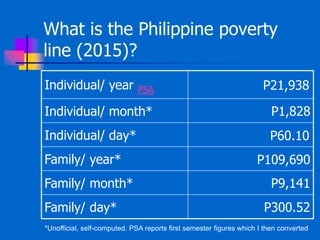
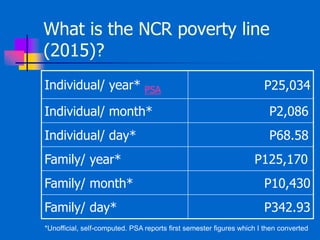
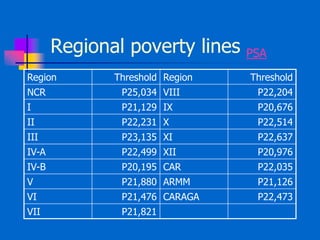
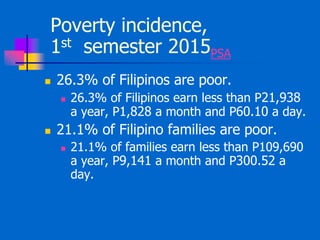
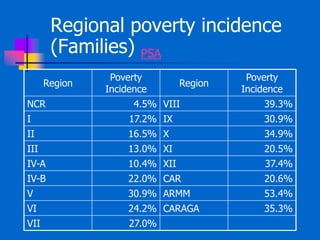
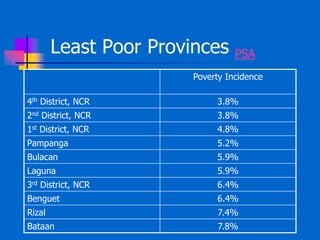
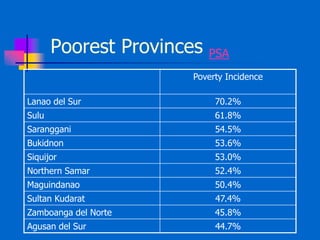
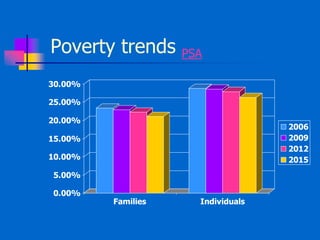
Philippine Poverty
First Semester, 2015
Leland Joseph R. Dela Cruz
Development Studies Program
School of Social Sciences
Ateneo de Manila University
When is a person considered
poor? PSA
The poverty threshold “refers to the minimum
income/expenditure required for a family/individual to
meet the basic food and non-food requirements”.
How does the government
compute for the poverty line?
1. The government constructs a menu per
region that satisfies basic nutritional
requirements. The government computes
for the cost of that menu. (ex. P42)
2. The government computes for the
proportion of total basic expenditures that is
budgeted for food using survey data. (ex.
69%)
3. The figure obtained in #1 is divided by the
figure obtained in #2. (ex. P38 / 69% ~
P61) PSA
What is the Philippine poverty
line (2015)?
Family/ day*
P9,141Family/ month*
Family/ year*
Individual/ day*
Individual/ month*
Individual/ year PSA
*Unofficial, self-computed. PSA reports first semester figures which I then converted
P109,690
P300.52
P21,938
P1,828
P60.10
What is the NCR poverty line
(2015)?
Family/ day*
Family/ month*
Family/ year*
Individual/ day*
Individual/ month*
Individual/ year* PSA
*Unofficial, self-computed. PSA reports first semester figures which I then converted
P25,034
P2,086
P68.58
P125,170
P10,430
P342.93
Regional poverty lines PSA
Region Threshold Region Threshold
NCR P25,034 VIII P22,204
I P21,129 IX P20,676
II P22,231 X P22,514
III P23,135 XI P22,637
IV-A P22,499 XII P20,976
IV-B P20,195 CAR P22,035
V P21,880 ARMM P21,126
VI P21,476 CARAGA P22,473
VII P21,821
Poverty incidence,
1st semester 2015PSA
 26.3% of Filipinos are poor.
 26.3% of Filipinos earn less than P21,938
a year, P1,828 a month and P60.10 a day.
 21.1% of Filipino families are poor.
 21.1% of families earn less than P109,690
a year, P9,141 a month and P300.52 a
day.
Regional poverty incidence
(Families) PSA
Region
Poverty
Incidence
Region
Poverty
Incidence
NCR 4.5% VIII 39.3%
I 17.2% IX 30.9%
II 16.5% X 34.9%
III 13.0% XI 20.5%
IV-A 10.4% XII 37.4%
IV-B 22.0% CAR 20.6%
V 30.9% ARMM 53.4%
VI 24.2% CARAGA 35.3%
VII 27.0%
Least Poor Provinces PSA
Poverty Incidence
4th District, NCR 3.8%
2nd District, NCR 3.8%
1st District, NCR 4.8%
Pampanga 5.2%
Bulacan 5.9%
Laguna 5.9%
3rd District, NCR 6.4%
Benguet 6.4%
Rizal 7.4%
Bataan 7.8%
Poorest Provinces PSA
Poverty Incidence
Lanao del Sur 70.2%
Sulu 61.8%
Saranggani 54.5%
Bukidnon 53.6%
Siquijor 53.0%
Northern Samar 52.4%
Maguindanao 50.4%
Sultan Kudarat 47.4%
Zamboanga del Norte 45.8%
Agusan del Sur 44.7%
Poverty trends PSA
0.00%
5.00%
10.00%
15.00%
20.00%
25.00%
30.00%
Families Individuals
2006
2009
2012
2015
Philippine Poverty
First Semester, 2015
Leland Joseph R. Dela Cruz
Development Studies Program
School of Social Sciences
Ateneo de Manila University

Philippine Poverty Situationer: First Semester 2015

  • 1.
    Philippine Poverty First Semester,2015 Leland Joseph R. Dela Cruz Development Studies Program School of Social Sciences Ateneo de Manila University
  • 2.
    When is aperson considered poor? PSA The poverty threshold “refers to the minimum income/expenditure required for a family/individual to meet the basic food and non-food requirements”.
  • 3.
    How does thegovernment compute for the poverty line? 1. The government constructs a menu per region that satisfies basic nutritional requirements. The government computes for the cost of that menu. (ex. P42) 2. The government computes for the proportion of total basic expenditures that is budgeted for food using survey data. (ex. 69%) 3. The figure obtained in #1 is divided by the figure obtained in #2. (ex. P38 / 69% ~ P61) PSA
  • 4.
    What is thePhilippine poverty line (2015)? Family/ day* P9,141Family/ month* Family/ year* Individual/ day* Individual/ month* Individual/ year PSA *Unofficial, self-computed. PSA reports first semester figures which I then converted P109,690 P300.52 P21,938 P1,828 P60.10
  • 5.
    What is theNCR poverty line (2015)? Family/ day* Family/ month* Family/ year* Individual/ day* Individual/ month* Individual/ year* PSA *Unofficial, self-computed. PSA reports first semester figures which I then converted P25,034 P2,086 P68.58 P125,170 P10,430 P342.93
  • 6.
    Regional poverty linesPSA Region Threshold Region Threshold NCR P25,034 VIII P22,204 I P21,129 IX P20,676 II P22,231 X P22,514 III P23,135 XI P22,637 IV-A P22,499 XII P20,976 IV-B P20,195 CAR P22,035 V P21,880 ARMM P21,126 VI P21,476 CARAGA P22,473 VII P21,821
  • 7.
    Poverty incidence, 1st semester2015PSA  26.3% of Filipinos are poor.  26.3% of Filipinos earn less than P21,938 a year, P1,828 a month and P60.10 a day.  21.1% of Filipino families are poor.  21.1% of families earn less than P109,690 a year, P9,141 a month and P300.52 a day.
  • 8.
    Regional poverty incidence (Families)PSA Region Poverty Incidence Region Poverty Incidence NCR 4.5% VIII 39.3% I 17.2% IX 30.9% II 16.5% X 34.9% III 13.0% XI 20.5% IV-A 10.4% XII 37.4% IV-B 22.0% CAR 20.6% V 30.9% ARMM 53.4% VI 24.2% CARAGA 35.3% VII 27.0%
  • 9.
    Least Poor ProvincesPSA Poverty Incidence 4th District, NCR 3.8% 2nd District, NCR 3.8% 1st District, NCR 4.8% Pampanga 5.2% Bulacan 5.9% Laguna 5.9% 3rd District, NCR 6.4% Benguet 6.4% Rizal 7.4% Bataan 7.8%
  • 10.
    Poorest Provinces PSA PovertyIncidence Lanao del Sur 70.2% Sulu 61.8% Saranggani 54.5% Bukidnon 53.6% Siquijor 53.0% Northern Samar 52.4% Maguindanao 50.4% Sultan Kudarat 47.4% Zamboanga del Norte 45.8% Agusan del Sur 44.7%
  • 11.
  • 12.
    Philippine Poverty First Semester,2015 Leland Joseph R. Dela Cruz Development Studies Program School of Social Sciences Ateneo de Manila University