Downloaded 189 times

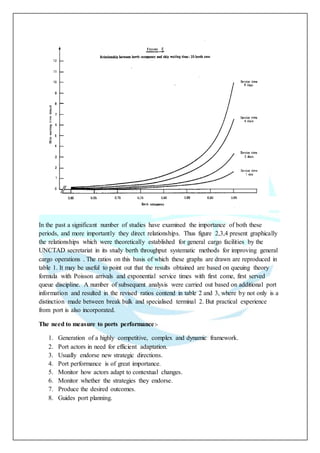

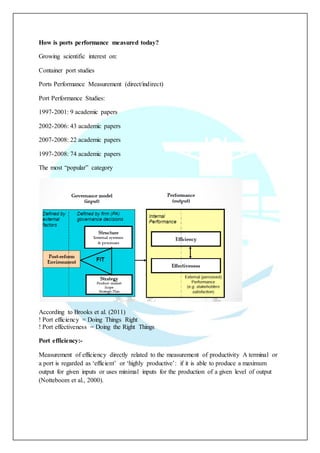
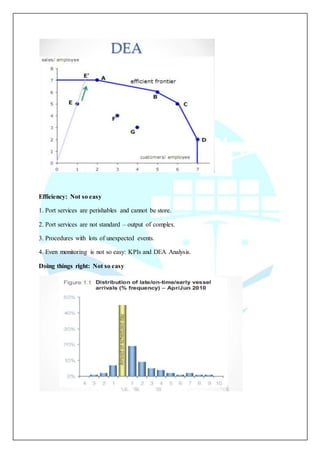
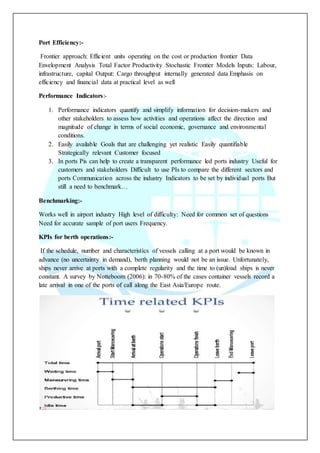
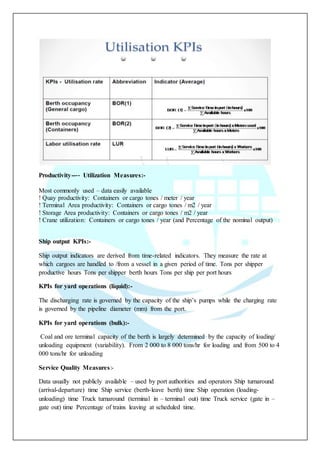
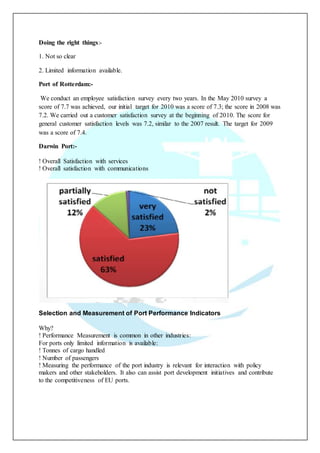
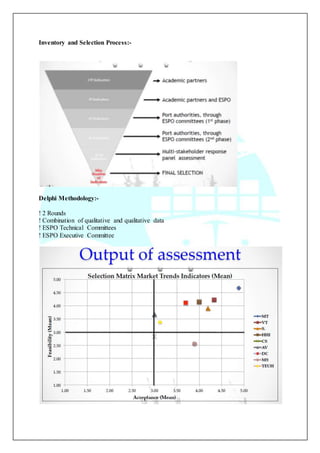
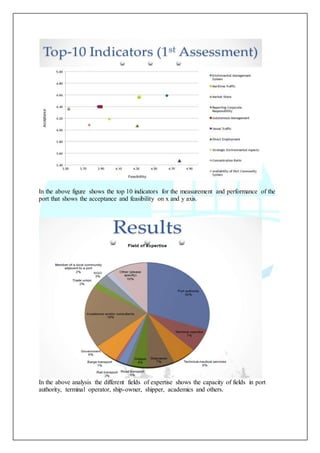
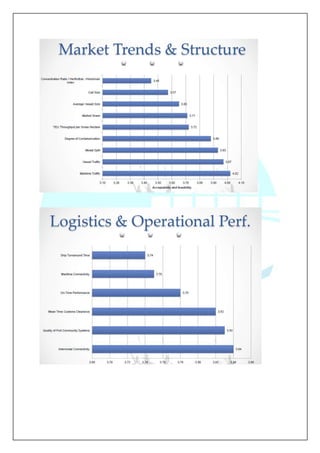

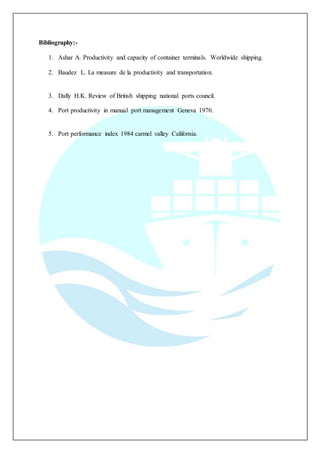

The document discusses measuring and evaluating the performance and productivity of ports. It examines various factors that make analyzing port performance challenging, such as the large number of parameters involved, lack of reliable data, and local factors influencing results. The document focuses on defining common methodologies for measuring performance, specifically analyzing the duration of ships' stays in ports and the quality of cargo handling. It explores various key performance indicators used to evaluate efficiency related to issues like quay productivity, crane utilization, and ship turnaround times. The conclusion emphasizes the importance of developing a culture of performance measurement in ports using agreed-upon indicators to understand system performance and support decision-making.


