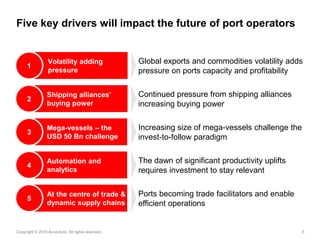
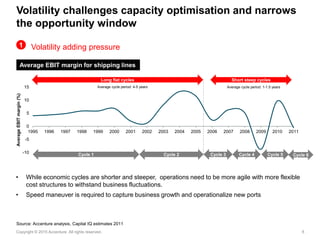
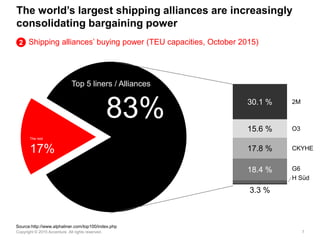
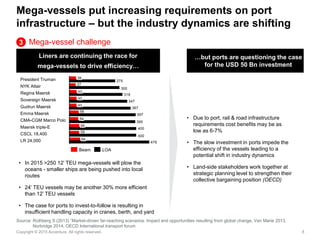
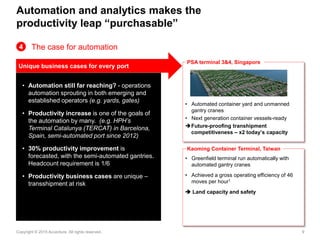
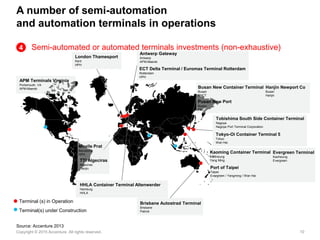
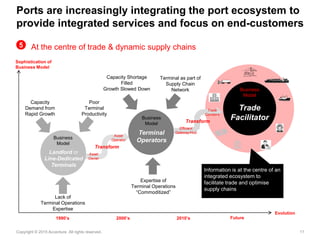
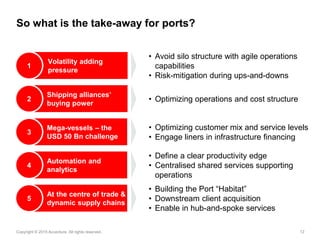
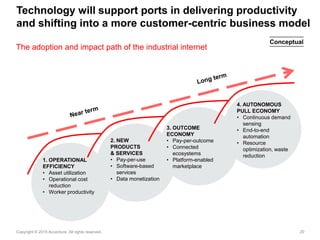
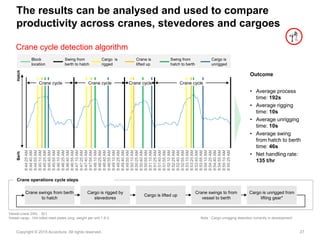
November 2015
Driving port productivity
and value proposition
leveraging technology
About me
Robert Jessing
Maritime & logistics, Accenture Strategy
Based in Accenture’s Strategy practice in Singapore.
Driving strategy at the intersection of business,
operations, and technology. Experience from
transportation and industrial equipment sectors in
Scandinavia and Southeast Asia
MSc. in Industrial engineering and management from
Chalmers University of Technology and a B. in
Financial economics from Gothenburg University
3Copyright © 2015 Accenture All rights reserved.
End Customers
Accenture works with port’s upstream and downstream
players, and understands the whole port eco-system
Port ServicesShipping Lines and Logistics
Port Community and Trade Platform
4
Agenda
Key drivers impacting the future of port operators
Port value proposition redefined
Leveraging emerging technology in port operations
5Copyright © 2015 Accenture All rights reserved.
Five key drivers will impact the future of port operators
Global exports and commodities volatility adds
pressure on ports capacity and profitability
Continued pressure from shipping alliances
increasing buying power
Increasing size of mega-vessels challenge the
invest-to-follow paradigm
The dawn of significant productivity uplifts
requires investment to stay relevant
Ports becoming trade facilitators and enable
efficient operations
Volatility adding
pressure
1
Shipping alliances’
buying power
2
Mega-vessels – the
USD 50 Bn challenge
3
Automation and
analytics
4
At the centre of trade &
dynamic supply chains
5
6Copyright © 2015 Accenture All rights reserved.
Volatility adding pressure
Volatility challenges capacity optimisation and narrows
the opportunity window
• While economic cycles are shorter and steeper, operations need to be more agile with more flexible
cost structures to withstand business fluctuations.
• Speed maneuver is required to capture business growth and operationalize new ports
1
-10
-5
0
5
10
15
1995 1996 1997 1998 1999 2000 2001 2002 2003 2004 2005 2006 2007 2008 2009 2010 2011
AverageEBITmargin(%)
Average cycle period: 4-5 years Average cycle period: 1-1.5 years
Cycle 1 Cycle 2 Cycle 3 Cycle 4 Cycle 5
Source: Accenture analysis, Capital IQ estimates 2011
Cycle 6
Short steep cyclesLong flat cycles
Average EBIT margin for shipping lines
7Copyright © 2015 Accenture All rights reserved.
The world’s largest shipping alliances are increasingly
consolidating bargaining power
Shipping alliances’ buying power (TEU capacities, October 2015)
Top 5 liners / Alliances
83%
The rest
17%
Source:http://www.alphaliner.com/top100/index.php
CKYHE17.8 %
30.1 %
O3
H Süd
G6
2M
18.4 %
3.3 %
15.6 %
2
8Copyright © 2015 Accenture All rights reserved.
Mega-vessels put increasing requirements on port
infrastructure – but the industry dynamics are shifting
• Due to port, rail & road infrastructure
requirements cost benefits may be as
low as 6-7%
• The slow investment in ports impede the
efficiency of the vessels leading to a
potential shift in industry dynamics
• Land-side stakeholders work together at
strategic planning level to strengthen their
collective bargaining position (OECD)
Liners are continuing the race for
mega-vessels to drive efficiency…
…but ports are questioning the case
for the USD 50 Bn investment
Mega-vessel challenge3
59
56
37
479
400
400
395
397
367
347
318
300
275
39
Sovereign Maersk
NYK Altair
President Truman
43
Regina Maersk 43
54
64
Emma Maersk
Gudrun Maersk 43
CSCL 18,400
Maersk triple-E 59
LR 24,000
CMA-CGM Marco Polo
Beam LOA
Source: Rothberg S (2013) “Market-driven far-reaching scenarios: Impact and opportunities resulting from global change, Van Marie 2013,
Norbridge 2014, OECD International transport forum
• In 2015 >250 12’ TEU mega-vessels will plow the
oceans - smaller ships are being pushed into local
routes
• 24’ TEU vessels may be another 30% more efficient
than 12’ TEU vessels
• The case for ports to invest-to-follow is resulting in
insufficient handling capacity in cranes, berth, and yard
9Copyright © 2015 Accenture All rights reserved.
Automation and analytics makes the
productivity leap “purchasable”
The case for automation
• Automation still far reaching? - operations
automation sprouting in both emerging and
established operators (e.g. yards, gates)
• Productivity increase is one of the goals of
the automation by many. (e.g. HPH’s
Terminal Catalunya (TERCAT) in Barcelona,
Spain, semi-automated port since 2012)
• 30% productivity improvement is
forecasted, with the semi-automated gantries.
Headcount requirement is 1/6
• Productivity business cases are unique –
transshipment at risk
• Automated container yard and unmanned
gantry cranes
• Next generation container vessels-ready
Future-proofing transhipment
competitiveness – x2 today’s capacity
PSA terminal 3&4, Singapore
• Greenfield terminal run automatically with
automated gantry cranes
• Achieved a gross operating efficiency of 46
moves per hour1
 Land capacity and safety
Kaoming Container Terminal, Taiwan
Unique business cases for every port
4
10Copyright © 2015 Accenture All rights reserved.
A number of semi-automation
and automation terminals in operations
Semi-automated or automated terminals investments (non-exhaustive)
Source: Accenture 2013
Kaoming Container Terminal
Kaohsiung
Yang Ming
Tobishima South Side Container Terminal
Nagoya
Nagoya Port Terminal Corporation
Antwerp Gateway
Antwerp
APM-Maersk
ECT Delta Terminal / Euromax Terminal Rotterdam
Rotterdam
HPH
London Thamesport
Kent
HPH
HHLA Container Terminal Altenwerder
Hamburg
HHLA
Brisbane Autostrad Terminal
Brisbane
Patrick
Busan New Container Terminal
Busan
BNCT
Hanjin Newport Co
Busan
Hanjin
Evergreen Terminal
Kaohsiung
Evergreen
Pusan New Port
Busan
PNC
Port of Taipei
Taipei
Evergreen / Yangming / Wan Hai
Tokyo-Oi Container Terminal 5
Tokyo
Wan Hai
Terminal (s) in Operation
Terminal(s) under Construction
TTI Algeciras
Algeciras
Hanjin
Muelle Prat
Barcelona
HPH
APM Terminals Virginia
Portsmouth, VA
APM-Maersk
4
11Copyright © 2015 Accenture All rights reserved.
Ports are increasingly integrating the port ecosystem to
provide integrated services and focus on end-customers
Lack of
Terminal Operations
Expertise
Poor
Terminal
Productivity
Landlord or
Line-Dedicated
Terminals
Business
Model
Capacity Shortage
Filled
Growth Slowed Down
Expertise of
Terminal Operations
“Commoditized”
Transform
Capacity
Demand from
Rapid Growth
Terminal as part of
Supply Chain
Network
Trade
Facilitator
Business
Model
Terminal
Operators
Business
Model
Evolution
Sophistication of
Business Model
1990’s 2000’s Future
Trade
Corridors
2010’s
Asset
Operator
Asset
Owner
Efficient
Gateway/Hub
Transform
At the centre of trade & dynamic supply chains
Information is at the centre of an
integrated ecosystem to
facilitate trade and optimise
supply chains
5
12Copyright © 2015 Accenture All rights reserved.
So what is the take-away for ports?
• Avoid silo structure with agile operations
capabilities
• Risk-mitigation during ups-and-downs
• Optimizing operations and cost structure
• Optimizing customer mix and service levels
• Engage liners in infrastructure financing
• Define a clear productivity edge
• Centralised shared services supporting
operations
• Building the Port “Habitat”
• Downstream client acquisition
• Enable in hub-and-spoke services
Volatility adding
pressure
1
Shipping alliances’
buying power
2
Mega-vessels – the
USD 50 Bn challenge
3
Automation and
analytics
4
At the centre of trade &
dynamic supply chains
5
13
Key drivers impacting the future of port operators
Port value proposition redefined
Leveraging emerging technology in port operations
Agenda
14Copyright © 2015 Accenture All rights reserved.
Our high performance port Study shows how the leading
ports are targeting the next generation value proposition
Value proposition of High-performance ports
Source: Accenture: Achieving High Performance in Ports: 2013
Market
focus
& position
Distinctive
Capabilities
Performance
Anatomy
1. Customer centricity
• Focus on service integration and customer stickiness
• Active participation in logistics eco-system to extend scope or alliance to serve direct customers
(shipping lines) to end customers (shippers)
• Focus on profitability by optimizing customer mix and service levels
5. Process and IT standardization
• Lessen the reliance on captive skills to solve shortage and immobility of talent
• Improve replicability as new businesses buildup or across ports at different locations
• Use of standardized platform for ease and speed to replicate
• Build Shared Services to enforce standardization across multiple ports
2. Productivity standard
• Stay relevant to the significant
uplift of productivity standard
• Consider using automation to
quickly meet the productivity
benchmarks
• Unleash the power of port
network
3. Operational agility
• Sustainable agility and
flexible cost structure to
withstand business cycles
• Avoid silo organization amd
build in flexible cost
• Multiple ports providing
complementary services
4. Business scalability
• Speed to scale to capture
new business demand
• Leverage economy-of-scale
of external providers
• Position as “preferred port
brand” through unique value
proposition across ports
15Copyright © 2015 Accenture All rights reserved.
The value proposition needs to be supported by strong
operations capabilities including analytics
Priority capabilities to drive productivity
• Central balancing of vessel call/arrival versus available berth,
equipment, stevedore and yard
• Ability to drive workforce and asset flexibility
• Better enforcement of requirements on productivity, safety,
security and quality across port stakeholders
• Automated decision-support from analytics tools
Integrated Planning and
Command Centre
• Data-driven insights and metrics into processes to identify
improvement areas
• Leverage modelling to optimise and drive productivity
• Structure for continuous improvement with infusion of data-
driven insights in day-to-day operations
Operations
analytics
Priority capabilities Description
16Copyright © 2015 Accenture All rights reserved.
The analytics team is developing from reporting to an
capability resource optimisation and forecasting
Analytics role in port operations
Typical operations
practices
Operations analytics
capability
 Limited and high level performance
metrics
 Lack of data on quayside operations
and gang planning
 Limited time and capacity for analysis
among Operations managers
 Limited modelling capabilities
 Projects run as ad-hoc analysis often
with external support
 Regular performance reporting on
stevedore and ship level
 Increasing availability of process
performance data
 Insight generation and trend
analysis
 Dedicated team for deep dive
analysis (e.g. crane ratio, gang
deployment)
 Addition of analytical skillset
 Ability to leverage modelling for
optimisation and forecasting
(e.g. long term demand drivers,
yard allocation optimisation)
 Ecosystem optimisation
 Continuous improvement
Ad-hoc insight
generation
2
Focused projects
leveraging
modelling
3
KPI and process
performance tracking
1
2. Ad-hoc insight
generation
Ad-hoc insight
generation
2
Focused projects
leveraging
modelling
3
KPI and process
performance tracking1
1. KPI and process
performance tracking
Ad-hoc insight
generation
2
Focused projects
lev. modelling3
KPI and process
performance tracking
1
3. Focused projects
leveraging modelling
17Copyright © 2015 Accenture All rights reserved.
..and information will also play an instrumental role to
enable efficient operations and trade facilitation
Information as the enabler for differentiation
Automation
Enablement
Integration/ Execution of
Carrier/Alliance’s Processes
Integration with Port
Community
Smart Port
Regional Operations
Center
Analytics and Predictive
Scheduling
International Trade
Platform
Door to Door
Customer
Experience
Supply Chain
Financing
Global Port
Network
Logistics e-
Marketplace
Asset
Operator
Efficient
Gateway/Hub
Efficient
Gateway/Hub
Trade
Corridor
Trade
Facilitator
Terminal
Operators
Foundation
Industry-grade,
Robust TOS
18
Key drivers impacting the future of port operators
Port value proposition redefined
Leveraging emerging technology in port operations
Agenda
19Copyright © 2015 Accenture All rights reserved.
Our Industrial Tech trends survey shows the four key
opportunities of emerging technology
Opportunities of emerging technology
Source: Accenture: Tech trends in transportation & industrial equipment (2015)
221 industrial equipment executives
across 9 countries: Australia, Brazil,
China, France, Germany, India, South
Africa, UK & US
Workforce Reimagined
Platform (R)evolution
Outcome Economy
Internet of Things
The new wave of personalization, placing the customer at the center of every
experience. Digitally enabled objects open up a powerful channel for
businesses to connect with their customers in authentic, meaningful ways.
Highly connected hardware components – the Internet of Things – allows IE companies to gain end-to-end
insights that will enable them to utilise their products and services to achieve desired customer outcomes.
Companies are beginning to deploy digital industry platforms to grow their businesses – beyond
the conventional equipment platform, these industry technology platforms integrate data and
applications with business partners and customers.
Advances in smart machines and wearable devices reveal new
opportunities for companies to empower workers through technology
allowing human talent to combine with machine intelligence
20Copyright © 2015 Accenture All rights reserved.
Technology will support ports in delivering productivity
and shifting into a more customer-centric business model
The adoption and impact path of the industrial internet
1. OPERATIONAL
EFFICIENCY
• Asset utilization
• Operational cost
reduction
• Worker productivity
2. NEW
PRODUCTS
& SERVICES
• Pay-per-use
• Software-based
services
• Data monetization
3. OUTCOME
ECONOMY
• Pay-per-outcome
• Connected
ecosystems
• Platform-enabled
marketplace
4. AUTONOMOUS
PULL ECONOMY
• Continuous demand
sensing
• End-to-end
automation
• Resource
optimization, waste
reduction
Conceptual
21Copyright © 2015 Accenture All rights reserved.
Hyundai HHI builds IoT connected smart ships to
improve operational efficiency for ship owners
• Build a network of sensors into
new vessels (e.g. Shore Platform &
Remote Monitoring)
• Captures voyage information (e.g.
location, weather, on-board
equipment, cargo status)
• Apply real-time analytics to new
and historical fleet data to monitor
their vessel’s status in real-time to
make operation decisions
• Improved safety
Real-time alerts and warnings
• Accurate forecasting
Predictive maintenance
• Efficient scheduling
22
Case study:
Research & innovation centre
collaboration with Southeast Asian port
23Copyright © 2015 Accenture All rights reserved.
Our productivity case analysis showed that many priority KPIs were
unmeasured due to lack of data and standardised definitions
Key process metrics and data gaps
Planning
1.1. Berth application
1.2. Berth planning
1.3. WH / Yard planning
1.4. Resource plan
Priority processes
QuaysideOperations
2.1. Vessel mooring
2.2. Cargo discharge
2.5. Operations enforcement
2.4. Productivity monitoring
2.6. Vessel unmooring
2.3. Cargo load
3.4. Storage enforcement
3.1. Internal trucking & sorting
3.3. Sorting & dispatch
3.2. Storage
4.2.Gate enforcement
4.1. Trailer out
Storage
Operations
Gate
Ops
• Storage allocation within target
proximity %
• Cargo dwell time
• Actual location of cargo
• Gross handling rate per cargo
type(i.e. gen. cargo)
• Net handling rate
• Total crane ops time
• Idle time breakup
• Detailed stowage plan
• Number of labour and equipment
deployed
• Trailer active and idle time
• Cargo dimensions and units
• Actual location of cargo
• Trailer turnaround time
• Average stacking height
• Storage utilisation
Process area and sub-area Priority KPIs Data gap
24Copyright © 2015 Accenture All rights reserved.
To close the gaps, potential technology solutions were
developed
Business challenges and potential technology solutions
Quayside
operations
Storage
operations
Report stowage details, deployment of
stevedores, during vessel service time using
handheld device
Labour deployment improvement
opportunities in gang intensity and idle
time
Inability to effectively measure quayside
operations productivity (e.g. net handling
rate) and equipment efficiency (e.g. ship
cranes)
Track detailed crane ops time using location
sensor technology on ship cranes
Measure and optimise the deployment of
key equipment performance e.g. trailers
deployment and turn around time
Video analytics or location sensors to track
trailer active and idle time
Track actual cargo storage location and actual
stacking height using fixed video analytics
alternatively drones
Challenges in proactively monitoring and
managing cargo dwell time and monitor
cargo safety
Track actual cargo storage with scanning
technology (e.g. passive RFID tags)
Discrepancy in actual location of cargo
in warehouse and yard and tallying to
reduce revenue leakage
Process Business challenge Potential technology solution
26Copyright © 2015 Accenture All rights reserved.
Leveraging the sensors crane operations data are easily
captured using customised sensors
Future state concept
Capture data Apply algorithm Analyse results
• Custom built industrial
grade sensor devices
detecting crane movements
with precision
• Stevedores deploy sensors
during quayside operations
• Easy handling and latching
on the cranes by
stevedores
• Cloud platform hosted off-site
• Data transmitted over cellular
network to cloud platform
• Data can also be transmitted
to a on-site ‘base-station’ that
is integrated with the cloud
• The algorithm detects key
process events in the raw
data:
- Crane swing from berth to
hatch
- Cargo rigging by
stevedores
- Cargo lifting
- Crane swing from vessel
to berth
- Cargo unrigging from
lifting gear
- Idle time
• Data directly fed into the BI
system to develop
dashboard and enable user
conduct analysis
• Possible use cases in
multiple areas e.g.:
- Real-time productivity
monitoring including
alerts based on pre-
defined business rules
- Benchmarking
- Continuous improvement
initiatives
Transmit data to cloud
platform
1 3 42
27Copyright © 2015 Accenture All rights reserved.
The results can be analysed and used to compare
productivity across cranes, stevedores and cargoes
Crane cycle detection algorithm
BerhHatch
Crane swings from berth
to hatch
Cargo is rigged by
stevedores
Cargo is lifted up
Crane swings to from
vessel to berth
Cargo is unrigged from
lifting gear*
Crane operations cycle steps
Block
location
Swing from
berth to hatch
Cargo is
rigged
Crane is
lifted up
Swing from
hatch to berth
Outcome
• Average process
time: 192s
• Average rigging
time: 10s
• Average unrigging
time: 10s
• Average swing
from hatch to berth
time: 46s
• Net handling rate:
135 t/hr
Vessel crane SWL : 30 t
Vessel cargo : Hot rolled steel plates (avg. weight per unit 1.8 t) Note : Cargo unrigging detection currently in development
8:44:25AM
8:44:40AM
8:44:55AM
8:45:10AM
8:45:25AM
8:45:40AM
8:45:55AM
8:46:10AM
8:46:25AM
8:46:40AM
8:46:55AM
8:47:10AM
8:47:25AM
8:47:40AM
8:47:55AM
8:48:10AM
8:48:25AM
8:48:40AM
8:48:55AM
8:49:10AM
8:49:25AM
8:49:40AM
8:49:55AM
8:50:10AM
8:50:25AM
8:50:40AM
8:50:55AM
8:51:10AM
8:51:25AM
8:51:40AM
8:51:55AM
8:52:10AM
8:52:25AM
8:52:40AM
8:52:55AM
8:53:10AM
8:53:25AM
8:53:40AM
8:53:55AM
8:54:10AM
8:54:25AM
8:54:40AM
8:54:55AM
8:55:10AM
8:55:25AM
Cargo is
unrigged
Crane cycle Crane cycle Crane cycle Crane cycle
Thank you

Driving port productivity and value proposition leveraging technology

  • 1.
    November 2015 Driving portproductivity and value proposition leveraging technology
  • 2.
    About me Robert Jessing Maritime& logistics, Accenture Strategy Based in Accenture’s Strategy practice in Singapore. Driving strategy at the intersection of business, operations, and technology. Experience from transportation and industrial equipment sectors in Scandinavia and Southeast Asia MSc. in Industrial engineering and management from Chalmers University of Technology and a B. in Financial economics from Gothenburg University
  • 3.
    3Copyright © 2015Accenture All rights reserved. End Customers Accenture works with port’s upstream and downstream players, and understands the whole port eco-system Port ServicesShipping Lines and Logistics Port Community and Trade Platform
  • 4.
    4 Agenda Key drivers impactingthe future of port operators Port value proposition redefined Leveraging emerging technology in port operations
  • 5.
    5Copyright © 2015Accenture All rights reserved. Five key drivers will impact the future of port operators Global exports and commodities volatility adds pressure on ports capacity and profitability Continued pressure from shipping alliances increasing buying power Increasing size of mega-vessels challenge the invest-to-follow paradigm The dawn of significant productivity uplifts requires investment to stay relevant Ports becoming trade facilitators and enable efficient operations Volatility adding pressure 1 Shipping alliances’ buying power 2 Mega-vessels – the USD 50 Bn challenge 3 Automation and analytics 4 At the centre of trade & dynamic supply chains 5
  • 6.
    6Copyright © 2015Accenture All rights reserved. Volatility adding pressure Volatility challenges capacity optimisation and narrows the opportunity window • While economic cycles are shorter and steeper, operations need to be more agile with more flexible cost structures to withstand business fluctuations. • Speed maneuver is required to capture business growth and operationalize new ports 1 -10 -5 0 5 10 15 1995 1996 1997 1998 1999 2000 2001 2002 2003 2004 2005 2006 2007 2008 2009 2010 2011 AverageEBITmargin(%) Average cycle period: 4-5 years Average cycle period: 1-1.5 years Cycle 1 Cycle 2 Cycle 3 Cycle 4 Cycle 5 Source: Accenture analysis, Capital IQ estimates 2011 Cycle 6 Short steep cyclesLong flat cycles Average EBIT margin for shipping lines
  • 7.
    7Copyright © 2015Accenture All rights reserved. The world’s largest shipping alliances are increasingly consolidating bargaining power Shipping alliances’ buying power (TEU capacities, October 2015) Top 5 liners / Alliances 83% The rest 17% Source:http://www.alphaliner.com/top100/index.php CKYHE17.8 % 30.1 % O3 H Süd G6 2M 18.4 % 3.3 % 15.6 % 2
  • 8.
    8Copyright © 2015Accenture All rights reserved. Mega-vessels put increasing requirements on port infrastructure – but the industry dynamics are shifting • Due to port, rail & road infrastructure requirements cost benefits may be as low as 6-7% • The slow investment in ports impede the efficiency of the vessels leading to a potential shift in industry dynamics • Land-side stakeholders work together at strategic planning level to strengthen their collective bargaining position (OECD) Liners are continuing the race for mega-vessels to drive efficiency… …but ports are questioning the case for the USD 50 Bn investment Mega-vessel challenge3 59 56 37 479 400 400 395 397 367 347 318 300 275 39 Sovereign Maersk NYK Altair President Truman 43 Regina Maersk 43 54 64 Emma Maersk Gudrun Maersk 43 CSCL 18,400 Maersk triple-E 59 LR 24,000 CMA-CGM Marco Polo Beam LOA Source: Rothberg S (2013) “Market-driven far-reaching scenarios: Impact and opportunities resulting from global change, Van Marie 2013, Norbridge 2014, OECD International transport forum • In 2015 >250 12’ TEU mega-vessels will plow the oceans - smaller ships are being pushed into local routes • 24’ TEU vessels may be another 30% more efficient than 12’ TEU vessels • The case for ports to invest-to-follow is resulting in insufficient handling capacity in cranes, berth, and yard
  • 9.
    9Copyright © 2015Accenture All rights reserved. Automation and analytics makes the productivity leap “purchasable” The case for automation • Automation still far reaching? - operations automation sprouting in both emerging and established operators (e.g. yards, gates) • Productivity increase is one of the goals of the automation by many. (e.g. HPH’s Terminal Catalunya (TERCAT) in Barcelona, Spain, semi-automated port since 2012) • 30% productivity improvement is forecasted, with the semi-automated gantries. Headcount requirement is 1/6 • Productivity business cases are unique – transshipment at risk • Automated container yard and unmanned gantry cranes • Next generation container vessels-ready Future-proofing transhipment competitiveness – x2 today’s capacity PSA terminal 3&4, Singapore • Greenfield terminal run automatically with automated gantry cranes • Achieved a gross operating efficiency of 46 moves per hour1  Land capacity and safety Kaoming Container Terminal, Taiwan Unique business cases for every port 4
  • 10.
    10Copyright © 2015Accenture All rights reserved. A number of semi-automation and automation terminals in operations Semi-automated or automated terminals investments (non-exhaustive) Source: Accenture 2013 Kaoming Container Terminal Kaohsiung Yang Ming Tobishima South Side Container Terminal Nagoya Nagoya Port Terminal Corporation Antwerp Gateway Antwerp APM-Maersk ECT Delta Terminal / Euromax Terminal Rotterdam Rotterdam HPH London Thamesport Kent HPH HHLA Container Terminal Altenwerder Hamburg HHLA Brisbane Autostrad Terminal Brisbane Patrick Busan New Container Terminal Busan BNCT Hanjin Newport Co Busan Hanjin Evergreen Terminal Kaohsiung Evergreen Pusan New Port Busan PNC Port of Taipei Taipei Evergreen / Yangming / Wan Hai Tokyo-Oi Container Terminal 5 Tokyo Wan Hai Terminal (s) in Operation Terminal(s) under Construction TTI Algeciras Algeciras Hanjin Muelle Prat Barcelona HPH APM Terminals Virginia Portsmouth, VA APM-Maersk 4
  • 11.
    11Copyright © 2015Accenture All rights reserved. Ports are increasingly integrating the port ecosystem to provide integrated services and focus on end-customers Lack of Terminal Operations Expertise Poor Terminal Productivity Landlord or Line-Dedicated Terminals Business Model Capacity Shortage Filled Growth Slowed Down Expertise of Terminal Operations “Commoditized” Transform Capacity Demand from Rapid Growth Terminal as part of Supply Chain Network Trade Facilitator Business Model Terminal Operators Business Model Evolution Sophistication of Business Model 1990’s 2000’s Future Trade Corridors 2010’s Asset Operator Asset Owner Efficient Gateway/Hub Transform At the centre of trade & dynamic supply chains Information is at the centre of an integrated ecosystem to facilitate trade and optimise supply chains 5
  • 12.
    12Copyright © 2015Accenture All rights reserved. So what is the take-away for ports? • Avoid silo structure with agile operations capabilities • Risk-mitigation during ups-and-downs • Optimizing operations and cost structure • Optimizing customer mix and service levels • Engage liners in infrastructure financing • Define a clear productivity edge • Centralised shared services supporting operations • Building the Port “Habitat” • Downstream client acquisition • Enable in hub-and-spoke services Volatility adding pressure 1 Shipping alliances’ buying power 2 Mega-vessels – the USD 50 Bn challenge 3 Automation and analytics 4 At the centre of trade & dynamic supply chains 5
  • 13.
    13 Key drivers impactingthe future of port operators Port value proposition redefined Leveraging emerging technology in port operations Agenda
  • 14.
    14Copyright © 2015Accenture All rights reserved. Our high performance port Study shows how the leading ports are targeting the next generation value proposition Value proposition of High-performance ports Source: Accenture: Achieving High Performance in Ports: 2013 Market focus & position Distinctive Capabilities Performance Anatomy 1. Customer centricity • Focus on service integration and customer stickiness • Active participation in logistics eco-system to extend scope or alliance to serve direct customers (shipping lines) to end customers (shippers) • Focus on profitability by optimizing customer mix and service levels 5. Process and IT standardization • Lessen the reliance on captive skills to solve shortage and immobility of talent • Improve replicability as new businesses buildup or across ports at different locations • Use of standardized platform for ease and speed to replicate • Build Shared Services to enforce standardization across multiple ports 2. Productivity standard • Stay relevant to the significant uplift of productivity standard • Consider using automation to quickly meet the productivity benchmarks • Unleash the power of port network 3. Operational agility • Sustainable agility and flexible cost structure to withstand business cycles • Avoid silo organization amd build in flexible cost • Multiple ports providing complementary services 4. Business scalability • Speed to scale to capture new business demand • Leverage economy-of-scale of external providers • Position as “preferred port brand” through unique value proposition across ports
  • 15.
    15Copyright © 2015Accenture All rights reserved. The value proposition needs to be supported by strong operations capabilities including analytics Priority capabilities to drive productivity • Central balancing of vessel call/arrival versus available berth, equipment, stevedore and yard • Ability to drive workforce and asset flexibility • Better enforcement of requirements on productivity, safety, security and quality across port stakeholders • Automated decision-support from analytics tools Integrated Planning and Command Centre • Data-driven insights and metrics into processes to identify improvement areas • Leverage modelling to optimise and drive productivity • Structure for continuous improvement with infusion of data- driven insights in day-to-day operations Operations analytics Priority capabilities Description
  • 16.
    16Copyright © 2015Accenture All rights reserved. The analytics team is developing from reporting to an capability resource optimisation and forecasting Analytics role in port operations Typical operations practices Operations analytics capability  Limited and high level performance metrics  Lack of data on quayside operations and gang planning  Limited time and capacity for analysis among Operations managers  Limited modelling capabilities  Projects run as ad-hoc analysis often with external support  Regular performance reporting on stevedore and ship level  Increasing availability of process performance data  Insight generation and trend analysis  Dedicated team for deep dive analysis (e.g. crane ratio, gang deployment)  Addition of analytical skillset  Ability to leverage modelling for optimisation and forecasting (e.g. long term demand drivers, yard allocation optimisation)  Ecosystem optimisation  Continuous improvement Ad-hoc insight generation 2 Focused projects leveraging modelling 3 KPI and process performance tracking 1 2. Ad-hoc insight generation Ad-hoc insight generation 2 Focused projects leveraging modelling 3 KPI and process performance tracking1 1. KPI and process performance tracking Ad-hoc insight generation 2 Focused projects lev. modelling3 KPI and process performance tracking 1 3. Focused projects leveraging modelling
  • 17.
    17Copyright © 2015Accenture All rights reserved. ..and information will also play an instrumental role to enable efficient operations and trade facilitation Information as the enabler for differentiation Automation Enablement Integration/ Execution of Carrier/Alliance’s Processes Integration with Port Community Smart Port Regional Operations Center Analytics and Predictive Scheduling International Trade Platform Door to Door Customer Experience Supply Chain Financing Global Port Network Logistics e- Marketplace Asset Operator Efficient Gateway/Hub Efficient Gateway/Hub Trade Corridor Trade Facilitator Terminal Operators Foundation Industry-grade, Robust TOS
  • 18.
    18 Key drivers impactingthe future of port operators Port value proposition redefined Leveraging emerging technology in port operations Agenda
  • 19.
    19Copyright © 2015Accenture All rights reserved. Our Industrial Tech trends survey shows the four key opportunities of emerging technology Opportunities of emerging technology Source: Accenture: Tech trends in transportation & industrial equipment (2015) 221 industrial equipment executives across 9 countries: Australia, Brazil, China, France, Germany, India, South Africa, UK & US Workforce Reimagined Platform (R)evolution Outcome Economy Internet of Things The new wave of personalization, placing the customer at the center of every experience. Digitally enabled objects open up a powerful channel for businesses to connect with their customers in authentic, meaningful ways. Highly connected hardware components – the Internet of Things – allows IE companies to gain end-to-end insights that will enable them to utilise their products and services to achieve desired customer outcomes. Companies are beginning to deploy digital industry platforms to grow their businesses – beyond the conventional equipment platform, these industry technology platforms integrate data and applications with business partners and customers. Advances in smart machines and wearable devices reveal new opportunities for companies to empower workers through technology allowing human talent to combine with machine intelligence
  • 20.
    20Copyright © 2015Accenture All rights reserved. Technology will support ports in delivering productivity and shifting into a more customer-centric business model The adoption and impact path of the industrial internet 1. OPERATIONAL EFFICIENCY • Asset utilization • Operational cost reduction • Worker productivity 2. NEW PRODUCTS & SERVICES • Pay-per-use • Software-based services • Data monetization 3. OUTCOME ECONOMY • Pay-per-outcome • Connected ecosystems • Platform-enabled marketplace 4. AUTONOMOUS PULL ECONOMY • Continuous demand sensing • End-to-end automation • Resource optimization, waste reduction Conceptual
  • 21.
    21Copyright © 2015Accenture All rights reserved. Hyundai HHI builds IoT connected smart ships to improve operational efficiency for ship owners • Build a network of sensors into new vessels (e.g. Shore Platform & Remote Monitoring) • Captures voyage information (e.g. location, weather, on-board equipment, cargo status) • Apply real-time analytics to new and historical fleet data to monitor their vessel’s status in real-time to make operation decisions • Improved safety Real-time alerts and warnings • Accurate forecasting Predictive maintenance • Efficient scheduling
  • 22.
    22 Case study: Research &innovation centre collaboration with Southeast Asian port
  • 23.
    23Copyright © 2015Accenture All rights reserved. Our productivity case analysis showed that many priority KPIs were unmeasured due to lack of data and standardised definitions Key process metrics and data gaps Planning 1.1. Berth application 1.2. Berth planning 1.3. WH / Yard planning 1.4. Resource plan Priority processes QuaysideOperations 2.1. Vessel mooring 2.2. Cargo discharge 2.5. Operations enforcement 2.4. Productivity monitoring 2.6. Vessel unmooring 2.3. Cargo load 3.4. Storage enforcement 3.1. Internal trucking & sorting 3.3. Sorting & dispatch 3.2. Storage 4.2.Gate enforcement 4.1. Trailer out Storage Operations Gate Ops • Storage allocation within target proximity % • Cargo dwell time • Actual location of cargo • Gross handling rate per cargo type(i.e. gen. cargo) • Net handling rate • Total crane ops time • Idle time breakup • Detailed stowage plan • Number of labour and equipment deployed • Trailer active and idle time • Cargo dimensions and units • Actual location of cargo • Trailer turnaround time • Average stacking height • Storage utilisation Process area and sub-area Priority KPIs Data gap
  • 24.
    24Copyright © 2015Accenture All rights reserved. To close the gaps, potential technology solutions were developed Business challenges and potential technology solutions Quayside operations Storage operations Report stowage details, deployment of stevedores, during vessel service time using handheld device Labour deployment improvement opportunities in gang intensity and idle time Inability to effectively measure quayside operations productivity (e.g. net handling rate) and equipment efficiency (e.g. ship cranes) Track detailed crane ops time using location sensor technology on ship cranes Measure and optimise the deployment of key equipment performance e.g. trailers deployment and turn around time Video analytics or location sensors to track trailer active and idle time Track actual cargo storage location and actual stacking height using fixed video analytics alternatively drones Challenges in proactively monitoring and managing cargo dwell time and monitor cargo safety Track actual cargo storage with scanning technology (e.g. passive RFID tags) Discrepancy in actual location of cargo in warehouse and yard and tallying to reduce revenue leakage Process Business challenge Potential technology solution
  • 25.
    26Copyright © 2015Accenture All rights reserved. Leveraging the sensors crane operations data are easily captured using customised sensors Future state concept Capture data Apply algorithm Analyse results • Custom built industrial grade sensor devices detecting crane movements with precision • Stevedores deploy sensors during quayside operations • Easy handling and latching on the cranes by stevedores • Cloud platform hosted off-site • Data transmitted over cellular network to cloud platform • Data can also be transmitted to a on-site ‘base-station’ that is integrated with the cloud • The algorithm detects key process events in the raw data: - Crane swing from berth to hatch - Cargo rigging by stevedores - Cargo lifting - Crane swing from vessel to berth - Cargo unrigging from lifting gear - Idle time • Data directly fed into the BI system to develop dashboard and enable user conduct analysis • Possible use cases in multiple areas e.g.: - Real-time productivity monitoring including alerts based on pre- defined business rules - Benchmarking - Continuous improvement initiatives Transmit data to cloud platform 1 3 42
  • 26.
    27Copyright © 2015Accenture All rights reserved. The results can be analysed and used to compare productivity across cranes, stevedores and cargoes Crane cycle detection algorithm BerhHatch Crane swings from berth to hatch Cargo is rigged by stevedores Cargo is lifted up Crane swings to from vessel to berth Cargo is unrigged from lifting gear* Crane operations cycle steps Block location Swing from berth to hatch Cargo is rigged Crane is lifted up Swing from hatch to berth Outcome • Average process time: 192s • Average rigging time: 10s • Average unrigging time: 10s • Average swing from hatch to berth time: 46s • Net handling rate: 135 t/hr Vessel crane SWL : 30 t Vessel cargo : Hot rolled steel plates (avg. weight per unit 1.8 t) Note : Cargo unrigging detection currently in development 8:44:25AM 8:44:40AM 8:44:55AM 8:45:10AM 8:45:25AM 8:45:40AM 8:45:55AM 8:46:10AM 8:46:25AM 8:46:40AM 8:46:55AM 8:47:10AM 8:47:25AM 8:47:40AM 8:47:55AM 8:48:10AM 8:48:25AM 8:48:40AM 8:48:55AM 8:49:10AM 8:49:25AM 8:49:40AM 8:49:55AM 8:50:10AM 8:50:25AM 8:50:40AM 8:50:55AM 8:51:10AM 8:51:25AM 8:51:40AM 8:51:55AM 8:52:10AM 8:52:25AM 8:52:40AM 8:52:55AM 8:53:10AM 8:53:25AM 8:53:40AM 8:53:55AM 8:54:10AM 8:54:25AM 8:54:40AM 8:54:55AM 8:55:10AM 8:55:25AM Cargo is unrigged Crane cycle Crane cycle Crane cycle Crane cycle
  • 27.