SlideShare a Scribd company logo
1 of 12
Download to read offline
The Asian Journal of Shipping and Logistics 36 (2020) 169–180
Contents lists available at ScienceDirect
The Asian Journal of Shipping and Logistics
HOSTED BY
journal homepage: www.elsevier.com/locate/ajsl
Original Article
Developing a comprehensive approach to port performance
assessment
Okan Durua
, Cassia B. Galvaob,∗
, Joan Mileskib
, Leo Tadeu Roblesc
, Amir Gharehgozlid
a
Nanyang Technological University, Singapore
b
Texas A&M University at Galveston, TX, USA
c
Universidade Federal do Maranhao – UFMA, Brazil
d
California State University, CA, USA
a r t i c l e i n f o
Article history:
Received 5 April 2019
Received in revised form 5 February 2020
Accepted 3 March 2020
Keywords:
Port performance
Port stakeholders
Quality function deployment
a b s t r a c t
This paper investigates the port performance assessment and proposes a comprehensive framework
with various perspectives as well as priority distributions of stakeholders’ expectations in port busi-
ness and operations. One fundamental questions in port performance studies is how to evaluate and
quantify intangible indicators on performance. There are definitely inputs and outputs, which may be
measured and evaluated through conventional instruments. However, each instrument deals with a par-
ticular aspect of whole performance problem (e.g. port efficiency, port productivity,), and many of these
instruments are limited to ‘measurable’ data on port management and operations. In this paper, these
two common problems are put under the scope, and a comprehensive port performance assessment
scheme is established by gathering various perspectives. Quality function deployment (QFD) approach
is preferred to formulize the problem and define priority ratings of expectations by each stakeholder in
the port domain. The framework can contribute to a broader understanding of ports as business units, its
development drivers and interaction with community neighbors, and to shed light to port performance
assessment considering both public and private entities.
© 2020 The Authors. Production and hosting by Elsevier B.V. This is an open access article under the
CC BY-NC-ND license (http://creativecommons.org/licenses/by-nc-nd/4.0/).
1. Introduction
Port performance indicators is not a new topic for port managers
nor maritime scholars. In the late 1970s, the UN agency UNCTAD
proposed that signatory countries should adopt and follow cer-
tain port performance indicators (UNCTAD, 1976; UNCTAD, 1987).
The idea behind it was straightforward: to be able to measure in
order to improve port performance. This fell immediately within
UNCTAD’s mission of promoting trade facilitation that enhances
economic development. Ports are a key element for merchandize
trade transaction to take place. In this sense, UNCTAD has dedicated
a specialized team of experts to follow up on the port performance
indicators. More recently, UNCTAD has proposed a port perfor-
mance scorecard as part of their port training program to combine
a set of indicators to refine assessment and benchmarking capa-
bility for senior port managers. The main idea of this program
is to bring the industry and academic perspectives together in
∗ Corresponding author.
Peer review under responsibility of the Korean Association of Shipping and
Logistics, Inc.
terms of port performance in order to share best practices among
port managers, particularly from developing countries (UNCTAD,
2012). Those indicators were predominantly associated with termi-
nal operational efficiencies generally based on volume throughput
(movements per crane, per hour; berth utilization rates; labor ratio
per TEU are some of the main indicators). Some of those termi-
nals, given the nature of the capital structure also allowed for
some financial performance analysis generally based on annual
statement and reports. Although insightful for terminal managers,
those indicators focused a specific aspect (Economic) of port per-
formance, not including other dimensions equally important in the
port activity, such as the social, environmental and political.
Brooks and Cullinane (2007) have argued that port performance
has a strong correlation with the concepts of governance and
devolution programs. Further, Brooks and Cullinane (2007) have
made an effort toward a clear cut of port performance measure-
ments and definitions for port managers and scholars under the
business perspective. More recently Brooks, Cullinane, and Pallis
(2017) have revisited the port governance issues with focus on
the port reform processes and less on port efficiency measure-
ments. Furthermore, various studies and investigations have aimed
to measure and to access port performance. In maritime business,
https://doi.org/10.1016/j.ajsl.2020.03.001
2092-5212 © 2020 The Authors. Production and hosting by Elsevier B.V. This is an open access article under the CC BY-NC-ND license (http://creativecommons.org/licenses/
by-nc-nd/4.0/).
170 O. Duru et al. / The Asian Journal of Shipping and Logistics 36 (2020) 169–180
Fig. 1. Port efficiency, effectiveness and productivity.
Source: (Esmer et al, 2019)
the typical performance measures approach takes in considera-
tion the economics only. The economic operational level typically
uses static indicators to measure performance such as: Utilization
(= Actual Input/Design Input Capacity, Max. Input); Port Produc-
tivity (= Actual Output/Effective Input Capacity); Port Efficiency (=
Actual Input/Effective Input Capacity). Port Effectiveness (= Actual
Output/Effective Input Capacity); Port Effectiveness (management)
(= ‘Qualified’ Actual Output/Effective Input Capacity) (Fig. 1). One of
the main issues that rise from these definitions is related to the data
availability. That is, in the absence of actual input, researchers end
up using capacity figures (Esmer et al, 2019aaaaaaaaaaa). Another
consequence of the lacking data is that a great share of the research
is done based on containers volumes throughput, however still
two-thirds of world merchandize trade is of bulk cargo (UNCTAD,
2016).
Thus, if port performance measures are concentrated in effi-
ciency measurements and are predominantly using the economic
approach with using static data, how could the port performance
be measured using a more comprehensive approach with multiple
lenses (not only economic)? How does port performance follow the
port strategy? Are there inconsistencies between efficiencies and
effectiveness? These are some of the orientation questions for this
study.
In this study, we argue that port performance assessment should
be done under multiple lenses for three main reasons. First, based
on the evidences we have observed in an in-depth literature
review the economic perspective. Second, the predominant busi-
ness orientation in the port performance assessment. And third,
considering more recent issues in port developments, such as the
need for port expansion due to increasing volume throughput;
the complexification of logistics’ networks; and the changes in
the governance. That is, beyond the microeconomic aspects, the
development of a comprehensive approach to port performance
assessment should be able to include other strategic dimensions
such as social, political and business ethics. This framework can be
applied in different levels of analysis, which are from the strategy,
to operational and technical levels. In the port reality, these levels
would correspond to city/region, port and terminals.
In this sense, this paper objective is to identify conceptual
gaps in the literature and with a theoretical approach, assessing
it with different perspectives about the concept of port perfor-
mance. In order to propose a more comprehensive framework
this paper consider four main forces corresponding to strategic
dimensions (social, economic, political and business ethics, which
included the environmental dimension). The study methodology is
based on three steps. First, we conducted an in-depth literature
review studies about port performance, analyzing and investi-
gating their main approaches and methods. Second, we deploy a
comprehensive assessment instrument is developed by using the
quality function deployment (QFD) methodology. The QFD method
is a diagnostic toolbox generally used in manufacturing industries;
however, it is also applied to services sectors identifying possi-
ble threats and opportunities (or gaps) about design, production
and operation processes regarding overall expectations of cus-
tomers. QFD, in a port context, can also be defined as a system
for translating customer (public and private agents/users) require-
ments/expectations into appropriate port (entity) deliverables at
each stage from research and service development to engineer-
ing and operation and finally to marketing/sales strategies. Third,
a pilot study is used to illustrate the application of the QFD princi-
ples as a more comprehensive method to access port performance
beyond the static data.
O. Duru et al. / The Asian Journal of Shipping and Logistics 36 (2020) 169–180 171
2. The port performance overview in the research agenda
The literature review conducted focused on two main aspects.
First, we situate port performance as a topic on Maritime
Transportation literature. Second, we identify the typical port per-
formance measurements in seminal contributions of researchers in
the field.
Pallis, Vitsounis, and De Langen (2010), Pallis, Vitsounis, De
Langen, and Notteboom (2011) have considered the research on
economics, policy and management of ports published from year
1997 to 2008. In their classification study they found that “port
competition and competitiveness” were prevalent in the period
2002–2006, while the themes of “port governance”, “port plan-
ning and development” and “port policy and regulation” were most
studied in 1997–2001. In the 2007–2008 period it was also noted
that there was a rise of “ports in the transport and supply chain.”
The results shown three main conclusions: First, almost half of
the studies are focused on the containers and/or container ter-
minals, while other goods (bulk, vehicles, and passenger) are not
represented or are five percent of published papers. Second, the
ports studies within the logistics chain has grown considerably;
and thirdly, the academic community is characterized by being in
a pre-paradigmatic stage, which consist of a set of small groups of
researchers with limited references to each other’s research. The
research of Pallis et al. (2010) also indicated that in the period from
1997 to 2008 almost half of the papers on ports were published
in a limited venue through to the International Association of Mar-
itime Economists (e.g. Maritime Policy and Management and Maritime
Economics and Logistics).
The research of Woo, Pettit, Beresford, and Kwak (2012) aimed
at presenting a structured literature review on ports studies for
the period from 1980 to 2009. The research used content analysis
techniques to classify the eight hundred and forty papers identified
in eight major themes. The authors concluded by stating that the
future of the ports research agenda should be guided not only by
the demands of the industry, but by development of methodologies
and theories, in view of the complexity of port management.
Woo, Bang, Martin, and Li (2013) as well as Notteboom, Pallis,
De Langen, and Papachristou (2013) had similar research objec-
tive which was to analyze the content of papers published over
the forty years of the journal, Maritime Policy and Management,
(1973–2012). Woo et al. (2013) stems from the assumption that the
issues related to shipping were initially dominant while the issues
of ports were of increasing interest to researchers later. The authors
divided the time frame in four periods (1973–1979; 1980–1989;
1990–1999 and 2000–2012). The results highlight the followings.
First, Economics remains as predominant field with about thirty-
five percent of all the published papers, but Management field has
greatly increased, particularly in the 2000s. Second, “conceptual
work” has the largest share in methodologies applied (35.1% or 345
of the 984 papers). However, authors noted that the methodologies
applied were becoming more sophisticated with advancing com-
puter techniques that allowed usage statistics and mathematical
models, with number of publications growing in the 2000s.
In second part of our literature review, we have identified the
researchers that have presented seminal contributions in the study
of port efficiency measurements. Efficiency remains a priority for
port managers even though a port’s performance is multifaceted
and is no longer limited to internal processes (Woo, Pettit, and
Beresford, 2011). Roll and Hayuth (1993) are pioneer in establishing
research efforts to identify and execute port efficiency performance
benchmarking. In Roll and Hayuth (1993) research, DEA is pre-
sented as new methodology for measuring port performance, as
it provides a relative efficiency rating in the analyzed units and no
‘standard references’ or indexes are required. The paper however,
works with hypothetical data and not real port cases.
Liu’s (1995) study compares public and private enterprises in the
UK port using the Stochastic Frontier analysis (SFA) model referenc-
ing the port efficiency measured by a frontier production function.
The results did not show clear-cut ownership (private or public) as
relevant factor in the efficiency outcome for the period of analysis.
In the case of Tongzon and Heng (2005), they have also studied
the relationship of ownership and efficiency adding to the stochas-
tic frontier model a principal component analysis (PCA) so that the
key factors on port competitiveness could be examined. The results
indicated that private sector participation can improve the opera-
tional efficiency. The limitations of the paper include the fact that
only container terminals were studied.
Talley (2006) showed that port performance should be mea-
sured also by the economic perspective (cost function) rather than
the engineering (volume throughput) as volume is limited by the
technical efficiency. The author points out that DEA is a consol-
idated technique to measure the relative technical efficiency of
ports, applied in different cases around the world. Talley (2006)
also called attention to the importance of measuring port perfor-
mance over time (single port) and in relative terms (multi ports
analysis). The efforts of Cullinane and Wang (2006a) were dedi-
cated to demonstrating the relevance of DEA in the port industry.
Their scope of analysis was also the container terminals, but the
most interesting result of their investigation was that “the optimum
efficiency levels indicated by DEA results might not be achievable in
reality, because each individual port has its own specific and unique
context (2006, p. 517).”
Bichou (2006) recognized that despite all the advances made
in port performance metrics, there was still a big gap in measur-
ing the ports performance’s integration in the supply chains they
are inserted. The paper presented a tested model and other cases
are offered as illustration. The investigation by Brooks (2006) is
a genuine in presenting the links between port performance and
the devolution process in the literature with strategic management
insights.
The study from De Langen et al. (2007) is authentic in the sense
that they also criticize the traditional performance indicator using
volume throughput, and they give a concrete contribution pointing
out alternative PPI (port performance indicator) that can be used.
They also indicate ports that are already collecting data for these
alternative PPI, as well as they name the interest of stakeholders
and benefits for the port authorities in analyzing these alternative
indicators. Relevant for this study is the new PPI they suggest for
socio-environmental stakeholders.
The investigation by Gonzalez and Trujillo (2009) is perhaps
one of the most comprehensive review on port efficiency measure-
ments. The paper’s scope is limited to economic productivity and
efficiency of ports and as such, the authors give a great contribution
to show the dominance of the Economics (as field) and Statistics
(as methodology and model) of port performance analysis in the
1995–2006 period. The authors give also a relevant insight for pol-
icy makers, pointing the need of closer follow up of corresponding
authorities of port data collection.
Port efficiency is also studied at the operational level. For exam-
ple, multiple papers have focused on the use of operations research
models for handling (containerized) cargo (Gharehgozli, Roy, &
De Koster, 2016; Gorman et al., 2014). In general, the business
literature covers the strategy levels, while the port literature is
dominated by the economic operational level. In this sense, the
research from Notteboom et al. (2013) gives another relevant con-
tribution, as in their aim to understand the extend and scope of port
research agenda, their conclusions go toward overcoming three
challenges pointed out by the authors. First, avoid fragmentation
of the studies that generate lack of consistency and breakdown
of long-term research agenda; Second, overcome the tendency
to neglect the construction of theories that is to deal with the
172 O. Duru et al. / The Asian Journal of Shipping and Logistics 36 (2020) 169–180
Fig. 2. Stakeholders: Mix and cross-over of economic, social, political, legal environmental/ecological, and technical pressures for seaport resilience.
Source: Gharehgozli, Mileski, Adams, and Von Zharen (2017c).
pressure for publication that direct the research for applied or
cases studies. Third has to do with the relationship of researchers
and policy-makers bearing in mind the relevance and rigor of port
related research: “Scholars tend to focus on making progress in specific
research disciplines whereas decision and policy-makers are interested
in the overall operation of ports, i.e. in economic, land-use planning
and environmental aspects.” (2013, p. 651)
The brief literature review performed here shows that there is
gap in the literature in a sense that there exists no paper with a
comprehensive approach to discuss whether efficient ports are also
effective. Until recently, the only research done on port focused was
from a decade ago on port choice (Hao, 2007). This is surprising,
since research on effectiveness has a long history beginning with
research on transport carrier choice using service attributes in the
1970s and early 1980s (see, for example, Saleh and LaLonde (1972);
McGinnis (1978); Brooks (1985); LaLonde and Cooper (1989)). Fur-
thermore, the handful discussions on port effectiveness do not
specify whether the criteria considered are at the strategic, tactical
or operational level. In fact, a quick review of the efficiency liter-
ature shows that they have been focused on the operational level.
Finally, the papers which focus on the differences of port effec-
tiveness and efficiency tend to focus on a specific stakeholder and
dismiss the other ones.
The research efforts leave us with three key points for our
investigation: there is an increasing interest for port performance
indicators and assessment; port performance is predominantly
measured within the economic parameters; and there is a chronic
lack of data availability on the port level, as the information is
typically provided by the individual terminals.
From the literature it is well documented that the port reform
wave of the 1990s has led scholars to seek for performance indica-
tors focused on efficiency. However, how is it possible to measure
port efficiency if the full data set is not available and if multiple
stakeholders are involved in the process? What if the multiple KPIs
(key performance indicators) have incompatible (or even contro-
versial) reference indexes? What if the efficiency optimization is
not leading to port effectiveness?
These are just some of the common questions that arise from a
more critical perspective of port performance analysis. Port effec-
tiveness is out of the scope of this paper, but is a good example
of a relevant topic that has received much less attention than
port efficiency, as evidenced in the recent research from Brooks,
Schellinck, and Pallis (2011a, 2011b); Brooks and Schellinck (2013);
and Schellinck and Brooks (2014), Schellinck and Brooks (2016).
3. The port performance in four dimensions: The
theoretical background
The stakeholders’ literature is not new in corporate governance
(Freeman & Reed, 1983), the incorporation of the stakeholders in
O. Duru et al. / The Asian Journal of Shipping and Logistics 36 (2020) 169–180 173
Fig. 3. An overview of the port performance assessment process.
Source: Authors’ own elaboration.
the port governance studies is relatively new if comparted to port
performance indicators as reviewed in the previous section.
The port stakeholders’ studies have in general the focus on the
stakeholders’ management, considering their different interplay
forces (Notteboom & Winkelmans, 2003) or their conflicting inter-
ests (De Langen, Nidjam, & Van der Horst, 2007; Galvao, Wang, &
Mileski, 2016; Parola & Maugeri, 2013). In the cases of Lam, Ng, and
Fu (2013); Cruz, Ferreira, and Azevedo (2013) and Dooms (2014)
the authors have built on the stakeholder analysis to provide a
framework of analysis that links stakeholders to governance issues.
Within a port, two different sets of people act as stakehold-
ers: those who directly use, regulate, maintain, and police the port,
and those who indirectly benefit or are otherwise affected by the
activities of the port.
Fig. 2 provides an example of some of the stakeholders in the
analysis that may influence or exert pressure on. Port performance
must be analyzed by keeping in mind both the stakeholders inside
and outside the port perimeter.
In any of those cases studied in our review of port stakeholders’
literature we could notice that researchers have not necessarily
found new stakeholders in the port context, but their interrelation
became more complex as the port business developed to inte-
grate supply chains and robust logistics operations. In this sense,
our study has considered that besides the economic dimension,
which shall remain as the main driver, there are at least three other
dimensions that should be incorporated for a more comprehen-
sive port performance assessment. The novelty we present here is
the link between port stakeholders’ expectations and the port per-
formance measures and concepts. The ‘comprehensive’ framework
refers to encapsulating of various aspects as well as a compro-
mised assessment. Building a ‘stakeholder neutral’ perspective is
obviously impossible. None of assessments would satisfy all stake-
holders for all of their desires.
A performance assessment is conventionally expected to rep-
resent a certain point of view. From the perspective of a terminal
operator, any strategies that reduces costs may be feasible while
some of these strategies may dissatisfy e.g. society (e.g. environ-
mental concerns originated from cheap but harmful equipment).
However, a compromised assessment can be developed based on a
predefined priority degree of major stakeholders while the debate
raises on the definition of priority. The pilot study in Section 5
illustrates two cases including priority-based and priority neutral
assessment, so one may compare both types of allocation.
Based on the initial discussions of Notteboom and Winkelmans
(2003) on stakeholders’ management and, also on the more recent
research of Dooms (2014) about integrating the three “Ps” (profit,
people and planet) in the performance bottom line, we consider
that social and environmental aspects have to be part of the port
performance assessment considering the nature of port activities
and the ethics that its business should follow in an international
competitive environment. In addition, the port reform ‘wave’ from
the 1990s with subsequent changes in the governance (Brooks &
Cullinane, 2007) leave no doubts that regulation and legislation
have to be considered in any performance assessment of ports.
In other words, this means while the economic dimension
includes any financial and operational efficiency measurements,
the social, ethic and political dimensions have to take into account
the port as a dynamic activity that brings impact to the location
(environmental and community) at the same time it is impacted
by national and international circumstances (trade, regulation and
development). At a glance, we have that: The Social dimension is
related to labor, impact on community, people and culture; the
Political dimension has to do with regulation, law, policies and gov-
ernance; the Ethics dimension can consider many different aspects
of the social and environmental responsibilities; and Economics is
related to the profit and resources required in the port business.
These four dimensions (economic, social, political and ethics) can
be applied in different levels of analysis, that is from the strategy,
to operational and technical levels. In the port reality, these levels
correspond to city/region, port and terminals.
As such, our hypothesis is that a port is performing well when
these four dimensions are fulfilled. The next questions are then,
what are the indicators to examine in each dimension? What are
the parameters to consider and how to balance them? In order to
be able to answer these questions, we have to bear in mind the
different groups of stakeholders and their specific interest in the
port performance.
4. Measurement and quantification in port performance
The assessment process consists of four main steps as parts of
the QFD approach. In the first step, the stakeholders were iden-
tified. In the second step, the criteria that satisfy performance
perception of each group were defined. Those criteria must be com-
prehensive and independent. If two criteria are dependent, then
they have to be combined and labeled again. In the third step,
the technical measures corresponding to the criteria were iden-
tified. Technical measures must be “measurable”, “tangible” and
must have a unit (i.e. KPIs). Furthermore, a technical measure can
be a binary question such as quality management system exists
or not. Finally, the level of contribution of each technical mea-
sure to each criterion were estimated. Furthermore, the importance
level of each criterion were identified (priority of each criteria). As
a result, we will see how each technical measure contributes to
174 O. Duru et al. / The Asian Journal of Shipping and Logistics 36 (2020) 169–180
Table 1
Stakeholders & expectations in port and terminal business.
S1 Terminal Operators (incl. Owners and Investors) Notes
E1.1 Profitability/Earnings Higher operating returns, less operating cost
E1.2 Customer Loyalty (Business Sustainability) Customer commitment and long-term contracts
E1.3 Credibility/Financial Reputation Financial strength and higher credit rating
E1.4 Publicity/Brand Value General reputation, brand equity, goodwill
E1.5 Responsive and Professional Public Institutions Port authority, landlord, public administration
E1.6 Safe and secure cargoes and their contents
E1.7 Safe and secure on board operations at berth Operations managed by ships and their officers
E1.8 Proper pilotage/tug services 7/24 service, proper number of tugs
E1.9 Hinterland/Foreland architecture and plasticity Flexibility of backyard for development prospects
S2 Cargo owners
E2.1 Safe and secure handling of cargo
E2.2 Less transit time (quick service)
E2.3 Cheaper service (right pricing)
E2.4 Smooth and quick customs procedure
E2.5 Convenience/Flexibility of storage facilities (early drop-off and late pick-up)
E2.6 Less and reduced carbon footprint
S3 Shipping firms (shipowners)
E3.1 Less transit time (mooring, cargo handling)
E3.2 Safe cargo handling
E3.3 Lower terminal fees
E3.4 Convenient/safe terminal location
E3.5 Less and reduced carbon footprint
S4 Inland carriers (incl. Logistics firms, trucking and rail transport firms)
E4.1 Less transit time (handling, gate operations)
E4.2 Convenience/flexibility of parking facilities
E4.3 Smooth and quick customs procedure
E4.4 Convenience of transport infrastructure
S5 Local and national government (incl. landlords/port authorities)
E5.1 Terminal security
E5.2 Safe terminal operations
E5.3 Social responsibility
E5.4 Compliance with labor standards
E5.5 Responsiveness to government inquiries (e.g. data sharing)
E5.6 Transparency and proper communication
E5.7 Competitiveness and growth (developmental attitude)
E5.8 Less and reduced carbon footprint
S6 Global and supra-national regulators
E6.1 Terminal security
E6.2 Safe terminal operations
E6.3 Compliance with labor standards
E6.4 Less and reduced carbon footprint
S7 Society/citizens
E7.1 Terminal security
E7.2 Safe terminal operations
E7.3 Social responsibility
E7.4 Compliance with labor standards
E7.5 Transparency and proper communication
E7.6 Less and reduced carbon footprint
E7.7 Positive and adaptive port-city connection
S8 Workers/labor (internal customer)
E8.1 Compliance with labor standards (working environment)
E8.2 Higher salary scale and benefits
E8.3 Social security
E8.4 Relevant facilities and training opportunities
Source: Authors’ own elaboration.
satisfaction/dissatisfaction of a particular stakeholder or its expec-
tation. Fig. 3 gives an overview of the framework (QFD method and
its application will be discussed below with the pilot study).
In the first phase of this study (i.e. Step 1 and 2), an extensive
content analysis process was followed mainly with in-depth sys-
tematic literature review (as built in sections 2 and 3) and authors’
assessment of contents (keyword based) of port performance stud-
ies (PPRN, 2019),1 and finally a list of major stakeholders and their
expectations from port services were gathered in Table 1.
1
PPRN (Port Performance Research Network) is a group founded within the IAME
(International Association of Maritime Economists) to investigate port performance
In this paper, a more functional classification as presented
on Table 1 was preferred considering latter part of the study
in which we investigated interactions and cause-effect linkages
between measures/indicators and stakeholders’ interest. In con-
trast to previous studies, this paper goes a step forward and
classifies major expectations of each stakeholder to clarify the sub-
set of requirements. Expectations of each stakeholder (coded as
Ex.x) also rephrase the definition and attributed meaning which
eliminates the semantic miscommunication. For example, instead
in focus. It was created in 2001 by academic researchers and its meetings and author
publication include maritime industry members and practioners.
O. Duru et al. / The Asian Journal of Shipping and Logistics 36 (2020) 169–180 175
Fig. 4. Traditional format of the House of Quality (HoQ).
Source: Akao (2004).
of using “safety” or “location” a general expectation of all stake-
holders, we have phrased them to meet each stakeholder point of
view associated with that variable.
4.1. The Hinterland and Foreland Plasticity
In this paper, we propose a new concept in port studies, the Hin-
terland and Foreland Plasticity (See E1.9). Hinterland conventionally
refers to all transport facilities and industrial end users (i.e. stake-
holders) behind ports while foreland refers to maritime transport
networks and connections in the sea side of ports. The first con-
ventional use of the term, foreland, goes back to 1950s (Weigend,
1956, 1958). Weigend (1958) investigated the term from a seman-
tic and bibliometric perspective and distinguished hinterland and
foreland through their fundamental differences. The modern inter-
pretation of the foreland concept was investigated in Notteboom
and Rodrigue (2005) as well as Rodrigue and Notteboom (2010)
based on the port regionalization problem. According to Rodrigue
and Notteboom (2010), port regionalization is not only a process in
hinterland, but it is also the evolution of foreland through cooper-
ation among regional ports.
The concept of the hinterland and foreland plasticity refers to
three fundamental features. First, ports extend their operations and
business backward to intermediate hubs and hinterland in general.
Many ports have been built in developing stages of their regions
and countries, and cities behind those ports have enlarged and
spread out through the connection between ports and hinterlands.
Eventually, ports have significant difficulty to find suitable land and
facilities to expend their operations and business. In this circum-
stance, plasticity refers to the capacity and flexibility of hinterland
for expansion without tackling with the city at the background. Sec-
ond, the plasticity of hinterland may refer to intermodal capacity
and flexibility. Development and expansion of ports typically need
the development of transport infrastructure between hinterland
and ports as well as other destinations in the network (i.e. fore-
land). In some cases, port development is restricted by inability to
develop transport infrastructure, and that is classified as another
dimension of the plasticity. In addition to above mentioned costs
of inaccurate city and port planning, the plasticity of hinterland
in terms of political and social aspects is the third fundamental
feature of the term.2 Although the third dimension is more about
the hinterland, it emphasizes the adoption and tolerance by local
community and public policy.
4.2. Defining customer and seller (service provider)
Regarding a comprehensive port performance framework, there
is no ‘port-centric’ definition of service provider which external-
izes all other stakeholders and labels as ‘customer’ (stakeholder
neutrality principle). The society and citizens of a region or coun-
try definitely value and benefit themselves from port services due
facilitated trading activities and contributions to the region. There-
fore, the relationship between stakeholders is not unidirectional
from all stakeholders to ports and terminals, but it is actually mul-
tifaceted and it can be seen as a web of interactions. For example,
citizens would require landlord and national government to facili-
tate hinterland operations as well as making proper plans to ensure
safe, secure and lean transport. From citizens’ perspective, local and
national government is also a service provider or facilitator. Consid-
ering the entire concept of ports and terminals, port performance
inquiries are a more complex web of relationships.
4.3. Quality function deployment and expectations matrix
The quality function deployment (QFD) (Akao, 2004) method
is an instrument to find a final cumulative impact of a technical
measure (e.g. KPIs) on particular aspects of customer satisfaction
(i.e. expectations). The motivation behind the methodology arises
from the fact that there is no direct link between a final product or
service and various segments of the organization. In other words,
expectations of customer cannot be reflected in different agents
and departments of the product/service provider. For example, it is
quite difficult to translate requirements of shipping firms into envi-
ronmental or financial apparatus (i.e. technical measures) while
same translations need to be performed many other stakeholders
too. In this regard, the QFD methodology helps to translate require-
ments into measurable and tangible instruments as well as to
2
The term, the hinterland and foreland plasticity, may be extended with other
aspects of port/terminal operations and management.
176 O. Duru et al. / The Asian Journal of Shipping and Logistics 36 (2020) 169–180
Table 2
Impact of performance indicators on stakeholder satisfaction (Sample: Portugal, S.Pore, U.S.A., Turkey).
Source: Authors’ own elaboration.
calculate the equilibrium among stakeholders as well as prioritiz-
ing instruments in terms of their cumulative impact on costumer’s
satisfaction. When only one type of customer is present, such trans-
lation should show an equilibrium among technical measures and
highlighted measures of the greatest impact. A production unit may
have so many technical measures to manage and to improve the
product while ensuring certain internal criteria (e.g. breakeven,
profitability, manpower security). The QFD approach helps orga-
nizations to identify technical measures with the greatest impact
for better utilization of resources.
The house of quality (HoQ) is an essential component of the
QFD, and it is a matrix of customer (i.e. stakeholder) expecta-
tions vs. technical measures (e.g. KPIs) (Fig. 4). The function of
HoQ is to clarify and quantify the contribution of each technical
measure to the improvement of the stakeholders expectation as
well as the cumulative improvement of the objective phenomenon
(Akao, 2004). An expert panel (e.g. experts, engineers, consultants,
researchers) estimates the level of relationship between technical
measures and their corresponding technical/management appara-
tus and customer requirements based on a scale of 0/1/3/5/7 or
0/1/3/5/7/9 (higher the rating, stronger the impact). When the rela-
tionship can be estimated numerically, corresponding rating can
also be reflected based on a correlation index. However, it is most
probably mentally calculated by subject matter experts. In contrast
to traditional surveys, subject matter experience is much valuable
and essential than the number of people in this exercise. A few
subject matter experts would be sufficient than hundreds of less
qualified people with limited experience. Therefore, the QFD should
not be confused with conventional surveys and their sample size
requirements. The legitimate population of the QFD is already very
small due to the limited number of subject matter experts with
broader understanding, experience and technical credentials.
It is a very natural argument that customer requirements are
not equally important. Therefore, customer requirements need to
be prioritized too. The prioritization of customer requirements can
directly be asked to a sample of customers. However, this paper has
slightly different objectives and structure. In this paper, the rela-
tionship between groups of respondents (e.g. cargo owners and
shipping firms) and groups of technical measures are compared.
This paper does not attempt to investigate the relationship between
requirement of a specific customer and a technical measure at
the micro level. Instead, this paper investigates macro relation-
ships between stakeholders and groups of technical measures to
shed light to future research. In other words, future research may
focus on a specific customer group (stakeholder) and its expecta-
tions (listed in Table 1) and technical measures for a given port or
terminal. For the purpose of this paper, the significance of each
stakeholder is investigated through independent subject matter
experts. If this question would be asked to specific stakeholder,
each stakeholder would naturally prioritize its own requirements.
O. Duru et al. / The Asian Journal of Shipping and Logistics 36 (2020) 169–180 177
Table 3
Impact of performance indicators on stakeholder satisfaction (Sample: Brazil).
Source: Authors’ own elaboration.
Therefore, participants should be impartial or reflect the impartial
standpoint. Priorities can be extracted in various ways and then
normalized. In this paper, we asked a few experts with broader
views and without direct connection to any interest group as well
as collecting opinions among scholars (including authors). A rank-
rate approach was followed in which stakeholders are put in order
of importance (for the port ecosystem) at the first stage, and then,
assuming the top stakeholder as 100 points, remaining stakehold-
ers are given points in 0–100 scale considering the indifference
value with the top choice. Median responses are normalized to
define priority degrees. For example, ‘Terminal Operators’ has been
given 95 points just below the top choice, ‘Cargo Owners’, with 100
points. It is normalized priority calculated at 0.16 (=95/605 sum of
given marks) while ‘Cargo Owners’ has 0.17 (=100/605 sum of given
marks).
The HoQ may also represent the relationship between technical
measures. The correlation matrix above technical measure row can
be utilized for this purpose (as in Duru, Huang, Bulut, & Yoshida,
2013). On the other hand, this paper does not attempt a micro
analysis and correlation assessment. A sample of technical mea-
sures in each group is provided to participants while this paper
does not investigate each technical measure. Micro level assess-
ment may be conducted for the case of a specific port or terminal,
and technical measures are actually different for various types of
ports and terminals (e.g. dry bulk terminal vs. container termi-
nal).
Similar to the correlation matrix, intra-industry assessment is
not performed in this paper. Intra-industry assessment section is
a useful component in which the target organization is compared
to its competitors in terms of each customer requirement. Since
there is no target organization and micro level analysis, competitor
section is also irrelevant. Future research at the micro level may
also consider reflecting competition analysis.
The expectations of stakeholders have already been discussed
and listed in Table 1. The definition of technical measures is another
fundamental question to develop practical strategies to improve
port performance. Considering authors in-depth analysis of tech-
nical papers, case studies and various publications of UNCTAD (as
refereed on Sections 2 and 3), the technical measures of port ser-
vices in its wider meaning are classified in nine groups of indicators
as follows:
• Market Indicators (e.g. % market share)
• Financial Indicators (e.g. Return on equity)
• Operational Indicators (in-terminal) (e.g. Ships/Day, Hours/Ship)
• Technology Indicators (equipment-technology) (e.g. Age of gantry
cranes)
• Port/Harbor Indicators (seaway) (e.g. No. of marine accidents)
178 O. Duru et al. / The Asian Journal of Shipping and Logistics 36 (2020) 169–180
• Environmental Indicators (e.g. Volume of CO2 Emission)
• Social Indicators (public relations, CSR) (e.g. $ spent for local com-
munity)
• Gate/Hinterland Indicators (border and out-terminal) (e.g. Average
gate time per truck)
• Macro-Economic and Political Indicators (e.g. Volume of regional
trade, economic climate)
In this paper, the stakeholder expectations are represented by
each stakeholder group as a cumulative means of requirements
and expectations to be satisfied. Technical measures are also rep-
resented by each group of indicators. In this research track, future
studies will search for the relationship between each expectation
of stakeholder and each technical performance measures.
5. Testing the concept of a comprehensive framework: a
pilot study
As a pilot study, Table 2 introduces an estimated matrix of stake-
holders (as representative of unique expectations) vs. technical
performance measures (as representative of micro level indica-
tors behind them). The objective of this pilot study is to represent
potential gross interactions between stakeholders and groups of
technical measures of port operations and connected activities. A
group3 of operational executives from port business and logistics
company representatives as well as a few researchers are invited (in
Brazil, Portugal, Singapore, Turkey and USA, whose profile is sum-
marized in Annex I) to participate to the pilot study. The pilot study
is a rough estimation for an average response, and Table 2 presents
the median response for each group of data. The slight difference
between priority-based and priority-neutral analysis reflects the
approximation.
The distribution of the impact of stakeholders could be mon-
itored through the density of symbols in the matrix. The direct
stakeholders of port/terminal operations (terminal itself, cargo
owners, shipping firms) cluster around the operational and techno-
logical indicators while the rest of the stakeholders lay through the
right of the matrix which represents hinterland, society and macro-
economic and political aspects of the port business. Based on pilot
study entries, the priority of each stakeholder is presented with
normalized priority degrees (ranking and standard scoring are uti-
lized for the pilot study). Below the matrix, the level contribution
(sum-product of priority and size of impact; normalized values)
and ranking of technical measures are calculated (the conventional
arithmetic operations of the QFD method are utilized).
Fundamentally, two groups of technical measures stand out in
the entire sample of indicators. Macro-economic and political indi-
cators represent the bird’s eye view to the problem and emphasize
the higher-level factors while technology indicators are more about
the internal capacity (also operational indicators). However, the
pilot study just deals with the gross impact of groups (stakehold-
ers and technical measures) which is definitely an overview of the
entire problem. Furthermore, there are special circumstances to be
3
The participants have agreed to provide their answers on a volunteer based and
have received no monetary compensation for their time.
considered regarding the different contexts of each respondents’
countries. In Brazil, for instance, respondents have emphasized
the operational and financial indicators as per rank results shown
in Table 3 (bottom line). This could be explained by the country
regulatory framework, specifically as the concession processes are
implemented by government agencies (centralized and long last-
ing). Still in Table 3, we can see that in Brazil, the respondents rank
to indicate that Brazilian government should focus on facilitating
and developing trade and national economy as well as building
financially feasible ports/terminals to satisfy/support these stake-
holders. The terminal operators ranked 2, indicating that terminal
operations must be improved as well. In such a way, we consider
that these results are consistent with some major issues identified
at Brazilian large infrastructure projects such as lack of funds for
new building; and government policies discontinuity both impact-
ing the operational and economic efficiencies of ports (Galvao et
al, 2017)(Galvao et al., 2016). In the case of public ports, the port
governance structure centralizes decisions at the Federal Govern-
ment level, there is actually a lack of autonomy, i.e., dependence
of public funds transfer for facing investment, debts services and
even operational expenses.
6. Conclusions
Overall, we consider that the paper has accomplished its objec-
tive of reviewing in-depth the international literature of port
performance and based on a critical view on them, we have studied
an alternative more comprehensive framework for port perfor-
mance assessment covering four dimensions (economic, political,
social, ethics). The stakeholder impact matrix shows that it is possi-
ble to have different expectations from different stakeholders being
assessed at the same time, which support our original hypothe-
sis of “a port is performing well when these four dimensions are
full filled”. The pilot study has validated the original idea of sec-
tor need of a more comprehensive analysis of port performance
indicators. As such, this conclusion should provide insights to port
managers and policy makers in how to integrate the QFD in their
bench makers. The continuation of this research requires system-
atic input collection from a larger sample of stakeholders’ groups
aiming to provide an amplified pool of data that could sustain cross
country managerial recommendations for the port stakeholders in
addition to improve mutual understanding and interaction.
In an ongoing research, much sensitive and detailed analysis of
those interactions are investigated through a wider group of rep-
resentatives which will reveal more practical and insightful results
about the comprehensive port performance framework.
Acknowledgement
The authors would like to thank editors and the two anonymous
reviewers whose comments helped us to improve the quality of this
paper.
O. Duru et al. / The Asian Journal of Shipping and Logistics 36 (2020) 169–180 179
Annex I.
Summary of profile operational executives and researches who
volunteered to collaborate in the pilot study
Country Gender Sector Main expertise Years of
experience in the
maritime sector
Brazil Female Public/regulatory Port develop-
ment/Investment
20+
Brazil Male Container Shipping Container
terminals
15+
Brazil Male Environmental
impact
Ports and
terminals
10+
Brazil Male Dry Bulk terminals Port
development
5+
Portugal Female Marine services
and Shipping
Training and
performance
assessment
25+
Singapore Male Terminal
Equipments
Container
terminals
25+
Singapore Male Terminal/Yard
Operations
Container
terminals
10+
Singapore Male Third Party
Logistics
Logistics
(Land+Water)
10+
USA Male Third Party
Logistics
Logistics (All
modes)
20+
USA Male Container Shipping Logistics
(Inland Water)
25+
Turkey Male Third Party
Logistics
Logistics (All
modes)
10+
Turkey Male General Cargo
Terminal
Break bulk 5+
Turkey Male General Cargo
Terminal
Break bulk 20+
Source: authors’ own elaboration.
References
Akao, Y. (2004). QFD: quality function deployment – Integrating customer requirements
into product design. New York: Productivity Press.
Bichou, K. (2006). Review of port performance approaches and a supply chain frame-
work to port performance benchmarking. Research in Transportation Economics,
17, 567–598.
Brooks, M. R. (1985). An alternative theoretical approach to the evaluation of
liner shipping. Part II. Choice criteria. Maritime Policy and Management, 12(2),
145–155.
Brooks, M. R. (2006). Issues in measuring port devolution program performance: a
managerial perspective. Research in Transportation Economics, 17, 599–629.
Brooks, M.R., and Cullinane, K. (2007). (Vol. 17). Elsevier.
Brooks, M. R., Schellinck, T., & Pallis, A. A. (2011). A systematic approach for evalu-
ating port effectiveness. Maritime Policy and Management, 38(3), 315–334.
Brooks, M., Schellinck, T., & Pallis, A. (2011). Port effectiveness: Users’ perspectives
in North America. Transportation Research Record: Journal of the Transportation
Research Board, (2222), 34–42.
Brooks, M. R., & Schellinck, T. (2013). Measuring port effectiveness in user service
delivery: What really determines users’ evaluations of port service delivery?
Research in Transportation Business and Management, 8, 87–96.
Brooks, M. R., Cullinane, K. P., & Pallis, A. A. (2017). Revisiting port governance and
port reform: A multi-country examination. Research in Transportation Business
and Management, (22), 1–10.
Cullinane, K., & Wang, T. F. (2006). Data envelopment analysis (DEA) and
improving container port efficiency. Research in Transportation Economics, 17,
517–566.
Cruz, M. R. P., Ferreira, J. J., & Azevedo, S. G. (2013). Key factors of seaport compet-
itiveness based on the stakeholder perspective: An Analytic Hierarchy Process
(AHP) model. Maritime Economics and Logistics, 15(4), 416–443.
De Langen, P., Nidjam, M., & Van der Horst, M. (2007). New indicators to measure
port performance. Journal of Maritime Research, 4(1), 23–36.
Dooms, M. (2014). Integrating ‘triple P’ bottom line performance and the license to
operate for ports: Towards new partnerships between port cluster stakehold-
ers. In Y. Alix, B. Delvalle, & C. Comtois (Eds.), Port-City governance (pp. 55–75).
Editions EMS.
Duru, O., Huang, S. T., Bulut, E., & Yoshida, S. (2013). Multi-layer qual-
ity function deployment (QFD) approach for improving the compromised
quality satisfaction under the agency problem: A 3D QFD design for the
asset selection problem in the shipping industry. Quality & Quantity, 47(4),
2259–2280.
Esmer, S., Alnipak, S., & Duru, O. (2019). Port productivity. assessment for major
container terminals of Turkey. International Journal of Transport Economics, 46(4).
Freeman, R. E., & Reed, D. L. (1983). Stockholders and stakeholders: A new perspec-
tive on corporate governance. California Management Review, 25(3), 88–106.
Galvao, C. B., Wang, G. W., & Mileski, J. (2016). Public-private interests and conflicts
in ports: A content analysis approach. The Asian Journal of Shipping and Logistics,
32(1), 13–22.
Galvao, C. B., Robles, L. T., & Guerise, L. C. (2017). 20 years of port reform in Brazil:
Insights into the reform process. Research in Transportation Business & Manage-
ment, 22, 153–160.
Gharehgozli, A. H., Roy, D., & De Koster, R. (2016). Sea container terminals: Recent
developments and OR models. Maritime Economics and Logistics, 18(2), 103–140.
Gharehgozli, A. H., Mileski, J., Adams, A., & Von Zharen, W. (2017). Evaluating a
“Wicked Problem”: A conceptual framework on seaport resiliency in the event
of weather disruptions. Technological Forecasting and Social Change, 121, 65–75.
Gonzalez, M. M., & Trujillo, L. (2009). Efficiency measurement in the port industry: A
survey of the empirical evidence. Journal of Transport Economics and Policy (JTEP),
43(2), 157–192.
Gorman, M., Clarke, J. P., Gharehgozli, A. H., Hewitt, M., De Koster, R., & Roy, D. (2014).
State of the practice: Application of OR/MS in Freight transportation. Interfaces,
44(6), 535–554.
Hao, X. (2007). Stated preference technique for analysis of container port competi-
tion. Transportation Research Record, 2033, 8–13.
LaLonde, B. J., & Cooper, M. C. (1989). Partnerships in providing customer service: A
third party perspective. Oak Brook, IL: Council of Logistics Management.
Lam, J. S. L., Ng, A. K., & Fu, X. (2013). Stakeholder management for establishing
sustainable regional port governance. Research in Transportation Business and
Management, 8, 30–38.
Liu, Z. (1995). The comparative performance of public and private enterprises: The
case of British ports. Journal of Transport Economics and Policy, 263–274.
McGinnis, M. A. (1978). Segmenting Freight markets. Transportation Journal, 18(1),
58–68.
Notteboom, T., & Winkelmans, W. (2003). Dealing with stakeholders in the port
planning process. In W. Dullaert, B. Jourquin, & J. Polak (Eds.), Across the border:
Building upon a quarter of century of transport.
Notteboom, T., & Rodrigue, J. P. (2005). Port regionalization: Towards a new phase
in port development. Maritime Policy and Management, 32(3), 297–313.
Notteboom, T., Pallis, A., De Langen, P. W., & Papachristou, A. (2013). Advances in
port studies: The contribution of 40 years Maritime Policy and Management.
Maritime Policy and Management, 40(7), 636–653.
Pallis, A., Vitsounis, T. K., & De Langen, P. W. (2010). Port economics, policy
and management: Review of an emerging research field. Transport Reviews: A
Transnational Transdisciplinary Journal, 30(1), 115–161.
Pallis, A., Vitsounis, T. K., De Langen, P. W., & Notteboom, T. (2011). Port economics,
policy and management: Content classification and survey. Transport Reviews:
A Transnational Transdisciplinary Journal, 31(4), 445–471.
Parola, F., & Maugeri, S. (2013). Origin and taxonomy of conflicts in seaports:
Towards a research agenda. Research in Transportation Business and Management,
8, 114–122.
PPRN. (2019). Port performanceresearch network.. Available from: https://www.pprn.
network/
Roll, Y., & Hayuth, Y. (1993). Port performance comparison applying data envelop-
ment analysis (DEA). Maritime Policy and Management, 20(2), 153–161.
Rodrigue, J. P., & Notteboom, T. (2010). Foreland-based regionalization: Integrating
intermediate hubs with port hinterlands. Research in Transportation Economics,
27(1), 19–29.
Saleh, F., & LaLonde, B. J. (1972). Industrial buying behaviour and the motor carrier
selection decision. Journal of Purchasing, 8(1), 18–33.
Schellinck, T., & Brooks, M. R. (2014). Improving port effectiveness through deter-
minance/performance gap analysis. Maritime Policy and Management, 41(4),
328–345.
Schellinck, T., & Brooks, M. R. (2016). Developing an instrument to assess seaport
effectiveness in service delivery. International Journal of Logistics: Research and
Applications, 19(2), 143–157.
Talley, W. K. (2006). Port performance: An economics perspective. Research in Trans-
portation Economics, 17, 499–516.
Tongzon, J., & Heng, W. (2005). Port privatization, efficiency and competitive-
ness: Some empirical evidence from container ports (terminals). Transportation
Research Part A: Policy and Practice, 39(5), 405–424.
UNCTAD. (1976). United Nations Conference on Trade and Development, Port per-
formance indicators, TD/B/C.4/131/Supp.1/Rev.1, New York, US.. Available from:
http://unctad.org/en/PublicationsLibrary/tdbc4d131sup1rev1 en.pdf
UNCTAD. (1987). United Nations Conference on Trade and Development. Measuring
and evaluating fort performance and productivity. 6, New York: United Nations:
UNCTAD Monographs on Port Management.
UNCTAD. (2012). United Nations Conference on Trade and Development. Assessing port
performance: Ad hoc expert meeting: Main outcomes and summary of discussions.
Geneva, Palais des Nations, 12 December 2012.. Available from: http://unctad.org/
meetings/en/SessionalDocuments/webdtltlb2013doc1 en.pdf
UNCTAD. (2016). United Nations Conference on Trade and Development. Review of mar-
itime transport 2016.. Available from: http://unctad.org/en/PublicationsLibrary/
rmt2016 en.pdf
180 O. Duru et al. / The Asian Journal of Shipping and Logistics 36 (2020) 169–180
Weigend, G. G. (1956). The problem of hinterland and foreland as illustrated by the
port of Hamburg. Economic Geography, 32(1), 1–16.
Weigend, G. G. (1958). Some elements in the study of port geography. Geographical
Review, 48(2), 185–200.
Woo, S.-H., Pettit, S., & Beresford, A. K. C. (2011). Port evolution and performance
in changing logistics environments. Maritime Economics and Logistics, 13(3),
250–277.
Woo, S. H., Pettit, S., Beresford, A., & Kwak, D. W. (2012). Seaport research: A decadal
analysis of trends and themes since the 1980s. Transport Reviews: A Transnational
Transdisciplinary Journal, 32(3), 351–377.
Woo, S. H., Bang, H. S., Martin, S., & Li, K. X. (2013). Evolution of research themes in
Maritime Policy and Management – 1973–2012. Maritime Policy and Manage-
ment, 40(3), 200–225.

More Related Content

Similar to 1-s2.0-S2092521220300183-main.pdf

A benchmarking study of Indian seaports.pdf
A benchmarking study of Indian seaports.pdfA benchmarking study of Indian seaports.pdf
A benchmarking study of Indian seaports.pdfAnupreet Mavi
 
Container Terminal study
Container Terminal studyContainer Terminal study
Container Terminal studySumit Sharma
 
port Chapter Two.docx
port Chapter Two.docxport Chapter Two.docx
port Chapter Two.docxAbebaw Mamaru
 
The Australian Textile, Clothing And Footwear Essay
The Australian Textile, Clothing And Footwear EssayThe Australian Textile, Clothing And Footwear Essay
The Australian Textile, Clothing And Footwear EssayHeidi Owens
 
בנצ'מרק לעבודת טרמינלים של מכולות
בנצ'מרק לעבודת  טרמינלים של מכולותבנצ'מרק לעבודת  טרמינלים של מכולות
בנצ'מרק לעבודת טרמינלים של מכולותNachum Ganzarski
 
SELECTION OF DRY PORT LOCATION FOR COSCO SHIPPING LINE GHANA COMPANY LIMITED ...
SELECTION OF DRY PORT LOCATION FOR COSCO SHIPPING LINE GHANA COMPANY LIMITED ...SELECTION OF DRY PORT LOCATION FOR COSCO SHIPPING LINE GHANA COMPANY LIMITED ...
SELECTION OF DRY PORT LOCATION FOR COSCO SHIPPING LINE GHANA COMPANY LIMITED ...AkashSharma618775
 
A Review Of The Transportation Mode Choice And Carrier Selection Literature
A Review Of The Transportation Mode Choice And Carrier Selection LiteratureA Review Of The Transportation Mode Choice And Carrier Selection Literature
A Review Of The Transportation Mode Choice And Carrier Selection LiteratureCrystal Sanchez
 
Coastal shipping and CHA Documentation
Coastal shipping and CHA DocumentationCoastal shipping and CHA Documentation
Coastal shipping and CHA Documentationadarshdaz
 
Paper journal of advanced transportation
Paper journal of advanced transportationPaper journal of advanced transportation
Paper journal of advanced transportationpacagnella
 
Efficiency assessment 2325aEFFICIENCY ASSESSMENT OF OFF-DOCK CONTAINER TERMIN...
Efficiency assessment 2325aEFFICIENCY ASSESSMENT OF OFF-DOCK CONTAINER TERMIN...Efficiency assessment 2325aEFFICIENCY ASSESSMENT OF OFF-DOCK CONTAINER TERMIN...
Efficiency assessment 2325aEFFICIENCY ASSESSMENT OF OFF-DOCK CONTAINER TERMIN...AkashSharma618775
 
Ensuring innovative development of the marine transport management system in ...
Ensuring innovative development of the marine transport management system in ...Ensuring innovative development of the marine transport management system in ...
Ensuring innovative development of the marine transport management system in ...Igor Britchenko
 
A decision making support of the most efficient steaming speed for the liner ...
A decision making support of the most efficient steaming speed for the liner ...A decision making support of the most efficient steaming speed for the liner ...
A decision making support of the most efficient steaming speed for the liner ...Alexander Decker
 
Risk Analysis at Ship to Shore (STS) Cranes in Container Terminal Operational...
Risk Analysis at Ship to Shore (STS) Cranes in Container Terminal Operational...Risk Analysis at Ship to Shore (STS) Cranes in Container Terminal Operational...
Risk Analysis at Ship to Shore (STS) Cranes in Container Terminal Operational...IRJET Journal
 
(ReflectionHighlights the need for further research, based on
 (ReflectionHighlights the need for further research, based on (ReflectionHighlights the need for further research, based on
(ReflectionHighlights the need for further research, based onVannaJoy20
 

Similar to 1-s2.0-S2092521220300183-main.pdf (20)

A benchmarking study of Indian seaports.pdf
A benchmarking study of Indian seaports.pdfA benchmarking study of Indian seaports.pdf
A benchmarking study of Indian seaports.pdf
 
Measuring and evaluating port performance and productivity
Measuring and evaluating port performance and productivityMeasuring and evaluating port performance and productivity
Measuring and evaluating port performance and productivity
 
Ijm 06 10_003
Ijm 06 10_003Ijm 06 10_003
Ijm 06 10_003
 
Container Terminal study
Container Terminal studyContainer Terminal study
Container Terminal study
 
port Chapter Two.docx
port Chapter Two.docxport Chapter Two.docx
port Chapter Two.docx
 
The Australian Textile, Clothing And Footwear Essay
The Australian Textile, Clothing And Footwear EssayThe Australian Textile, Clothing And Footwear Essay
The Australian Textile, Clothing And Footwear Essay
 
בנצ'מרק לעבודת טרמינלים של מכולות
בנצ'מרק לעבודת  טרמינלים של מכולותבנצ'מרק לעבודת  טרמינלים של מכולות
בנצ'מרק לעבודת טרמינלים של מכולות
 
SELECTION OF DRY PORT LOCATION FOR COSCO SHIPPING LINE GHANA COMPANY LIMITED ...
SELECTION OF DRY PORT LOCATION FOR COSCO SHIPPING LINE GHANA COMPANY LIMITED ...SELECTION OF DRY PORT LOCATION FOR COSCO SHIPPING LINE GHANA COMPANY LIMITED ...
SELECTION OF DRY PORT LOCATION FOR COSCO SHIPPING LINE GHANA COMPANY LIMITED ...
 
CBI Paper for ISEHP 2016
CBI Paper for ISEHP 2016CBI Paper for ISEHP 2016
CBI Paper for ISEHP 2016
 
A Review Of The Transportation Mode Choice And Carrier Selection Literature
A Review Of The Transportation Mode Choice And Carrier Selection LiteratureA Review Of The Transportation Mode Choice And Carrier Selection Literature
A Review Of The Transportation Mode Choice And Carrier Selection Literature
 
Coastal shipping and CHA Documentation
Coastal shipping and CHA DocumentationCoastal shipping and CHA Documentation
Coastal shipping and CHA Documentation
 
Relational Proximity Management in Maritime Clusters: The Case of Morocco
Relational Proximity Management in Maritime Clusters: The Case of MoroccoRelational Proximity Management in Maritime Clusters: The Case of Morocco
Relational Proximity Management in Maritime Clusters: The Case of Morocco
 
Paper journal of advanced transportation
Paper journal of advanced transportationPaper journal of advanced transportation
Paper journal of advanced transportation
 
India Port Report
India Port ReportIndia Port Report
India Port Report
 
Airport Management: Sustainable Projects to Sustainable Operations
Airport Management: Sustainable Projects to Sustainable OperationsAirport Management: Sustainable Projects to Sustainable Operations
Airport Management: Sustainable Projects to Sustainable Operations
 
Efficiency assessment 2325aEFFICIENCY ASSESSMENT OF OFF-DOCK CONTAINER TERMIN...
Efficiency assessment 2325aEFFICIENCY ASSESSMENT OF OFF-DOCK CONTAINER TERMIN...Efficiency assessment 2325aEFFICIENCY ASSESSMENT OF OFF-DOCK CONTAINER TERMIN...
Efficiency assessment 2325aEFFICIENCY ASSESSMENT OF OFF-DOCK CONTAINER TERMIN...
 
Ensuring innovative development of the marine transport management system in ...
Ensuring innovative development of the marine transport management system in ...Ensuring innovative development of the marine transport management system in ...
Ensuring innovative development of the marine transport management system in ...
 
A decision making support of the most efficient steaming speed for the liner ...
A decision making support of the most efficient steaming speed for the liner ...A decision making support of the most efficient steaming speed for the liner ...
A decision making support of the most efficient steaming speed for the liner ...
 
Risk Analysis at Ship to Shore (STS) Cranes in Container Terminal Operational...
Risk Analysis at Ship to Shore (STS) Cranes in Container Terminal Operational...Risk Analysis at Ship to Shore (STS) Cranes in Container Terminal Operational...
Risk Analysis at Ship to Shore (STS) Cranes in Container Terminal Operational...
 
(ReflectionHighlights the need for further research, based on
 (ReflectionHighlights the need for further research, based on (ReflectionHighlights the need for further research, based on
(ReflectionHighlights the need for further research, based on
 

Recently uploaded

Call Girls Pune Just Call 9907093804 Top Class Call Girl Service Available
Call Girls Pune Just Call 9907093804 Top Class Call Girl Service AvailableCall Girls Pune Just Call 9907093804 Top Class Call Girl Service Available
Call Girls Pune Just Call 9907093804 Top Class Call Girl Service AvailableDipal Arora
 
Catalogue ONG NUOC PPR DE NHAT .pdf
Catalogue ONG NUOC PPR DE NHAT      .pdfCatalogue ONG NUOC PPR DE NHAT      .pdf
Catalogue ONG NUOC PPR DE NHAT .pdfOrient Homes
 
BEST Call Girls In Old Faridabad ✨ 9773824855 ✨ Escorts Service In Delhi Ncr,
BEST Call Girls In Old Faridabad ✨ 9773824855 ✨ Escorts Service In Delhi Ncr,BEST Call Girls In Old Faridabad ✨ 9773824855 ✨ Escorts Service In Delhi Ncr,
BEST Call Girls In Old Faridabad ✨ 9773824855 ✨ Escorts Service In Delhi Ncr,noida100girls
 
7.pdf This presentation captures many uses and the significance of the number...
7.pdf This presentation captures many uses and the significance of the number...7.pdf This presentation captures many uses and the significance of the number...
7.pdf This presentation captures many uses and the significance of the number...Paul Menig
 
Call Girls In Radisson Blu Hotel New Delhi Paschim Vihar ❤️8860477959 Escorts...
Call Girls In Radisson Blu Hotel New Delhi Paschim Vihar ❤️8860477959 Escorts...Call Girls In Radisson Blu Hotel New Delhi Paschim Vihar ❤️8860477959 Escorts...
Call Girls In Radisson Blu Hotel New Delhi Paschim Vihar ❤️8860477959 Escorts...lizamodels9
 
Insurers' journeys to build a mastery in the IoT usage
Insurers' journeys to build a mastery in the IoT usageInsurers' journeys to build a mastery in the IoT usage
Insurers' journeys to build a mastery in the IoT usageMatteo Carbone
 
Pharma Works Profile of Karan Communications
Pharma Works Profile of Karan CommunicationsPharma Works Profile of Karan Communications
Pharma Works Profile of Karan Communicationskarancommunications
 
Call Girls In Connaught Place Delhi ❤️88604**77959_Russian 100% Genuine Escor...
Call Girls In Connaught Place Delhi ❤️88604**77959_Russian 100% Genuine Escor...Call Girls In Connaught Place Delhi ❤️88604**77959_Russian 100% Genuine Escor...
Call Girls In Connaught Place Delhi ❤️88604**77959_Russian 100% Genuine Escor...lizamodels9
 
Enhancing and Restoring Safety & Quality Cultures - Dave Litwiller - May 2024...
Enhancing and Restoring Safety & Quality Cultures - Dave Litwiller - May 2024...Enhancing and Restoring Safety & Quality Cultures - Dave Litwiller - May 2024...
Enhancing and Restoring Safety & Quality Cultures - Dave Litwiller - May 2024...Dave Litwiller
 
Vip Female Escorts Noida 9711199171 Greater Noida Escorts Service
Vip Female Escorts Noida 9711199171 Greater Noida Escorts ServiceVip Female Escorts Noida 9711199171 Greater Noida Escorts Service
Vip Female Escorts Noida 9711199171 Greater Noida Escorts Serviceankitnayak356677
 
Keppel Ltd. 1Q 2024 Business Update Presentation Slides
Keppel Ltd. 1Q 2024 Business Update  Presentation SlidesKeppel Ltd. 1Q 2024 Business Update  Presentation Slides
Keppel Ltd. 1Q 2024 Business Update Presentation SlidesKeppelCorporation
 
RE Capital's Visionary Leadership under Newman Leech
RE Capital's Visionary Leadership under Newman LeechRE Capital's Visionary Leadership under Newman Leech
RE Capital's Visionary Leadership under Newman LeechNewman George Leech
 
GD Birla and his contribution in management
GD Birla and his contribution in managementGD Birla and his contribution in management
GD Birla and his contribution in managementchhavia330
 
2024 Numerator Consumer Study of Cannabis Usage
2024 Numerator Consumer Study of Cannabis Usage2024 Numerator Consumer Study of Cannabis Usage
2024 Numerator Consumer Study of Cannabis UsageNeil Kimberley
 
Lowrate Call Girls In Laxmi Nagar Delhi ❤️8860477959 Escorts 100% Genuine Ser...
Lowrate Call Girls In Laxmi Nagar Delhi ❤️8860477959 Escorts 100% Genuine Ser...Lowrate Call Girls In Laxmi Nagar Delhi ❤️8860477959 Escorts 100% Genuine Ser...
Lowrate Call Girls In Laxmi Nagar Delhi ❤️8860477959 Escorts 100% Genuine Ser...lizamodels9
 
Monte Carlo simulation : Simulation using MCSM
Monte Carlo simulation : Simulation using MCSMMonte Carlo simulation : Simulation using MCSM
Monte Carlo simulation : Simulation using MCSMRavindra Nath Shukla
 
Call Girls In Sikandarpur Gurgaon ❤️8860477959_Russian 100% Genuine Escorts I...
Call Girls In Sikandarpur Gurgaon ❤️8860477959_Russian 100% Genuine Escorts I...Call Girls In Sikandarpur Gurgaon ❤️8860477959_Russian 100% Genuine Escorts I...
Call Girls In Sikandarpur Gurgaon ❤️8860477959_Russian 100% Genuine Escorts I...lizamodels9
 
VIP Kolkata Call Girl Howrah 👉 8250192130 Available With Room
VIP Kolkata Call Girl Howrah 👉 8250192130  Available With RoomVIP Kolkata Call Girl Howrah 👉 8250192130  Available With Room
VIP Kolkata Call Girl Howrah 👉 8250192130 Available With Roomdivyansh0kumar0
 

Recently uploaded (20)

Call Girls Pune Just Call 9907093804 Top Class Call Girl Service Available
Call Girls Pune Just Call 9907093804 Top Class Call Girl Service AvailableCall Girls Pune Just Call 9907093804 Top Class Call Girl Service Available
Call Girls Pune Just Call 9907093804 Top Class Call Girl Service Available
 
Catalogue ONG NUOC PPR DE NHAT .pdf
Catalogue ONG NUOC PPR DE NHAT      .pdfCatalogue ONG NUOC PPR DE NHAT      .pdf
Catalogue ONG NUOC PPR DE NHAT .pdf
 
BEST Call Girls In Old Faridabad ✨ 9773824855 ✨ Escorts Service In Delhi Ncr,
BEST Call Girls In Old Faridabad ✨ 9773824855 ✨ Escorts Service In Delhi Ncr,BEST Call Girls In Old Faridabad ✨ 9773824855 ✨ Escorts Service In Delhi Ncr,
BEST Call Girls In Old Faridabad ✨ 9773824855 ✨ Escorts Service In Delhi Ncr,
 
7.pdf This presentation captures many uses and the significance of the number...
7.pdf This presentation captures many uses and the significance of the number...7.pdf This presentation captures many uses and the significance of the number...
7.pdf This presentation captures many uses and the significance of the number...
 
Call Girls In Radisson Blu Hotel New Delhi Paschim Vihar ❤️8860477959 Escorts...
Call Girls In Radisson Blu Hotel New Delhi Paschim Vihar ❤️8860477959 Escorts...Call Girls In Radisson Blu Hotel New Delhi Paschim Vihar ❤️8860477959 Escorts...
Call Girls In Radisson Blu Hotel New Delhi Paschim Vihar ❤️8860477959 Escorts...
 
Insurers' journeys to build a mastery in the IoT usage
Insurers' journeys to build a mastery in the IoT usageInsurers' journeys to build a mastery in the IoT usage
Insurers' journeys to build a mastery in the IoT usage
 
Pharma Works Profile of Karan Communications
Pharma Works Profile of Karan CommunicationsPharma Works Profile of Karan Communications
Pharma Works Profile of Karan Communications
 
Call Girls In Connaught Place Delhi ❤️88604**77959_Russian 100% Genuine Escor...
Call Girls In Connaught Place Delhi ❤️88604**77959_Russian 100% Genuine Escor...Call Girls In Connaught Place Delhi ❤️88604**77959_Russian 100% Genuine Escor...
Call Girls In Connaught Place Delhi ❤️88604**77959_Russian 100% Genuine Escor...
 
Enhancing and Restoring Safety & Quality Cultures - Dave Litwiller - May 2024...
Enhancing and Restoring Safety & Quality Cultures - Dave Litwiller - May 2024...Enhancing and Restoring Safety & Quality Cultures - Dave Litwiller - May 2024...
Enhancing and Restoring Safety & Quality Cultures - Dave Litwiller - May 2024...
 
Vip Female Escorts Noida 9711199171 Greater Noida Escorts Service
Vip Female Escorts Noida 9711199171 Greater Noida Escorts ServiceVip Female Escorts Noida 9711199171 Greater Noida Escorts Service
Vip Female Escorts Noida 9711199171 Greater Noida Escorts Service
 
Keppel Ltd. 1Q 2024 Business Update Presentation Slides
Keppel Ltd. 1Q 2024 Business Update  Presentation SlidesKeppel Ltd. 1Q 2024 Business Update  Presentation Slides
Keppel Ltd. 1Q 2024 Business Update Presentation Slides
 
RE Capital's Visionary Leadership under Newman Leech
RE Capital's Visionary Leadership under Newman LeechRE Capital's Visionary Leadership under Newman Leech
RE Capital's Visionary Leadership under Newman Leech
 
GD Birla and his contribution in management
GD Birla and his contribution in managementGD Birla and his contribution in management
GD Birla and his contribution in management
 
2024 Numerator Consumer Study of Cannabis Usage
2024 Numerator Consumer Study of Cannabis Usage2024 Numerator Consumer Study of Cannabis Usage
2024 Numerator Consumer Study of Cannabis Usage
 
Lowrate Call Girls In Laxmi Nagar Delhi ❤️8860477959 Escorts 100% Genuine Ser...
Lowrate Call Girls In Laxmi Nagar Delhi ❤️8860477959 Escorts 100% Genuine Ser...Lowrate Call Girls In Laxmi Nagar Delhi ❤️8860477959 Escorts 100% Genuine Ser...
Lowrate Call Girls In Laxmi Nagar Delhi ❤️8860477959 Escorts 100% Genuine Ser...
 
Monte Carlo simulation : Simulation using MCSM
Monte Carlo simulation : Simulation using MCSMMonte Carlo simulation : Simulation using MCSM
Monte Carlo simulation : Simulation using MCSM
 
Best Practices for Implementing an External Recruiting Partnership
Best Practices for Implementing an External Recruiting PartnershipBest Practices for Implementing an External Recruiting Partnership
Best Practices for Implementing an External Recruiting Partnership
 
Call Girls In Sikandarpur Gurgaon ❤️8860477959_Russian 100% Genuine Escorts I...
Call Girls In Sikandarpur Gurgaon ❤️8860477959_Russian 100% Genuine Escorts I...Call Girls In Sikandarpur Gurgaon ❤️8860477959_Russian 100% Genuine Escorts I...
Call Girls In Sikandarpur Gurgaon ❤️8860477959_Russian 100% Genuine Escorts I...
 
KestrelPro Flyer Japan IT Week 2024 (English)
KestrelPro Flyer Japan IT Week 2024 (English)KestrelPro Flyer Japan IT Week 2024 (English)
KestrelPro Flyer Japan IT Week 2024 (English)
 
VIP Kolkata Call Girl Howrah 👉 8250192130 Available With Room
VIP Kolkata Call Girl Howrah 👉 8250192130  Available With RoomVIP Kolkata Call Girl Howrah 👉 8250192130  Available With Room
VIP Kolkata Call Girl Howrah 👉 8250192130 Available With Room
 

1-s2.0-S2092521220300183-main.pdf

  • 1. The Asian Journal of Shipping and Logistics 36 (2020) 169–180 Contents lists available at ScienceDirect The Asian Journal of Shipping and Logistics HOSTED BY journal homepage: www.elsevier.com/locate/ajsl Original Article Developing a comprehensive approach to port performance assessment Okan Durua , Cassia B. Galvaob,∗ , Joan Mileskib , Leo Tadeu Roblesc , Amir Gharehgozlid a Nanyang Technological University, Singapore b Texas A&M University at Galveston, TX, USA c Universidade Federal do Maranhao – UFMA, Brazil d California State University, CA, USA a r t i c l e i n f o Article history: Received 5 April 2019 Received in revised form 5 February 2020 Accepted 3 March 2020 Keywords: Port performance Port stakeholders Quality function deployment a b s t r a c t This paper investigates the port performance assessment and proposes a comprehensive framework with various perspectives as well as priority distributions of stakeholders’ expectations in port busi- ness and operations. One fundamental questions in port performance studies is how to evaluate and quantify intangible indicators on performance. There are definitely inputs and outputs, which may be measured and evaluated through conventional instruments. However, each instrument deals with a par- ticular aspect of whole performance problem (e.g. port efficiency, port productivity,), and many of these instruments are limited to ‘measurable’ data on port management and operations. In this paper, these two common problems are put under the scope, and a comprehensive port performance assessment scheme is established by gathering various perspectives. Quality function deployment (QFD) approach is preferred to formulize the problem and define priority ratings of expectations by each stakeholder in the port domain. The framework can contribute to a broader understanding of ports as business units, its development drivers and interaction with community neighbors, and to shed light to port performance assessment considering both public and private entities. © 2020 The Authors. Production and hosting by Elsevier B.V. This is an open access article under the CC BY-NC-ND license (http://creativecommons.org/licenses/by-nc-nd/4.0/). 1. Introduction Port performance indicators is not a new topic for port managers nor maritime scholars. In the late 1970s, the UN agency UNCTAD proposed that signatory countries should adopt and follow cer- tain port performance indicators (UNCTAD, 1976; UNCTAD, 1987). The idea behind it was straightforward: to be able to measure in order to improve port performance. This fell immediately within UNCTAD’s mission of promoting trade facilitation that enhances economic development. Ports are a key element for merchandize trade transaction to take place. In this sense, UNCTAD has dedicated a specialized team of experts to follow up on the port performance indicators. More recently, UNCTAD has proposed a port perfor- mance scorecard as part of their port training program to combine a set of indicators to refine assessment and benchmarking capa- bility for senior port managers. The main idea of this program is to bring the industry and academic perspectives together in ∗ Corresponding author. Peer review under responsibility of the Korean Association of Shipping and Logistics, Inc. terms of port performance in order to share best practices among port managers, particularly from developing countries (UNCTAD, 2012). Those indicators were predominantly associated with termi- nal operational efficiencies generally based on volume throughput (movements per crane, per hour; berth utilization rates; labor ratio per TEU are some of the main indicators). Some of those termi- nals, given the nature of the capital structure also allowed for some financial performance analysis generally based on annual statement and reports. Although insightful for terminal managers, those indicators focused a specific aspect (Economic) of port per- formance, not including other dimensions equally important in the port activity, such as the social, environmental and political. Brooks and Cullinane (2007) have argued that port performance has a strong correlation with the concepts of governance and devolution programs. Further, Brooks and Cullinane (2007) have made an effort toward a clear cut of port performance measure- ments and definitions for port managers and scholars under the business perspective. More recently Brooks, Cullinane, and Pallis (2017) have revisited the port governance issues with focus on the port reform processes and less on port efficiency measure- ments. Furthermore, various studies and investigations have aimed to measure and to access port performance. In maritime business, https://doi.org/10.1016/j.ajsl.2020.03.001 2092-5212 © 2020 The Authors. Production and hosting by Elsevier B.V. This is an open access article under the CC BY-NC-ND license (http://creativecommons.org/licenses/ by-nc-nd/4.0/).
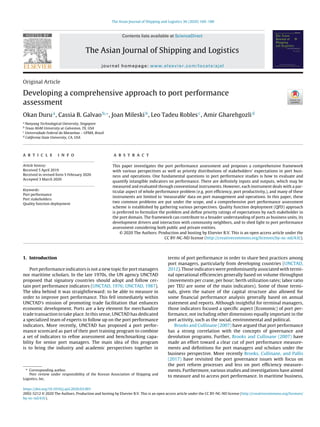
  • 2. 170 O. Duru et al. / The Asian Journal of Shipping and Logistics 36 (2020) 169–180 Fig. 1. Port efficiency, effectiveness and productivity. Source: (Esmer et al, 2019) the typical performance measures approach takes in considera- tion the economics only. The economic operational level typically uses static indicators to measure performance such as: Utilization (= Actual Input/Design Input Capacity, Max. Input); Port Produc- tivity (= Actual Output/Effective Input Capacity); Port Efficiency (= Actual Input/Effective Input Capacity). Port Effectiveness (= Actual Output/Effective Input Capacity); Port Effectiveness (management) (= ‘Qualified’ Actual Output/Effective Input Capacity) (Fig. 1). One of the main issues that rise from these definitions is related to the data availability. That is, in the absence of actual input, researchers end up using capacity figures (Esmer et al, 2019aaaaaaaaaaa). Another consequence of the lacking data is that a great share of the research is done based on containers volumes throughput, however still two-thirds of world merchandize trade is of bulk cargo (UNCTAD, 2016). Thus, if port performance measures are concentrated in effi- ciency measurements and are predominantly using the economic approach with using static data, how could the port performance be measured using a more comprehensive approach with multiple lenses (not only economic)? How does port performance follow the port strategy? Are there inconsistencies between efficiencies and effectiveness? These are some of the orientation questions for this study. In this study, we argue that port performance assessment should be done under multiple lenses for three main reasons. First, based on the evidences we have observed in an in-depth literature review the economic perspective. Second, the predominant busi- ness orientation in the port performance assessment. And third, considering more recent issues in port developments, such as the need for port expansion due to increasing volume throughput; the complexification of logistics’ networks; and the changes in the governance. That is, beyond the microeconomic aspects, the development of a comprehensive approach to port performance assessment should be able to include other strategic dimensions such as social, political and business ethics. This framework can be applied in different levels of analysis, which are from the strategy, to operational and technical levels. In the port reality, these levels would correspond to city/region, port and terminals. In this sense, this paper objective is to identify conceptual gaps in the literature and with a theoretical approach, assessing it with different perspectives about the concept of port perfor- mance. In order to propose a more comprehensive framework this paper consider four main forces corresponding to strategic dimensions (social, economic, political and business ethics, which included the environmental dimension). The study methodology is based on three steps. First, we conducted an in-depth literature review studies about port performance, analyzing and investi- gating their main approaches and methods. Second, we deploy a comprehensive assessment instrument is developed by using the quality function deployment (QFD) methodology. The QFD method is a diagnostic toolbox generally used in manufacturing industries; however, it is also applied to services sectors identifying possi- ble threats and opportunities (or gaps) about design, production and operation processes regarding overall expectations of cus- tomers. QFD, in a port context, can also be defined as a system for translating customer (public and private agents/users) require- ments/expectations into appropriate port (entity) deliverables at each stage from research and service development to engineer- ing and operation and finally to marketing/sales strategies. Third, a pilot study is used to illustrate the application of the QFD princi- ples as a more comprehensive method to access port performance beyond the static data.
  • 3. O. Duru et al. / The Asian Journal of Shipping and Logistics 36 (2020) 169–180 171 2. The port performance overview in the research agenda The literature review conducted focused on two main aspects. First, we situate port performance as a topic on Maritime Transportation literature. Second, we identify the typical port per- formance measurements in seminal contributions of researchers in the field. Pallis, Vitsounis, and De Langen (2010), Pallis, Vitsounis, De Langen, and Notteboom (2011) have considered the research on economics, policy and management of ports published from year 1997 to 2008. In their classification study they found that “port competition and competitiveness” were prevalent in the period 2002–2006, while the themes of “port governance”, “port plan- ning and development” and “port policy and regulation” were most studied in 1997–2001. In the 2007–2008 period it was also noted that there was a rise of “ports in the transport and supply chain.” The results shown three main conclusions: First, almost half of the studies are focused on the containers and/or container ter- minals, while other goods (bulk, vehicles, and passenger) are not represented or are five percent of published papers. Second, the ports studies within the logistics chain has grown considerably; and thirdly, the academic community is characterized by being in a pre-paradigmatic stage, which consist of a set of small groups of researchers with limited references to each other’s research. The research of Pallis et al. (2010) also indicated that in the period from 1997 to 2008 almost half of the papers on ports were published in a limited venue through to the International Association of Mar- itime Economists (e.g. Maritime Policy and Management and Maritime Economics and Logistics). The research of Woo, Pettit, Beresford, and Kwak (2012) aimed at presenting a structured literature review on ports studies for the period from 1980 to 2009. The research used content analysis techniques to classify the eight hundred and forty papers identified in eight major themes. The authors concluded by stating that the future of the ports research agenda should be guided not only by the demands of the industry, but by development of methodologies and theories, in view of the complexity of port management. Woo, Bang, Martin, and Li (2013) as well as Notteboom, Pallis, De Langen, and Papachristou (2013) had similar research objec- tive which was to analyze the content of papers published over the forty years of the journal, Maritime Policy and Management, (1973–2012). Woo et al. (2013) stems from the assumption that the issues related to shipping were initially dominant while the issues of ports were of increasing interest to researchers later. The authors divided the time frame in four periods (1973–1979; 1980–1989; 1990–1999 and 2000–2012). The results highlight the followings. First, Economics remains as predominant field with about thirty- five percent of all the published papers, but Management field has greatly increased, particularly in the 2000s. Second, “conceptual work” has the largest share in methodologies applied (35.1% or 345 of the 984 papers). However, authors noted that the methodologies applied were becoming more sophisticated with advancing com- puter techniques that allowed usage statistics and mathematical models, with number of publications growing in the 2000s. In second part of our literature review, we have identified the researchers that have presented seminal contributions in the study of port efficiency measurements. Efficiency remains a priority for port managers even though a port’s performance is multifaceted and is no longer limited to internal processes (Woo, Pettit, and Beresford, 2011). Roll and Hayuth (1993) are pioneer in establishing research efforts to identify and execute port efficiency performance benchmarking. In Roll and Hayuth (1993) research, DEA is pre- sented as new methodology for measuring port performance, as it provides a relative efficiency rating in the analyzed units and no ‘standard references’ or indexes are required. The paper however, works with hypothetical data and not real port cases. Liu’s (1995) study compares public and private enterprises in the UK port using the Stochastic Frontier analysis (SFA) model referenc- ing the port efficiency measured by a frontier production function. The results did not show clear-cut ownership (private or public) as relevant factor in the efficiency outcome for the period of analysis. In the case of Tongzon and Heng (2005), they have also studied the relationship of ownership and efficiency adding to the stochas- tic frontier model a principal component analysis (PCA) so that the key factors on port competitiveness could be examined. The results indicated that private sector participation can improve the opera- tional efficiency. The limitations of the paper include the fact that only container terminals were studied. Talley (2006) showed that port performance should be mea- sured also by the economic perspective (cost function) rather than the engineering (volume throughput) as volume is limited by the technical efficiency. The author points out that DEA is a consol- idated technique to measure the relative technical efficiency of ports, applied in different cases around the world. Talley (2006) also called attention to the importance of measuring port perfor- mance over time (single port) and in relative terms (multi ports analysis). The efforts of Cullinane and Wang (2006a) were dedi- cated to demonstrating the relevance of DEA in the port industry. Their scope of analysis was also the container terminals, but the most interesting result of their investigation was that “the optimum efficiency levels indicated by DEA results might not be achievable in reality, because each individual port has its own specific and unique context (2006, p. 517).” Bichou (2006) recognized that despite all the advances made in port performance metrics, there was still a big gap in measur- ing the ports performance’s integration in the supply chains they are inserted. The paper presented a tested model and other cases are offered as illustration. The investigation by Brooks (2006) is a genuine in presenting the links between port performance and the devolution process in the literature with strategic management insights. The study from De Langen et al. (2007) is authentic in the sense that they also criticize the traditional performance indicator using volume throughput, and they give a concrete contribution pointing out alternative PPI (port performance indicator) that can be used. They also indicate ports that are already collecting data for these alternative PPI, as well as they name the interest of stakeholders and benefits for the port authorities in analyzing these alternative indicators. Relevant for this study is the new PPI they suggest for socio-environmental stakeholders. The investigation by Gonzalez and Trujillo (2009) is perhaps one of the most comprehensive review on port efficiency measure- ments. The paper’s scope is limited to economic productivity and efficiency of ports and as such, the authors give a great contribution to show the dominance of the Economics (as field) and Statistics (as methodology and model) of port performance analysis in the 1995–2006 period. The authors give also a relevant insight for pol- icy makers, pointing the need of closer follow up of corresponding authorities of port data collection. Port efficiency is also studied at the operational level. For exam- ple, multiple papers have focused on the use of operations research models for handling (containerized) cargo (Gharehgozli, Roy, & De Koster, 2016; Gorman et al., 2014). In general, the business literature covers the strategy levels, while the port literature is dominated by the economic operational level. In this sense, the research from Notteboom et al. (2013) gives another relevant con- tribution, as in their aim to understand the extend and scope of port research agenda, their conclusions go toward overcoming three challenges pointed out by the authors. First, avoid fragmentation of the studies that generate lack of consistency and breakdown of long-term research agenda; Second, overcome the tendency to neglect the construction of theories that is to deal with the
  • 4. 172 O. Duru et al. / The Asian Journal of Shipping and Logistics 36 (2020) 169–180 Fig. 2. Stakeholders: Mix and cross-over of economic, social, political, legal environmental/ecological, and technical pressures for seaport resilience. Source: Gharehgozli, Mileski, Adams, and Von Zharen (2017c). pressure for publication that direct the research for applied or cases studies. Third has to do with the relationship of researchers and policy-makers bearing in mind the relevance and rigor of port related research: “Scholars tend to focus on making progress in specific research disciplines whereas decision and policy-makers are interested in the overall operation of ports, i.e. in economic, land-use planning and environmental aspects.” (2013, p. 651) The brief literature review performed here shows that there is gap in the literature in a sense that there exists no paper with a comprehensive approach to discuss whether efficient ports are also effective. Until recently, the only research done on port focused was from a decade ago on port choice (Hao, 2007). This is surprising, since research on effectiveness has a long history beginning with research on transport carrier choice using service attributes in the 1970s and early 1980s (see, for example, Saleh and LaLonde (1972); McGinnis (1978); Brooks (1985); LaLonde and Cooper (1989)). Fur- thermore, the handful discussions on port effectiveness do not specify whether the criteria considered are at the strategic, tactical or operational level. In fact, a quick review of the efficiency liter- ature shows that they have been focused on the operational level. Finally, the papers which focus on the differences of port effec- tiveness and efficiency tend to focus on a specific stakeholder and dismiss the other ones. The research efforts leave us with three key points for our investigation: there is an increasing interest for port performance indicators and assessment; port performance is predominantly measured within the economic parameters; and there is a chronic lack of data availability on the port level, as the information is typically provided by the individual terminals. From the literature it is well documented that the port reform wave of the 1990s has led scholars to seek for performance indica- tors focused on efficiency. However, how is it possible to measure port efficiency if the full data set is not available and if multiple stakeholders are involved in the process? What if the multiple KPIs (key performance indicators) have incompatible (or even contro- versial) reference indexes? What if the efficiency optimization is not leading to port effectiveness? These are just some of the common questions that arise from a more critical perspective of port performance analysis. Port effec- tiveness is out of the scope of this paper, but is a good example of a relevant topic that has received much less attention than port efficiency, as evidenced in the recent research from Brooks, Schellinck, and Pallis (2011a, 2011b); Brooks and Schellinck (2013); and Schellinck and Brooks (2014), Schellinck and Brooks (2016). 3. The port performance in four dimensions: The theoretical background The stakeholders’ literature is not new in corporate governance (Freeman & Reed, 1983), the incorporation of the stakeholders in
  • 5. O. Duru et al. / The Asian Journal of Shipping and Logistics 36 (2020) 169–180 173 Fig. 3. An overview of the port performance assessment process. Source: Authors’ own elaboration. the port governance studies is relatively new if comparted to port performance indicators as reviewed in the previous section. The port stakeholders’ studies have in general the focus on the stakeholders’ management, considering their different interplay forces (Notteboom & Winkelmans, 2003) or their conflicting inter- ests (De Langen, Nidjam, & Van der Horst, 2007; Galvao, Wang, & Mileski, 2016; Parola & Maugeri, 2013). In the cases of Lam, Ng, and Fu (2013); Cruz, Ferreira, and Azevedo (2013) and Dooms (2014) the authors have built on the stakeholder analysis to provide a framework of analysis that links stakeholders to governance issues. Within a port, two different sets of people act as stakehold- ers: those who directly use, regulate, maintain, and police the port, and those who indirectly benefit or are otherwise affected by the activities of the port. Fig. 2 provides an example of some of the stakeholders in the analysis that may influence or exert pressure on. Port performance must be analyzed by keeping in mind both the stakeholders inside and outside the port perimeter. In any of those cases studied in our review of port stakeholders’ literature we could notice that researchers have not necessarily found new stakeholders in the port context, but their interrelation became more complex as the port business developed to inte- grate supply chains and robust logistics operations. In this sense, our study has considered that besides the economic dimension, which shall remain as the main driver, there are at least three other dimensions that should be incorporated for a more comprehen- sive port performance assessment. The novelty we present here is the link between port stakeholders’ expectations and the port per- formance measures and concepts. The ‘comprehensive’ framework refers to encapsulating of various aspects as well as a compro- mised assessment. Building a ‘stakeholder neutral’ perspective is obviously impossible. None of assessments would satisfy all stake- holders for all of their desires. A performance assessment is conventionally expected to rep- resent a certain point of view. From the perspective of a terminal operator, any strategies that reduces costs may be feasible while some of these strategies may dissatisfy e.g. society (e.g. environ- mental concerns originated from cheap but harmful equipment). However, a compromised assessment can be developed based on a predefined priority degree of major stakeholders while the debate raises on the definition of priority. The pilot study in Section 5 illustrates two cases including priority-based and priority neutral assessment, so one may compare both types of allocation. Based on the initial discussions of Notteboom and Winkelmans (2003) on stakeholders’ management and, also on the more recent research of Dooms (2014) about integrating the three “Ps” (profit, people and planet) in the performance bottom line, we consider that social and environmental aspects have to be part of the port performance assessment considering the nature of port activities and the ethics that its business should follow in an international competitive environment. In addition, the port reform ‘wave’ from the 1990s with subsequent changes in the governance (Brooks & Cullinane, 2007) leave no doubts that regulation and legislation have to be considered in any performance assessment of ports. In other words, this means while the economic dimension includes any financial and operational efficiency measurements, the social, ethic and political dimensions have to take into account the port as a dynamic activity that brings impact to the location (environmental and community) at the same time it is impacted by national and international circumstances (trade, regulation and development). At a glance, we have that: The Social dimension is related to labor, impact on community, people and culture; the Political dimension has to do with regulation, law, policies and gov- ernance; the Ethics dimension can consider many different aspects of the social and environmental responsibilities; and Economics is related to the profit and resources required in the port business. These four dimensions (economic, social, political and ethics) can be applied in different levels of analysis, that is from the strategy, to operational and technical levels. In the port reality, these levels correspond to city/region, port and terminals. As such, our hypothesis is that a port is performing well when these four dimensions are fulfilled. The next questions are then, what are the indicators to examine in each dimension? What are the parameters to consider and how to balance them? In order to be able to answer these questions, we have to bear in mind the different groups of stakeholders and their specific interest in the port performance. 4. Measurement and quantification in port performance The assessment process consists of four main steps as parts of the QFD approach. In the first step, the stakeholders were iden- tified. In the second step, the criteria that satisfy performance perception of each group were defined. Those criteria must be com- prehensive and independent. If two criteria are dependent, then they have to be combined and labeled again. In the third step, the technical measures corresponding to the criteria were iden- tified. Technical measures must be “measurable”, “tangible” and must have a unit (i.e. KPIs). Furthermore, a technical measure can be a binary question such as quality management system exists or not. Finally, the level of contribution of each technical mea- sure to each criterion were estimated. Furthermore, the importance level of each criterion were identified (priority of each criteria). As a result, we will see how each technical measure contributes to
  • 6. 174 O. Duru et al. / The Asian Journal of Shipping and Logistics 36 (2020) 169–180 Table 1 Stakeholders & expectations in port and terminal business. S1 Terminal Operators (incl. Owners and Investors) Notes E1.1 Profitability/Earnings Higher operating returns, less operating cost E1.2 Customer Loyalty (Business Sustainability) Customer commitment and long-term contracts E1.3 Credibility/Financial Reputation Financial strength and higher credit rating E1.4 Publicity/Brand Value General reputation, brand equity, goodwill E1.5 Responsive and Professional Public Institutions Port authority, landlord, public administration E1.6 Safe and secure cargoes and their contents E1.7 Safe and secure on board operations at berth Operations managed by ships and their officers E1.8 Proper pilotage/tug services 7/24 service, proper number of tugs E1.9 Hinterland/Foreland architecture and plasticity Flexibility of backyard for development prospects S2 Cargo owners E2.1 Safe and secure handling of cargo E2.2 Less transit time (quick service) E2.3 Cheaper service (right pricing) E2.4 Smooth and quick customs procedure E2.5 Convenience/Flexibility of storage facilities (early drop-off and late pick-up) E2.6 Less and reduced carbon footprint S3 Shipping firms (shipowners) E3.1 Less transit time (mooring, cargo handling) E3.2 Safe cargo handling E3.3 Lower terminal fees E3.4 Convenient/safe terminal location E3.5 Less and reduced carbon footprint S4 Inland carriers (incl. Logistics firms, trucking and rail transport firms) E4.1 Less transit time (handling, gate operations) E4.2 Convenience/flexibility of parking facilities E4.3 Smooth and quick customs procedure E4.4 Convenience of transport infrastructure S5 Local and national government (incl. landlords/port authorities) E5.1 Terminal security E5.2 Safe terminal operations E5.3 Social responsibility E5.4 Compliance with labor standards E5.5 Responsiveness to government inquiries (e.g. data sharing) E5.6 Transparency and proper communication E5.7 Competitiveness and growth (developmental attitude) E5.8 Less and reduced carbon footprint S6 Global and supra-national regulators E6.1 Terminal security E6.2 Safe terminal operations E6.3 Compliance with labor standards E6.4 Less and reduced carbon footprint S7 Society/citizens E7.1 Terminal security E7.2 Safe terminal operations E7.3 Social responsibility E7.4 Compliance with labor standards E7.5 Transparency and proper communication E7.6 Less and reduced carbon footprint E7.7 Positive and adaptive port-city connection S8 Workers/labor (internal customer) E8.1 Compliance with labor standards (working environment) E8.2 Higher salary scale and benefits E8.3 Social security E8.4 Relevant facilities and training opportunities Source: Authors’ own elaboration. satisfaction/dissatisfaction of a particular stakeholder or its expec- tation. Fig. 3 gives an overview of the framework (QFD method and its application will be discussed below with the pilot study). In the first phase of this study (i.e. Step 1 and 2), an extensive content analysis process was followed mainly with in-depth sys- tematic literature review (as built in sections 2 and 3) and authors’ assessment of contents (keyword based) of port performance stud- ies (PPRN, 2019),1 and finally a list of major stakeholders and their expectations from port services were gathered in Table 1. 1 PPRN (Port Performance Research Network) is a group founded within the IAME (International Association of Maritime Economists) to investigate port performance In this paper, a more functional classification as presented on Table 1 was preferred considering latter part of the study in which we investigated interactions and cause-effect linkages between measures/indicators and stakeholders’ interest. In con- trast to previous studies, this paper goes a step forward and classifies major expectations of each stakeholder to clarify the sub- set of requirements. Expectations of each stakeholder (coded as Ex.x) also rephrase the definition and attributed meaning which eliminates the semantic miscommunication. For example, instead in focus. It was created in 2001 by academic researchers and its meetings and author publication include maritime industry members and practioners.
  • 7. O. Duru et al. / The Asian Journal of Shipping and Logistics 36 (2020) 169–180 175 Fig. 4. Traditional format of the House of Quality (HoQ). Source: Akao (2004). of using “safety” or “location” a general expectation of all stake- holders, we have phrased them to meet each stakeholder point of view associated with that variable. 4.1. The Hinterland and Foreland Plasticity In this paper, we propose a new concept in port studies, the Hin- terland and Foreland Plasticity (See E1.9). Hinterland conventionally refers to all transport facilities and industrial end users (i.e. stake- holders) behind ports while foreland refers to maritime transport networks and connections in the sea side of ports. The first con- ventional use of the term, foreland, goes back to 1950s (Weigend, 1956, 1958). Weigend (1958) investigated the term from a seman- tic and bibliometric perspective and distinguished hinterland and foreland through their fundamental differences. The modern inter- pretation of the foreland concept was investigated in Notteboom and Rodrigue (2005) as well as Rodrigue and Notteboom (2010) based on the port regionalization problem. According to Rodrigue and Notteboom (2010), port regionalization is not only a process in hinterland, but it is also the evolution of foreland through cooper- ation among regional ports. The concept of the hinterland and foreland plasticity refers to three fundamental features. First, ports extend their operations and business backward to intermediate hubs and hinterland in general. Many ports have been built in developing stages of their regions and countries, and cities behind those ports have enlarged and spread out through the connection between ports and hinterlands. Eventually, ports have significant difficulty to find suitable land and facilities to expend their operations and business. In this circum- stance, plasticity refers to the capacity and flexibility of hinterland for expansion without tackling with the city at the background. Sec- ond, the plasticity of hinterland may refer to intermodal capacity and flexibility. Development and expansion of ports typically need the development of transport infrastructure between hinterland and ports as well as other destinations in the network (i.e. fore- land). In some cases, port development is restricted by inability to develop transport infrastructure, and that is classified as another dimension of the plasticity. In addition to above mentioned costs of inaccurate city and port planning, the plasticity of hinterland in terms of political and social aspects is the third fundamental feature of the term.2 Although the third dimension is more about the hinterland, it emphasizes the adoption and tolerance by local community and public policy. 4.2. Defining customer and seller (service provider) Regarding a comprehensive port performance framework, there is no ‘port-centric’ definition of service provider which external- izes all other stakeholders and labels as ‘customer’ (stakeholder neutrality principle). The society and citizens of a region or coun- try definitely value and benefit themselves from port services due facilitated trading activities and contributions to the region. There- fore, the relationship between stakeholders is not unidirectional from all stakeholders to ports and terminals, but it is actually mul- tifaceted and it can be seen as a web of interactions. For example, citizens would require landlord and national government to facili- tate hinterland operations as well as making proper plans to ensure safe, secure and lean transport. From citizens’ perspective, local and national government is also a service provider or facilitator. Consid- ering the entire concept of ports and terminals, port performance inquiries are a more complex web of relationships. 4.3. Quality function deployment and expectations matrix The quality function deployment (QFD) (Akao, 2004) method is an instrument to find a final cumulative impact of a technical measure (e.g. KPIs) on particular aspects of customer satisfaction (i.e. expectations). The motivation behind the methodology arises from the fact that there is no direct link between a final product or service and various segments of the organization. In other words, expectations of customer cannot be reflected in different agents and departments of the product/service provider. For example, it is quite difficult to translate requirements of shipping firms into envi- ronmental or financial apparatus (i.e. technical measures) while same translations need to be performed many other stakeholders too. In this regard, the QFD methodology helps to translate require- ments into measurable and tangible instruments as well as to 2 The term, the hinterland and foreland plasticity, may be extended with other aspects of port/terminal operations and management.
  • 8. 176 O. Duru et al. / The Asian Journal of Shipping and Logistics 36 (2020) 169–180 Table 2 Impact of performance indicators on stakeholder satisfaction (Sample: Portugal, S.Pore, U.S.A., Turkey). Source: Authors’ own elaboration. calculate the equilibrium among stakeholders as well as prioritiz- ing instruments in terms of their cumulative impact on costumer’s satisfaction. When only one type of customer is present, such trans- lation should show an equilibrium among technical measures and highlighted measures of the greatest impact. A production unit may have so many technical measures to manage and to improve the product while ensuring certain internal criteria (e.g. breakeven, profitability, manpower security). The QFD approach helps orga- nizations to identify technical measures with the greatest impact for better utilization of resources. The house of quality (HoQ) is an essential component of the QFD, and it is a matrix of customer (i.e. stakeholder) expecta- tions vs. technical measures (e.g. KPIs) (Fig. 4). The function of HoQ is to clarify and quantify the contribution of each technical measure to the improvement of the stakeholders expectation as well as the cumulative improvement of the objective phenomenon (Akao, 2004). An expert panel (e.g. experts, engineers, consultants, researchers) estimates the level of relationship between technical measures and their corresponding technical/management appara- tus and customer requirements based on a scale of 0/1/3/5/7 or 0/1/3/5/7/9 (higher the rating, stronger the impact). When the rela- tionship can be estimated numerically, corresponding rating can also be reflected based on a correlation index. However, it is most probably mentally calculated by subject matter experts. In contrast to traditional surveys, subject matter experience is much valuable and essential than the number of people in this exercise. A few subject matter experts would be sufficient than hundreds of less qualified people with limited experience. Therefore, the QFD should not be confused with conventional surveys and their sample size requirements. The legitimate population of the QFD is already very small due to the limited number of subject matter experts with broader understanding, experience and technical credentials. It is a very natural argument that customer requirements are not equally important. Therefore, customer requirements need to be prioritized too. The prioritization of customer requirements can directly be asked to a sample of customers. However, this paper has slightly different objectives and structure. In this paper, the rela- tionship between groups of respondents (e.g. cargo owners and shipping firms) and groups of technical measures are compared. This paper does not attempt to investigate the relationship between requirement of a specific customer and a technical measure at the micro level. Instead, this paper investigates macro relation- ships between stakeholders and groups of technical measures to shed light to future research. In other words, future research may focus on a specific customer group (stakeholder) and its expecta- tions (listed in Table 1) and technical measures for a given port or terminal. For the purpose of this paper, the significance of each stakeholder is investigated through independent subject matter experts. If this question would be asked to specific stakeholder, each stakeholder would naturally prioritize its own requirements.
  • 9. O. Duru et al. / The Asian Journal of Shipping and Logistics 36 (2020) 169–180 177 Table 3 Impact of performance indicators on stakeholder satisfaction (Sample: Brazil). Source: Authors’ own elaboration. Therefore, participants should be impartial or reflect the impartial standpoint. Priorities can be extracted in various ways and then normalized. In this paper, we asked a few experts with broader views and without direct connection to any interest group as well as collecting opinions among scholars (including authors). A rank- rate approach was followed in which stakeholders are put in order of importance (for the port ecosystem) at the first stage, and then, assuming the top stakeholder as 100 points, remaining stakehold- ers are given points in 0–100 scale considering the indifference value with the top choice. Median responses are normalized to define priority degrees. For example, ‘Terminal Operators’ has been given 95 points just below the top choice, ‘Cargo Owners’, with 100 points. It is normalized priority calculated at 0.16 (=95/605 sum of given marks) while ‘Cargo Owners’ has 0.17 (=100/605 sum of given marks). The HoQ may also represent the relationship between technical measures. The correlation matrix above technical measure row can be utilized for this purpose (as in Duru, Huang, Bulut, & Yoshida, 2013). On the other hand, this paper does not attempt a micro analysis and correlation assessment. A sample of technical mea- sures in each group is provided to participants while this paper does not investigate each technical measure. Micro level assess- ment may be conducted for the case of a specific port or terminal, and technical measures are actually different for various types of ports and terminals (e.g. dry bulk terminal vs. container termi- nal). Similar to the correlation matrix, intra-industry assessment is not performed in this paper. Intra-industry assessment section is a useful component in which the target organization is compared to its competitors in terms of each customer requirement. Since there is no target organization and micro level analysis, competitor section is also irrelevant. Future research at the micro level may also consider reflecting competition analysis. The expectations of stakeholders have already been discussed and listed in Table 1. The definition of technical measures is another fundamental question to develop practical strategies to improve port performance. Considering authors in-depth analysis of tech- nical papers, case studies and various publications of UNCTAD (as refereed on Sections 2 and 3), the technical measures of port ser- vices in its wider meaning are classified in nine groups of indicators as follows: • Market Indicators (e.g. % market share) • Financial Indicators (e.g. Return on equity) • Operational Indicators (in-terminal) (e.g. Ships/Day, Hours/Ship) • Technology Indicators (equipment-technology) (e.g. Age of gantry cranes) • Port/Harbor Indicators (seaway) (e.g. No. of marine accidents)
  • 10. 178 O. Duru et al. / The Asian Journal of Shipping and Logistics 36 (2020) 169–180 • Environmental Indicators (e.g. Volume of CO2 Emission) • Social Indicators (public relations, CSR) (e.g. $ spent for local com- munity) • Gate/Hinterland Indicators (border and out-terminal) (e.g. Average gate time per truck) • Macro-Economic and Political Indicators (e.g. Volume of regional trade, economic climate) In this paper, the stakeholder expectations are represented by each stakeholder group as a cumulative means of requirements and expectations to be satisfied. Technical measures are also rep- resented by each group of indicators. In this research track, future studies will search for the relationship between each expectation of stakeholder and each technical performance measures. 5. Testing the concept of a comprehensive framework: a pilot study As a pilot study, Table 2 introduces an estimated matrix of stake- holders (as representative of unique expectations) vs. technical performance measures (as representative of micro level indica- tors behind them). The objective of this pilot study is to represent potential gross interactions between stakeholders and groups of technical measures of port operations and connected activities. A group3 of operational executives from port business and logistics company representatives as well as a few researchers are invited (in Brazil, Portugal, Singapore, Turkey and USA, whose profile is sum- marized in Annex I) to participate to the pilot study. The pilot study is a rough estimation for an average response, and Table 2 presents the median response for each group of data. The slight difference between priority-based and priority-neutral analysis reflects the approximation. The distribution of the impact of stakeholders could be mon- itored through the density of symbols in the matrix. The direct stakeholders of port/terminal operations (terminal itself, cargo owners, shipping firms) cluster around the operational and techno- logical indicators while the rest of the stakeholders lay through the right of the matrix which represents hinterland, society and macro- economic and political aspects of the port business. Based on pilot study entries, the priority of each stakeholder is presented with normalized priority degrees (ranking and standard scoring are uti- lized for the pilot study). Below the matrix, the level contribution (sum-product of priority and size of impact; normalized values) and ranking of technical measures are calculated (the conventional arithmetic operations of the QFD method are utilized). Fundamentally, two groups of technical measures stand out in the entire sample of indicators. Macro-economic and political indi- cators represent the bird’s eye view to the problem and emphasize the higher-level factors while technology indicators are more about the internal capacity (also operational indicators). However, the pilot study just deals with the gross impact of groups (stakehold- ers and technical measures) which is definitely an overview of the entire problem. Furthermore, there are special circumstances to be 3 The participants have agreed to provide their answers on a volunteer based and have received no monetary compensation for their time. considered regarding the different contexts of each respondents’ countries. In Brazil, for instance, respondents have emphasized the operational and financial indicators as per rank results shown in Table 3 (bottom line). This could be explained by the country regulatory framework, specifically as the concession processes are implemented by government agencies (centralized and long last- ing). Still in Table 3, we can see that in Brazil, the respondents rank to indicate that Brazilian government should focus on facilitating and developing trade and national economy as well as building financially feasible ports/terminals to satisfy/support these stake- holders. The terminal operators ranked 2, indicating that terminal operations must be improved as well. In such a way, we consider that these results are consistent with some major issues identified at Brazilian large infrastructure projects such as lack of funds for new building; and government policies discontinuity both impact- ing the operational and economic efficiencies of ports (Galvao et al, 2017)(Galvao et al., 2016). In the case of public ports, the port governance structure centralizes decisions at the Federal Govern- ment level, there is actually a lack of autonomy, i.e., dependence of public funds transfer for facing investment, debts services and even operational expenses. 6. Conclusions Overall, we consider that the paper has accomplished its objec- tive of reviewing in-depth the international literature of port performance and based on a critical view on them, we have studied an alternative more comprehensive framework for port perfor- mance assessment covering four dimensions (economic, political, social, ethics). The stakeholder impact matrix shows that it is possi- ble to have different expectations from different stakeholders being assessed at the same time, which support our original hypothe- sis of “a port is performing well when these four dimensions are full filled”. The pilot study has validated the original idea of sec- tor need of a more comprehensive analysis of port performance indicators. As such, this conclusion should provide insights to port managers and policy makers in how to integrate the QFD in their bench makers. The continuation of this research requires system- atic input collection from a larger sample of stakeholders’ groups aiming to provide an amplified pool of data that could sustain cross country managerial recommendations for the port stakeholders in addition to improve mutual understanding and interaction. In an ongoing research, much sensitive and detailed analysis of those interactions are investigated through a wider group of rep- resentatives which will reveal more practical and insightful results about the comprehensive port performance framework. Acknowledgement The authors would like to thank editors and the two anonymous reviewers whose comments helped us to improve the quality of this paper.
  • 11. O. Duru et al. / The Asian Journal of Shipping and Logistics 36 (2020) 169–180 179 Annex I. Summary of profile operational executives and researches who volunteered to collaborate in the pilot study Country Gender Sector Main expertise Years of experience in the maritime sector Brazil Female Public/regulatory Port develop- ment/Investment 20+ Brazil Male Container Shipping Container terminals 15+ Brazil Male Environmental impact Ports and terminals 10+ Brazil Male Dry Bulk terminals Port development 5+ Portugal Female Marine services and Shipping Training and performance assessment 25+ Singapore Male Terminal Equipments Container terminals 25+ Singapore Male Terminal/Yard Operations Container terminals 10+ Singapore Male Third Party Logistics Logistics (Land+Water) 10+ USA Male Third Party Logistics Logistics (All modes) 20+ USA Male Container Shipping Logistics (Inland Water) 25+ Turkey Male Third Party Logistics Logistics (All modes) 10+ Turkey Male General Cargo Terminal Break bulk 5+ Turkey Male General Cargo Terminal Break bulk 20+ Source: authors’ own elaboration. References Akao, Y. (2004). QFD: quality function deployment – Integrating customer requirements into product design. New York: Productivity Press. Bichou, K. (2006). Review of port performance approaches and a supply chain frame- work to port performance benchmarking. Research in Transportation Economics, 17, 567–598. Brooks, M. R. (1985). An alternative theoretical approach to the evaluation of liner shipping. Part II. Choice criteria. Maritime Policy and Management, 12(2), 145–155. Brooks, M. R. (2006). Issues in measuring port devolution program performance: a managerial perspective. Research in Transportation Economics, 17, 599–629. Brooks, M.R., and Cullinane, K. (2007). (Vol. 17). Elsevier. Brooks, M. R., Schellinck, T., & Pallis, A. A. (2011). A systematic approach for evalu- ating port effectiveness. Maritime Policy and Management, 38(3), 315–334. Brooks, M., Schellinck, T., & Pallis, A. (2011). Port effectiveness: Users’ perspectives in North America. Transportation Research Record: Journal of the Transportation Research Board, (2222), 34–42. Brooks, M. R., & Schellinck, T. (2013). Measuring port effectiveness in user service delivery: What really determines users’ evaluations of port service delivery? Research in Transportation Business and Management, 8, 87–96. Brooks, M. R., Cullinane, K. P., & Pallis, A. A. (2017). Revisiting port governance and port reform: A multi-country examination. Research in Transportation Business and Management, (22), 1–10. Cullinane, K., & Wang, T. F. (2006). Data envelopment analysis (DEA) and improving container port efficiency. Research in Transportation Economics, 17, 517–566. Cruz, M. R. P., Ferreira, J. J., & Azevedo, S. G. (2013). Key factors of seaport compet- itiveness based on the stakeholder perspective: An Analytic Hierarchy Process (AHP) model. Maritime Economics and Logistics, 15(4), 416–443. De Langen, P., Nidjam, M., & Van der Horst, M. (2007). New indicators to measure port performance. Journal of Maritime Research, 4(1), 23–36. Dooms, M. (2014). Integrating ‘triple P’ bottom line performance and the license to operate for ports: Towards new partnerships between port cluster stakehold- ers. In Y. Alix, B. Delvalle, & C. Comtois (Eds.), Port-City governance (pp. 55–75). Editions EMS. Duru, O., Huang, S. T., Bulut, E., & Yoshida, S. (2013). Multi-layer qual- ity function deployment (QFD) approach for improving the compromised quality satisfaction under the agency problem: A 3D QFD design for the asset selection problem in the shipping industry. Quality & Quantity, 47(4), 2259–2280. Esmer, S., Alnipak, S., & Duru, O. (2019). Port productivity. assessment for major container terminals of Turkey. International Journal of Transport Economics, 46(4). Freeman, R. E., & Reed, D. L. (1983). Stockholders and stakeholders: A new perspec- tive on corporate governance. California Management Review, 25(3), 88–106. Galvao, C. B., Wang, G. W., & Mileski, J. (2016). Public-private interests and conflicts in ports: A content analysis approach. The Asian Journal of Shipping and Logistics, 32(1), 13–22. Galvao, C. B., Robles, L. T., & Guerise, L. C. (2017). 20 years of port reform in Brazil: Insights into the reform process. Research in Transportation Business & Manage- ment, 22, 153–160. Gharehgozli, A. H., Roy, D., & De Koster, R. (2016). Sea container terminals: Recent developments and OR models. Maritime Economics and Logistics, 18(2), 103–140. Gharehgozli, A. H., Mileski, J., Adams, A., & Von Zharen, W. (2017). Evaluating a “Wicked Problem”: A conceptual framework on seaport resiliency in the event of weather disruptions. Technological Forecasting and Social Change, 121, 65–75. Gonzalez, M. M., & Trujillo, L. (2009). Efficiency measurement in the port industry: A survey of the empirical evidence. Journal of Transport Economics and Policy (JTEP), 43(2), 157–192. Gorman, M., Clarke, J. P., Gharehgozli, A. H., Hewitt, M., De Koster, R., & Roy, D. (2014). State of the practice: Application of OR/MS in Freight transportation. Interfaces, 44(6), 535–554. Hao, X. (2007). Stated preference technique for analysis of container port competi- tion. Transportation Research Record, 2033, 8–13. LaLonde, B. J., & Cooper, M. C. (1989). Partnerships in providing customer service: A third party perspective. Oak Brook, IL: Council of Logistics Management. Lam, J. S. L., Ng, A. K., & Fu, X. (2013). Stakeholder management for establishing sustainable regional port governance. Research in Transportation Business and Management, 8, 30–38. Liu, Z. (1995). The comparative performance of public and private enterprises: The case of British ports. Journal of Transport Economics and Policy, 263–274. McGinnis, M. A. (1978). Segmenting Freight markets. Transportation Journal, 18(1), 58–68. Notteboom, T., & Winkelmans, W. (2003). Dealing with stakeholders in the port planning process. In W. Dullaert, B. Jourquin, & J. Polak (Eds.), Across the border: Building upon a quarter of century of transport. Notteboom, T., & Rodrigue, J. P. (2005). Port regionalization: Towards a new phase in port development. Maritime Policy and Management, 32(3), 297–313. Notteboom, T., Pallis, A., De Langen, P. W., & Papachristou, A. (2013). Advances in port studies: The contribution of 40 years Maritime Policy and Management. Maritime Policy and Management, 40(7), 636–653. Pallis, A., Vitsounis, T. K., & De Langen, P. W. (2010). Port economics, policy and management: Review of an emerging research field. Transport Reviews: A Transnational Transdisciplinary Journal, 30(1), 115–161. Pallis, A., Vitsounis, T. K., De Langen, P. W., & Notteboom, T. (2011). Port economics, policy and management: Content classification and survey. Transport Reviews: A Transnational Transdisciplinary Journal, 31(4), 445–471. Parola, F., & Maugeri, S. (2013). Origin and taxonomy of conflicts in seaports: Towards a research agenda. Research in Transportation Business and Management, 8, 114–122. PPRN. (2019). Port performanceresearch network.. Available from: https://www.pprn. network/ Roll, Y., & Hayuth, Y. (1993). Port performance comparison applying data envelop- ment analysis (DEA). Maritime Policy and Management, 20(2), 153–161. Rodrigue, J. P., & Notteboom, T. (2010). Foreland-based regionalization: Integrating intermediate hubs with port hinterlands. Research in Transportation Economics, 27(1), 19–29. Saleh, F., & LaLonde, B. J. (1972). Industrial buying behaviour and the motor carrier selection decision. Journal of Purchasing, 8(1), 18–33. Schellinck, T., & Brooks, M. R. (2014). Improving port effectiveness through deter- minance/performance gap analysis. Maritime Policy and Management, 41(4), 328–345. Schellinck, T., & Brooks, M. R. (2016). Developing an instrument to assess seaport effectiveness in service delivery. International Journal of Logistics: Research and Applications, 19(2), 143–157. Talley, W. K. (2006). Port performance: An economics perspective. Research in Trans- portation Economics, 17, 499–516. Tongzon, J., & Heng, W. (2005). Port privatization, efficiency and competitive- ness: Some empirical evidence from container ports (terminals). Transportation Research Part A: Policy and Practice, 39(5), 405–424. UNCTAD. (1976). United Nations Conference on Trade and Development, Port per- formance indicators, TD/B/C.4/131/Supp.1/Rev.1, New York, US.. Available from: http://unctad.org/en/PublicationsLibrary/tdbc4d131sup1rev1 en.pdf UNCTAD. (1987). United Nations Conference on Trade and Development. Measuring and evaluating fort performance and productivity. 6, New York: United Nations: UNCTAD Monographs on Port Management. UNCTAD. (2012). United Nations Conference on Trade and Development. Assessing port performance: Ad hoc expert meeting: Main outcomes and summary of discussions. Geneva, Palais des Nations, 12 December 2012.. Available from: http://unctad.org/ meetings/en/SessionalDocuments/webdtltlb2013doc1 en.pdf UNCTAD. (2016). United Nations Conference on Trade and Development. Review of mar- itime transport 2016.. Available from: http://unctad.org/en/PublicationsLibrary/ rmt2016 en.pdf
  • 12. 180 O. Duru et al. / The Asian Journal of Shipping and Logistics 36 (2020) 169–180 Weigend, G. G. (1956). The problem of hinterland and foreland as illustrated by the port of Hamburg. Economic Geography, 32(1), 1–16. Weigend, G. G. (1958). Some elements in the study of port geography. Geographical Review, 48(2), 185–200. Woo, S.-H., Pettit, S., & Beresford, A. K. C. (2011). Port evolution and performance in changing logistics environments. Maritime Economics and Logistics, 13(3), 250–277. Woo, S. H., Pettit, S., Beresford, A., & Kwak, D. W. (2012). Seaport research: A decadal analysis of trends and themes since the 1980s. Transport Reviews: A Transnational Transdisciplinary Journal, 32(3), 351–377. Woo, S. H., Bang, H. S., Martin, S., & Li, K. X. (2013). Evolution of research themes in Maritime Policy and Management – 1973–2012. Maritime Policy and Manage- ment, 40(3), 200–225.