Download to read offline
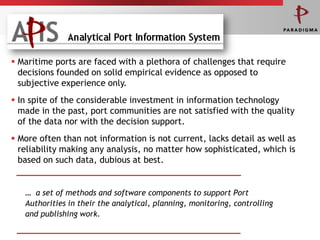
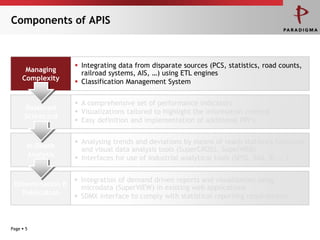
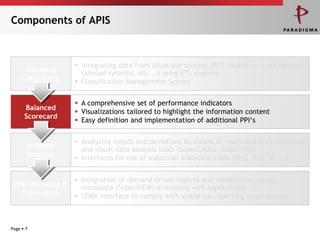
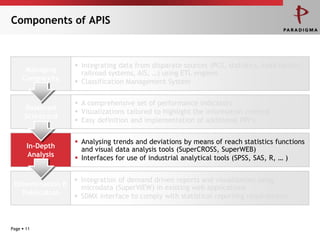
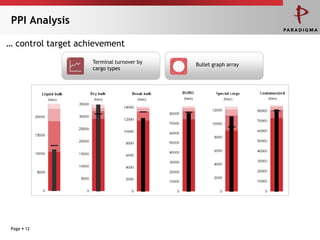
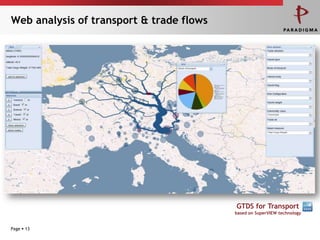
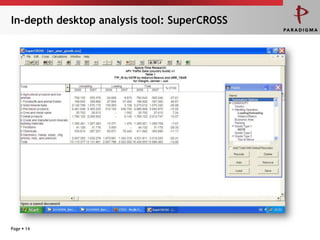
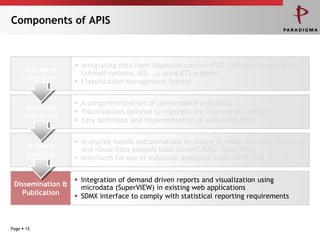
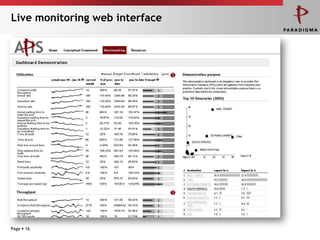
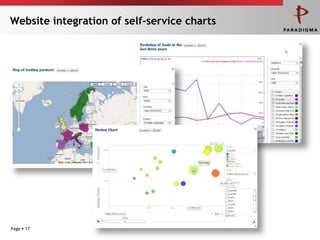

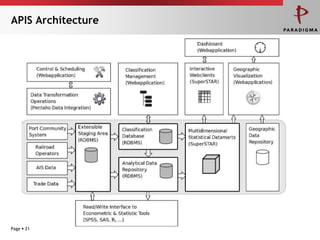

The document discusses an Analytic Port Information System (APIS) that aims to integrate data from various sources like port community systems, statistics, road counts, and railroad systems using extraction, transformation, and loading engines. It seeks to establish a comprehensive set of performance indicators and visualizations to provide balanced scorecards and in-depth analysis tools to support decision making at ports. The system aims to disseminate reports and integrate demand-driven visualization using microdata and standards like SDMX for statistical publication requirements.


![[SEPG Europe 2012] A Multi-Model Case Study: High Maturity in Development + S...](https://cdn.slidesharecdn.com/ss_thumbnails/strongsteppaperpresentationmultimodel20120501finalpresented-120608120351-phpapp01-thumbnail.jpg?width=640&height=640&fit=bounds)


![[QUATIC 2012] A Multi-Model Case Study: High Maturity in Development + Servic...](https://cdn.slidesharecdn.com/ss_thumbnails/strongsteppaperpresentationmultimodelquatic2012v21-120911082655-phpapp02-thumbnail.jpg?width=640&height=640&fit=bounds)


