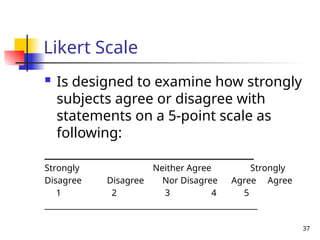
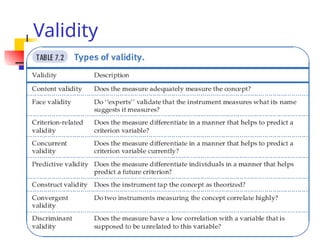
1
Measurement: Scaling,
Reliability, Validity
CHAPTER 7
By: Laurence B. Dacuba
2
Chapter Objectives
 Know the characteristics and power of the
four types of scales- nominal, ordinal,
interval, and ratio.
 Know how and when to use the different
forms of rating scales and ranking scales.
 Explain stability and consistency and how
they are established.
 Discuss what “goodness” of measures
means, and why it is necessary to establish
it in research.
Scale
 Is a tool or mechanism by which
individuals are distinguished as to
how they differ from one another on
the variables of interest to our study.
3
scales
 There are four basic types of scales:
1. Nominal Scale
2. Ordinal Scale
3. Interval Scale
4. Ratio Scale
4
scales
 The degree of sophistication to
which the scales are fine-tuned
increases progressively as we move
from the nominal to the ratio scale.
 The information on the variables can
be obtained in greater detail when
we employ an interval or a ratio scale
than the other two scales.
5
scales
 With more powerful scales,
increasingly sophisticated data
analyses can be performed, which in
turn, means that more meaningful
answers can be found to our research
questions.
6
Nominal Scale
 A nominal scale is one that allows the researcher to assign
subjects to certain categories or groups.
 What is your department?
O Marketing O Maintenance O
Finance
O Production O Servicing O Personnel
O Sales O Public Relations O Accounting
 What is your gender?
O Male
O Female
7
Nominal Scale
 For example, the variable of gender,
respondents can be grouped into
two categories- male and female.
 Notice that there are no third
category into which respondents
would normally fall.
8
Nominal Scale
 The information that can be
generated from nominal scaling is to
calculate the percentage (or
frequency) of males and females in
our sample of respondents.
9
Example 1
 Nominally scale the nationality of
individuals in a group of tourists to a
country during a certain year.
 We could nominally scale this variable in
the following mutually exclusive and
collectively exhaustive categories.
American Japanese
Russian Malaysian
Chinese German
Arabian Other
10
Example 1
 Note that every respondent has to fit
into one of the above categories and
that the scale will allow computation
of the numbers and percentages of
respondents that fit into them.
11
Ordinal Scale
 Ordinal scale: not only categorizes variables in
such a way as to denote differences among
various categories, it also rank-orders categories
in some meaningful way.
 What is the highest level of education you have
completed?
O Less than High School
O High School/GED Equivalent
O College Degree
O Masters Degree
O Doctoral Degree
12
Ordinal Scale
 The preference would be ranked
( from best to worse; or from first to
last) and numbered as 1, 2, 3, and so
on.
13
Example 2
 Rank the following five
characteristics in a job in terms of
how important they are for you.
You should rank the most important
item as 1, the next in importance a 2,
and so on, until you have ranked each
of them 1, 2, 3, 4, or 5.
14
Example 2 (Cont.)
 Job Characteristic Ranking
The opportunity provided by the job to:
1. Interacts with others _____
2. Use different skills _____
3. Complete a task to the end _____
4. Serve others _____
5. Work independently _____
15
Example 2 (Cont.)
 This scale helps the researcher to
determine the percentage of
respondents who consider
interaction with others as most
important, those who consider using
a number of skills as most important,
and so on. Such knowledge might
help in designing jobs that would be
seen as most enriched by the
majority of the employees.
16
Example 2 (Cont.)
 We can see that the ordinal scale
provides more information than the
nominal scale. Even though
differences in the ranking of objects,
persons are clearly known, we do not
know their magnitude.
 This deficiency is overcome by
interval scaling.
17
18
Interval Scale
 Interval scale: whereas the nominal
scale allows us only to qualitatively
distinguish groups by categorizing
them into mutually exclusive and
collectively exhaustive sets, and the
ordinal scale to rank-order the
preferences, the interval scale lets
us measure the distance between any
two points on the scale.
Interval scale
19
©
2009
John Wiley & Sons Ltd
.
www.wileyeurope.com/college/sekaran
Example 3a
 Indicate the extent to which you
agree with the following statements
as they relate to your job, by circling
the appropriate number against
each, using the scale given below.
strongly disagree 1, Disagree 2
Neither Agree Nor Disagree 3
Agree 4, Strongly Agree 5.
20
Example 3a (Cont.)
 The following opportunities offered
by the job are very important to me:
21
Interacting with others 1 2 3 4 5
Using a number of
different skills
1 2 3 4 5
Completing a task from
beginning to end
1 2 3 4 5
Serving others 1 2 3 4 5
Working independently 1 2 3 4 5
Example 3a (Cont.)
 Suppose that the employees circle the
numbers 3, 1, 2, 4, and 5 for the five items.
 The magnitude of difference represented
by the space between points 1 and 2 on
the scale is the same as the magnitude of
difference represented by the space
between points 4 and 5, or between any
other two points. Any number can be
added to or subtracted from the numbers
on the scale, still retaining the magnitude
of the difference.
22
Example 3a (Cont.)
 If we add 6 to the five points on the
scale, the interval scale will have the
numbers 7, 8,….., 11 ( instead of 1 to
5).
 The magnitude of the difference
between 7 and 8 is still the same as
the magnitude of the difference
between 9 and 10. It has an arbitrary
origin. 23
24
24
Example 3b
 Circle the number that represents your feelings at this particular
moment best. There are no right or wrong answers. Please answer
every question.
1. I invest more in my work than I get out of it
I disagree completely 1 2 3 4 5 I agree completely
2. I exert myself too much considering what I get back in return
I disagree completely 1 2 3 4 5 I agree completely
3. For the efforts I put into the organization, I get much in return
I disagree completely 1 2 3 4 5 I agree completely
Ratio Scale
 Ratio scale: overcomes the
disadvantage of the arbitrary origin
point of the interval scale, in that it
has an absolute (in contrast to an
arbitrary) zero point, which is a
meaningful measurement point.
 What is your age?
26
Ratio Scale
26
Ratio Scale
 The ratio scale is the most powerful
of the four scales because it has a
unique zero origin ( not an
arbitrary origin).
 The differences between scales are
summarized in the next Figure.
27
The differences between
scales
28
Properties of the Four Scales
30
Developing Scales
 The four types of scales that can be used
to measure the operationally defined
dimensions and elements of a variable are:
Nominal, Ordinal, Interval, and Ratio
scales.
 It is necessary to examine the methods of
scaling (assigning numbers or symbols) to
elicit the attitudinal responses of subjects
toward objects, events, or persons.
31
Developing Scales

Categories of attitudinal scales:
(not to be confused with the four
different types of scales)

The Rating Scales

The Ranking Scales
32
Developing Scales
 Rating scales have several response
categories and are used to elicit
responses with regard to the object,
event, or person studied.
 Ranking scales, make comparisons
between or among objects, events, or
persons and elicit the preferred
choices and ranking among them.
33
Rating Scales

The following rating scales are
often used in organizational
research.
1. Dichotomous scale
2. Category scale
3. Likert scale
4. Numerical scale
34
Rating Scales
5. Semantic differential scale
6. Itemized rating scale
7. Fixed or constant sum rating scale
8. Stapel scale
9. Graphic rating scale
10. Consensus scale
35
Dichotomous Scale
 Is used to elicit a Yes or No answer.
(Note that a nominal scale is used to
elicit the response)
 Example 4
Do you own a car? Yes No
36
Category Scale
 It uses multiple items to elicit a single
response.
 Example 5
Where in Jordan do you reside?
Amman
Mafraq
Irbid
Zarqa
Other
37
Likert Scale
 Is designed to examine how strongly
subjects agree or disagree with
statements on a 5-point scale as
following:
_________________________________
Strongly Neither Agree Strongly
Disagree Disagree Nor Disagree Agree Agree
1 2 3 4 5
______________________________________________________
38
Likert Scale
 This is an Interval scale and the
differences in responses between any
two points on the scale remain the
same.
39
Semantic Differential Scale
 We use this scale when several
attributes are identified at the
extremes of the scale. For instance,
the scale would employ such terms
as: Good – Bad
Strong – Weak
Hot – Cold
40
Semantic Differential Scale
 This scale is treated as an Interval
scale.
 Example 6
What is your opinion on your supervisor?
Responsive--------------Unresponsive
Beautiful-----------------Ugly
Courageous-------------Timid
41
Numerical Scale
 Is similar to the semantic differential scale,
with the difference that numbers on a 5-
points or 7-points scale are provided, as
illustrated in the following example:
How pleased are you with your new job?
Extremely Extremlely
pleased 5 4 3 2 1 displeased
42
Itemized Rating Scale
 A 5-point or 7-point scale is provided for each item
and the respondent states the appropriate
number on the side of each item. This uses an
Interval Scale.
 Example 7(i)
Respond to each item using the scale below, and indicate
your response number on the line by each item.
1 2 3 4 5
Very unlikely unlikely neither likely very likely
unlikely nor
likely
--------------------------------------------------------------------------------
I will be changing my job in the near future. --------
43
Itemized Rating Scale
 Note that the above is balanced
rating with a neutral point.
 The unbalance rating scale which
does not have a neutral point, will be
presented in the following example.
44
Itemized Rating Scale
 Example 7(ii)
Circle the number that is closest to how you
feel for the item below:
Not at all Somewhat Moderately Very much
interested interested interested interested
1 2 3 4
--------------------------------------------------------------------------------
How would you rate your interest 1 2 3 4
In changing current organizational
Policies?
45
Fixed or Constant Sum Scale
 The respondents are asked to distribute a
given number of points across various
items.

Example : In choosing a toilet soap, indicate the importance
you attach to each of the following five aspects by allotting
points for each to total 100 in all.
Fragrance -----
Color -----
Shape -----
Size -----
_________
Total points 100
This is more in the nature of an ordinal scale.
46
Stapel Scale
 This scale simultaneously measures
both the direction and intensity of
the attitude toward the items under
study. The characteristic of interest
to the study is placed at the center
and a numerical scale ranging, say
from +3 to – 3, on either side of the
item as illustrated in the following
example:
47
Example 8: Stapel Scale
 State how you would rate your supervisor’s abilities with
respect to each of the characteristics mentioned below, by
circling the appropriate number.
+3 +3 +3
+2 +2 +2
+1 +1 +1
Adopting modern Product Interpersonal
Technology Innovation Skills
- 1 - 1 - 1
- 2 - 2 - 2
- 3 - 3 - 3
48
Graphic Rating Scale
 A graphical representation helps the
respondents to indicate on this scale
their answers to a particular question
by placing a mark at the appropriate
point on the line, as in the following
example:
49
Graphic Rating Scale
 Example 9
 On a scale of 1 to 10, how would
you rate your supervisor?
5
1
10
50
Ranking Scales
 Are used to tap preferences between
two or among more objects or items
(ordinal in nature). However, such
ranking may not give definitive
clues to some of the answers sought.
51
Ranking Scales
 Example 10
There are 4 product lines, the manager seeks
information that would help decide which product
line should get the most attention.
Assume:
35% of respondents choose the 1st product.
25% of respondents choose the 2nd product.
20% of respondents choose the 3rd product.
20% of respondents choose the 4th product.
100%
52
Ranking Scales
 The manager cannot conclude that the
first product is the most preferred. Why?
 Because 65% of respondents did not
choose that product. We have to use
alternative methods like Forced Choice,
Paired Comparisons, and the Comparative
Scale.
 We will describe the Forced Choice as an
example.
53
Forced Choice
 The forced choice enables
respondents to rank objects relative
to one another, among the
alternative provided. This is easier for
the respondents, particularly if the
number of choice to be ranked is
limited in number.
54
Forced Choice
 Example 11
Rank the following newspapers that you
would like to subscribe to in the order of
preference, assigning 1 for the most
preferred choice and 5 for the least
preferred.
•
-------‫الدستور‬
•
---------‫الرأي‬
•
----‫اليوم‬ ‫أخبار‬
•
-----------‫الغد‬
•
--------‫شيحان‬
55
Goodness of Measures
 It is important to make sure that the
instrument that we develop to
measure a particular concept is
accurately measuring the variable,
and we are actually measured the
concept that we set out to measure.
56
Goodness of Measures
 We need to assess the goodness of
the measures developed. That is, we
need to be reasonably sure that the
instruments we use in our research
do indeed measure the variables
they are supposed to, and that they
measure them accurately.
Goodness of Measures
58
Goodness of Measures
 How can we ensure that the
measures developed are reasonably
good?
 First an item analysis of the
responses to the questions tapping
the variable is done.
 Then the reliability and validity of
the measures are established.
59
Item Analysis
 Item analysis is done to see if the items in
the instrument belong there or not. Each
item is examined for its ability to
discriminate between those subjects
whose total scores are high, and those with
low scores.
 In item analysis, the means between the
high-score group and the low-score group
are tested to detect significant differences
through the t-values.
60
Item Analysis
 The items with a high t-value are then
included in the instrument.
Thereafter, tests for the reliability of
the instrument are done and the
validity of the measure is
established.
Reliability
 Reliability of measure indicates extent
to which it is without bias and hence
ensures consistent measurement
across time (stability) and across the
various items in the instrument
(internal consistency).
66
62
Stability
 Stability: ability of a measure to
remain the same over time, despite
uncontrollable testing conditions or
the state of the respondents
themselves.
 Test–Retest Reliability: The reliability
coefficient obtained with a repetition of
the same measure on a second occasion.
 Parallel-Form Reliability: Responses on
two comparable sets of measures
tapping the same construct are highly84
63
Test-Retest Reliability
 When a questionnaire containing some
items that are supposed to measure a
concept is administered to a set of
respondents now, and again to the same
respondents, say several weeks to 6
months later, then the correlation
between the scores obtained is called the
test-retest coefficient.
 The higher the coefficient is, the better the
test-retest reliability, and consequently, the
stability of the measure across time.
64
Parallel-Form Reliability
 When responses on two
comparable sets of measures
tapping the same construct are
highly correlated, we have parallel-
form reliability.
 Both forms have similar items and
the same response format, the only
changes being the wording and the
order or sequence of the questions.
65
Parallel-Form Reliability
 What we try to establish in the parallel-
form is the error variability resulting
from wording and ordering of the
questions.
 If two such comparable forms are highly
correlated (say 8 and above), we may be
fairly certain that the measures are
reasonably reliable, with minimal error
variance caused by wording, ordering, or
other factors.
72
Internal Consistency
 Internal Consistency of Measures is
indicative of the homogeneity of the items in the
measure that tap the construct.
 Inter-item Consistency Reliability: This is a
test of the consistency of respondents’ answers
to all the items in a measure. The most popular
test of inter-item consistency reliability is the
Cronbach’s coefficient alpha.
 Split-Half Reliability: Split-half reliability
reflects the correlations between two halves of
an instrument.
67
Validity
 Validity tests show how well an instrument
that is developed measures the particular
concept it is intended to measure. Validity
is concerned with whether we measure the
right concept.
 Several types of validity tests are used to
test the goodness of measures: content
validity, criterion-related validity, and
construct validity.
68
Content Validity
 Content validity ensures that the measure
includes an adequate and representative
set of items that tap the concept.
 The more the scale items represent the
domain of the concept being measured,
the greater the content validity.
 In other words, content validity is a
function of how well the dimensions and
elements of a concept have been
delineated.
69
Criterion-Related Validity
 Criterion-Related Validity is established
when the measure differentiates
individuals on a criterion it is expected to
predict. This can be done by establishing
what is called concurrent validity or
predictive validity.
 Concurrent validity is established when
the scale discriminates individuals who
are known to be different; that is, they
should score differently on the instrument
as in the following example.
70
Criterion-Related Validity
 Example 12
If a measure of work ethic is developed
and administered to a group of welfare
recipients, the scale should differentiate
those who are enthusiastic about
accepting a job and glad of a opportunity
to be off welfare, from those who would
not want to work even when offered a job.
71
Example 12 (Cont.)
 Those with high work ethic values would
not want to be on welfare and would ask
for employment. Those who are low on
work ethic values, might exploit the
opportunity to survive on welfare for as
long as possible.
 If both types of individuals have the
same score on the work ethic scale, then
the test would not be a measure of work
ethic, but of something else.
72
Construct Validity
 Construct Validity testifies to how well the results
obtained from the use of the measure fit the
theories around which the test is designed. This is
assessed through convergent and discriminant
validity.
 Convergent validity is established when the
scores obtained with two different instruments
measuring the same concept are highly
correlated.
 Discriminant validity is established when, based
on theory, two variables are predicted to be
uncorrelated, and the scores obtained by
measuring them are indeed empirically found to
be so.
73
Goodness of Measures
 Goodness of Measures is established
through the different kinds of validity and
reliability.
 The results of any research can only be as
good as the measures that tap the
concepts in the theoretical framework.
 Table 7.2 summarizes the kinds of validity
discussed in the lecture.
74
Validity
.

Measurement, scaling, Reliability, validity

  • 1.
  • 2.
    2 Chapter Objectives  Knowthe characteristics and power of the four types of scales- nominal, ordinal, interval, and ratio.  Know how and when to use the different forms of rating scales and ranking scales.  Explain stability and consistency and how they are established.  Discuss what “goodness” of measures means, and why it is necessary to establish it in research.
  • 3.
    Scale  Is atool or mechanism by which individuals are distinguished as to how they differ from one another on the variables of interest to our study. 3
  • 4.
    scales  There arefour basic types of scales: 1. Nominal Scale 2. Ordinal Scale 3. Interval Scale 4. Ratio Scale 4
  • 5.
    scales  The degreeof sophistication to which the scales are fine-tuned increases progressively as we move from the nominal to the ratio scale.  The information on the variables can be obtained in greater detail when we employ an interval or a ratio scale than the other two scales. 5
  • 6.
    scales  With morepowerful scales, increasingly sophisticated data analyses can be performed, which in turn, means that more meaningful answers can be found to our research questions. 6
  • 7.
    Nominal Scale  Anominal scale is one that allows the researcher to assign subjects to certain categories or groups.  What is your department? O Marketing O Maintenance O Finance O Production O Servicing O Personnel O Sales O Public Relations O Accounting  What is your gender? O Male O Female 7
  • 8.
    Nominal Scale  Forexample, the variable of gender, respondents can be grouped into two categories- male and female.  Notice that there are no third category into which respondents would normally fall. 8
  • 9.
    Nominal Scale  Theinformation that can be generated from nominal scaling is to calculate the percentage (or frequency) of males and females in our sample of respondents. 9
  • 10.
    Example 1  Nominallyscale the nationality of individuals in a group of tourists to a country during a certain year.  We could nominally scale this variable in the following mutually exclusive and collectively exhaustive categories. American Japanese Russian Malaysian Chinese German Arabian Other 10
  • 11.
    Example 1  Notethat every respondent has to fit into one of the above categories and that the scale will allow computation of the numbers and percentages of respondents that fit into them. 11
  • 12.
    Ordinal Scale  Ordinalscale: not only categorizes variables in such a way as to denote differences among various categories, it also rank-orders categories in some meaningful way.  What is the highest level of education you have completed? O Less than High School O High School/GED Equivalent O College Degree O Masters Degree O Doctoral Degree 12
  • 13.
    Ordinal Scale  Thepreference would be ranked ( from best to worse; or from first to last) and numbered as 1, 2, 3, and so on. 13
  • 14.
    Example 2  Rankthe following five characteristics in a job in terms of how important they are for you. You should rank the most important item as 1, the next in importance a 2, and so on, until you have ranked each of them 1, 2, 3, 4, or 5. 14
  • 15.
    Example 2 (Cont.) Job Characteristic Ranking The opportunity provided by the job to: 1. Interacts with others _____ 2. Use different skills _____ 3. Complete a task to the end _____ 4. Serve others _____ 5. Work independently _____ 15
  • 16.
    Example 2 (Cont.) This scale helps the researcher to determine the percentage of respondents who consider interaction with others as most important, those who consider using a number of skills as most important, and so on. Such knowledge might help in designing jobs that would be seen as most enriched by the majority of the employees. 16
  • 17.
    Example 2 (Cont.) We can see that the ordinal scale provides more information than the nominal scale. Even though differences in the ranking of objects, persons are clearly known, we do not know their magnitude.  This deficiency is overcome by interval scaling. 17
  • 18.
    18 Interval Scale  Intervalscale: whereas the nominal scale allows us only to qualitatively distinguish groups by categorizing them into mutually exclusive and collectively exhaustive sets, and the ordinal scale to rank-order the preferences, the interval scale lets us measure the distance between any two points on the scale.
  • 19.
    Interval scale 19 © 2009 John Wiley& Sons Ltd . www.wileyeurope.com/college/sekaran
  • 20.
    Example 3a  Indicatethe extent to which you agree with the following statements as they relate to your job, by circling the appropriate number against each, using the scale given below. strongly disagree 1, Disagree 2 Neither Agree Nor Disagree 3 Agree 4, Strongly Agree 5. 20
  • 21.
    Example 3a (Cont.) The following opportunities offered by the job are very important to me: 21 Interacting with others 1 2 3 4 5 Using a number of different skills 1 2 3 4 5 Completing a task from beginning to end 1 2 3 4 5 Serving others 1 2 3 4 5 Working independently 1 2 3 4 5
  • 22.
    Example 3a (Cont.) Suppose that the employees circle the numbers 3, 1, 2, 4, and 5 for the five items.  The magnitude of difference represented by the space between points 1 and 2 on the scale is the same as the magnitude of difference represented by the space between points 4 and 5, or between any other two points. Any number can be added to or subtracted from the numbers on the scale, still retaining the magnitude of the difference. 22
  • 23.
    Example 3a (Cont.) If we add 6 to the five points on the scale, the interval scale will have the numbers 7, 8,….., 11 ( instead of 1 to 5).  The magnitude of the difference between 7 and 8 is still the same as the magnitude of the difference between 9 and 10. It has an arbitrary origin. 23
  • 24.
    24 24 Example 3b  Circlethe number that represents your feelings at this particular moment best. There are no right or wrong answers. Please answer every question. 1. I invest more in my work than I get out of it I disagree completely 1 2 3 4 5 I agree completely 2. I exert myself too much considering what I get back in return I disagree completely 1 2 3 4 5 I agree completely 3. For the efforts I put into the organization, I get much in return I disagree completely 1 2 3 4 5 I agree completely
  • 25.
    Ratio Scale  Ratioscale: overcomes the disadvantage of the arbitrary origin point of the interval scale, in that it has an absolute (in contrast to an arbitrary) zero point, which is a meaningful measurement point.  What is your age? 26
  • 26.
  • 27.
    Ratio Scale  Theratio scale is the most powerful of the four scales because it has a unique zero origin ( not an arbitrary origin).  The differences between scales are summarized in the next Figure. 27
  • 28.
  • 29.
    Properties of theFour Scales
  • 30.
    30 Developing Scales  Thefour types of scales that can be used to measure the operationally defined dimensions and elements of a variable are: Nominal, Ordinal, Interval, and Ratio scales.  It is necessary to examine the methods of scaling (assigning numbers or symbols) to elicit the attitudinal responses of subjects toward objects, events, or persons.
  • 31.
    31 Developing Scales  Categories ofattitudinal scales: (not to be confused with the four different types of scales)  The Rating Scales  The Ranking Scales
  • 32.
    32 Developing Scales  Ratingscales have several response categories and are used to elicit responses with regard to the object, event, or person studied.  Ranking scales, make comparisons between or among objects, events, or persons and elicit the preferred choices and ranking among them.
  • 33.
    33 Rating Scales  The followingrating scales are often used in organizational research. 1. Dichotomous scale 2. Category scale 3. Likert scale 4. Numerical scale
  • 34.
    34 Rating Scales 5. Semanticdifferential scale 6. Itemized rating scale 7. Fixed or constant sum rating scale 8. Stapel scale 9. Graphic rating scale 10. Consensus scale
  • 35.
    35 Dichotomous Scale  Isused to elicit a Yes or No answer. (Note that a nominal scale is used to elicit the response)  Example 4 Do you own a car? Yes No
  • 36.
    36 Category Scale  Ituses multiple items to elicit a single response.  Example 5 Where in Jordan do you reside? Amman Mafraq Irbid Zarqa Other
  • 37.
    37 Likert Scale  Isdesigned to examine how strongly subjects agree or disagree with statements on a 5-point scale as following: _________________________________ Strongly Neither Agree Strongly Disagree Disagree Nor Disagree Agree Agree 1 2 3 4 5 ______________________________________________________
  • 38.
    38 Likert Scale  Thisis an Interval scale and the differences in responses between any two points on the scale remain the same.
  • 39.
    39 Semantic Differential Scale We use this scale when several attributes are identified at the extremes of the scale. For instance, the scale would employ such terms as: Good – Bad Strong – Weak Hot – Cold
  • 40.
    40 Semantic Differential Scale This scale is treated as an Interval scale.  Example 6 What is your opinion on your supervisor? Responsive--------------Unresponsive Beautiful-----------------Ugly Courageous-------------Timid
  • 41.
    41 Numerical Scale  Issimilar to the semantic differential scale, with the difference that numbers on a 5- points or 7-points scale are provided, as illustrated in the following example: How pleased are you with your new job? Extremely Extremlely pleased 5 4 3 2 1 displeased
  • 42.
    42 Itemized Rating Scale A 5-point or 7-point scale is provided for each item and the respondent states the appropriate number on the side of each item. This uses an Interval Scale.  Example 7(i) Respond to each item using the scale below, and indicate your response number on the line by each item. 1 2 3 4 5 Very unlikely unlikely neither likely very likely unlikely nor likely -------------------------------------------------------------------------------- I will be changing my job in the near future. --------
  • 43.
    43 Itemized Rating Scale Note that the above is balanced rating with a neutral point.  The unbalance rating scale which does not have a neutral point, will be presented in the following example.
  • 44.
    44 Itemized Rating Scale Example 7(ii) Circle the number that is closest to how you feel for the item below: Not at all Somewhat Moderately Very much interested interested interested interested 1 2 3 4 -------------------------------------------------------------------------------- How would you rate your interest 1 2 3 4 In changing current organizational Policies?
  • 45.
    45 Fixed or ConstantSum Scale  The respondents are asked to distribute a given number of points across various items.  Example : In choosing a toilet soap, indicate the importance you attach to each of the following five aspects by allotting points for each to total 100 in all. Fragrance ----- Color ----- Shape ----- Size ----- _________ Total points 100 This is more in the nature of an ordinal scale.
  • 46.
    46 Stapel Scale  Thisscale simultaneously measures both the direction and intensity of the attitude toward the items under study. The characteristic of interest to the study is placed at the center and a numerical scale ranging, say from +3 to – 3, on either side of the item as illustrated in the following example:
  • 47.
    47 Example 8: StapelScale  State how you would rate your supervisor’s abilities with respect to each of the characteristics mentioned below, by circling the appropriate number. +3 +3 +3 +2 +2 +2 +1 +1 +1 Adopting modern Product Interpersonal Technology Innovation Skills - 1 - 1 - 1 - 2 - 2 - 2 - 3 - 3 - 3
  • 48.
    48 Graphic Rating Scale A graphical representation helps the respondents to indicate on this scale their answers to a particular question by placing a mark at the appropriate point on the line, as in the following example:
  • 49.
    49 Graphic Rating Scale Example 9  On a scale of 1 to 10, how would you rate your supervisor? 5 1 10
  • 50.
    50 Ranking Scales  Areused to tap preferences between two or among more objects or items (ordinal in nature). However, such ranking may not give definitive clues to some of the answers sought.
  • 51.
    51 Ranking Scales  Example10 There are 4 product lines, the manager seeks information that would help decide which product line should get the most attention. Assume: 35% of respondents choose the 1st product. 25% of respondents choose the 2nd product. 20% of respondents choose the 3rd product. 20% of respondents choose the 4th product. 100%
  • 52.
    52 Ranking Scales  Themanager cannot conclude that the first product is the most preferred. Why?  Because 65% of respondents did not choose that product. We have to use alternative methods like Forced Choice, Paired Comparisons, and the Comparative Scale.  We will describe the Forced Choice as an example.
  • 53.
    53 Forced Choice  Theforced choice enables respondents to rank objects relative to one another, among the alternative provided. This is easier for the respondents, particularly if the number of choice to be ranked is limited in number.
  • 54.
    54 Forced Choice  Example11 Rank the following newspapers that you would like to subscribe to in the order of preference, assigning 1 for the most preferred choice and 5 for the least preferred. • -------‫الدستور‬ • ---------‫الرأي‬ • ----‫اليوم‬ ‫أخبار‬ • -----------‫الغد‬ • --------‫شيحان‬
  • 55.
    55 Goodness of Measures It is important to make sure that the instrument that we develop to measure a particular concept is accurately measuring the variable, and we are actually measured the concept that we set out to measure.
  • 56.
    56 Goodness of Measures We need to assess the goodness of the measures developed. That is, we need to be reasonably sure that the instruments we use in our research do indeed measure the variables they are supposed to, and that they measure them accurately.
  • 57.
  • 58.
    58 Goodness of Measures How can we ensure that the measures developed are reasonably good?  First an item analysis of the responses to the questions tapping the variable is done.  Then the reliability and validity of the measures are established.
  • 59.
    59 Item Analysis  Itemanalysis is done to see if the items in the instrument belong there or not. Each item is examined for its ability to discriminate between those subjects whose total scores are high, and those with low scores.  In item analysis, the means between the high-score group and the low-score group are tested to detect significant differences through the t-values.
  • 60.
    60 Item Analysis  Theitems with a high t-value are then included in the instrument. Thereafter, tests for the reliability of the instrument are done and the validity of the measure is established.
  • 61.
    Reliability  Reliability ofmeasure indicates extent to which it is without bias and hence ensures consistent measurement across time (stability) and across the various items in the instrument (internal consistency). 66
  • 62.
    62 Stability  Stability: abilityof a measure to remain the same over time, despite uncontrollable testing conditions or the state of the respondents themselves.  Test–Retest Reliability: The reliability coefficient obtained with a repetition of the same measure on a second occasion.  Parallel-Form Reliability: Responses on two comparable sets of measures tapping the same construct are highly84
  • 63.
    63 Test-Retest Reliability  Whena questionnaire containing some items that are supposed to measure a concept is administered to a set of respondents now, and again to the same respondents, say several weeks to 6 months later, then the correlation between the scores obtained is called the test-retest coefficient.  The higher the coefficient is, the better the test-retest reliability, and consequently, the stability of the measure across time.
  • 64.
    64 Parallel-Form Reliability  Whenresponses on two comparable sets of measures tapping the same construct are highly correlated, we have parallel- form reliability.  Both forms have similar items and the same response format, the only changes being the wording and the order or sequence of the questions.
  • 65.
    65 Parallel-Form Reliability  Whatwe try to establish in the parallel- form is the error variability resulting from wording and ordering of the questions.  If two such comparable forms are highly correlated (say 8 and above), we may be fairly certain that the measures are reasonably reliable, with minimal error variance caused by wording, ordering, or other factors.
  • 66.
    72 Internal Consistency  InternalConsistency of Measures is indicative of the homogeneity of the items in the measure that tap the construct.  Inter-item Consistency Reliability: This is a test of the consistency of respondents’ answers to all the items in a measure. The most popular test of inter-item consistency reliability is the Cronbach’s coefficient alpha.  Split-Half Reliability: Split-half reliability reflects the correlations between two halves of an instrument.
  • 67.
    67 Validity  Validity testsshow how well an instrument that is developed measures the particular concept it is intended to measure. Validity is concerned with whether we measure the right concept.  Several types of validity tests are used to test the goodness of measures: content validity, criterion-related validity, and construct validity.
  • 68.
    68 Content Validity  Contentvalidity ensures that the measure includes an adequate and representative set of items that tap the concept.  The more the scale items represent the domain of the concept being measured, the greater the content validity.  In other words, content validity is a function of how well the dimensions and elements of a concept have been delineated.
  • 69.
    69 Criterion-Related Validity  Criterion-RelatedValidity is established when the measure differentiates individuals on a criterion it is expected to predict. This can be done by establishing what is called concurrent validity or predictive validity.  Concurrent validity is established when the scale discriminates individuals who are known to be different; that is, they should score differently on the instrument as in the following example.
  • 70.
    70 Criterion-Related Validity  Example12 If a measure of work ethic is developed and administered to a group of welfare recipients, the scale should differentiate those who are enthusiastic about accepting a job and glad of a opportunity to be off welfare, from those who would not want to work even when offered a job.
  • 71.
    71 Example 12 (Cont.) Those with high work ethic values would not want to be on welfare and would ask for employment. Those who are low on work ethic values, might exploit the opportunity to survive on welfare for as long as possible.  If both types of individuals have the same score on the work ethic scale, then the test would not be a measure of work ethic, but of something else.
  • 72.
    72 Construct Validity  ConstructValidity testifies to how well the results obtained from the use of the measure fit the theories around which the test is designed. This is assessed through convergent and discriminant validity.  Convergent validity is established when the scores obtained with two different instruments measuring the same concept are highly correlated.  Discriminant validity is established when, based on theory, two variables are predicted to be uncorrelated, and the scores obtained by measuring them are indeed empirically found to be so.
  • 73.
    73 Goodness of Measures Goodness of Measures is established through the different kinds of validity and reliability.  The results of any research can only be as good as the measures that tap the concepts in the theoretical framework.  Table 7.2 summarizes the kinds of validity discussed in the lecture.
  • 74.