Adding a grid
•You can use the command:
• grid on
• to add grid lines to your plot. This
increases the readability of the graph.
Abdelrahman Mohamed fargly
7
8.
Adding a grid
•You can use the command:
• grid on
• to add grid lines to your plot. This
increases the readability of the graph.
• To remove these grid lines, use:
• grid off
Abdelrahman Mohamed fargly
8
9.
Adding a grid
•» fplot('exp(x)-x-2',[-3 3])
• » grid on
Abdelrahman Mohamed fargly
9
plot3 function
• TheMATLAB function plot3 is used to
plot space curves.
Abdelrahman Mohamed fargly
12
13.
plot3 function
• TheMATLAB function plot3 is used to
plot space curves.
• Space curves are usually represented by
parametric equations:
• x = x(t), y = y(t), z = z(t)
Abdelrahman Mohamed fargly
13
14.
plot3 function
• TheMATLAB function plot3 is used to
plot space curves.
• Space curves are usually represented by
parametric equations:
• x = x(t), y = y(t), z = z(t)
• Steps followed and options available for
plot3 is similar to that of plot.
Abdelrahman Mohamed fargly
14
15.
plot3 Example 1
•Example: Plot the line
• x = t + 2, y = t - 2, z = t, 0 < t < 1
Abdelrahman Mohamed fargly
15
16.
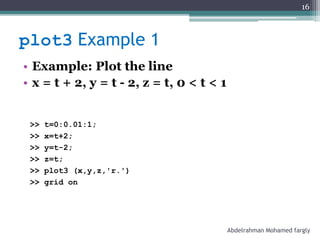
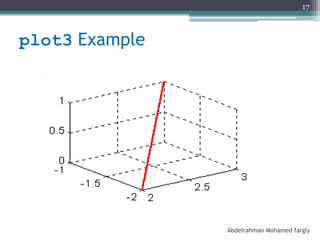
plot3 Example 1
•Example: Plot the line
• x = t + 2, y = t - 2, z = t, 0 < t < 1
>> t=0:0.01:1;
>> x=t+2;
>> y=t-2;
>> z=t;
>> plot3 (x,y,z,'r.')
>> grid on
Abdelrahman Mohamed fargly
16
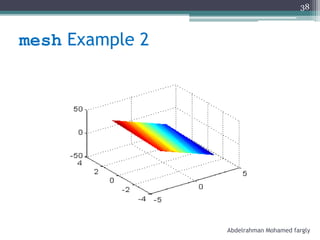
plot3 Example 2
•Example: Plot the circle
• x = 1, y = 5 cos t, z = 5 sin t, - < t <
Abdelrahman Mohamed fargly
18
19.
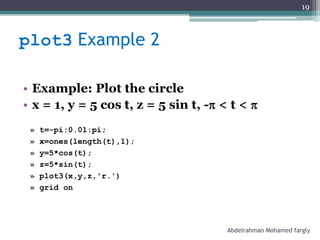
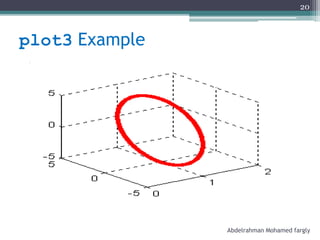
plot3 Example 2
•Example: Plot the circle
• x = 1, y = 5 cos t, z = 5 sin t, - < t <
» t=-pi:0.01:pi;
» x=ones(length(t),1);
» y=5*cos(t);
» z=5*sin(t);
» plot3(x,y,z,'r.')
» grid on
Abdelrahman Mohamed fargly
19
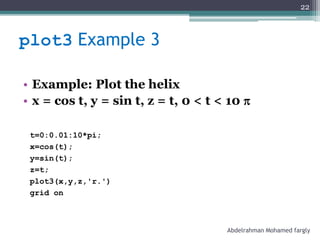
plot3 Example 3
•Example: Plot the helix
• x = cos t, y = sin t, z = t, 0 < t < 10
Abdelrahman Mohamed fargly
21
22.
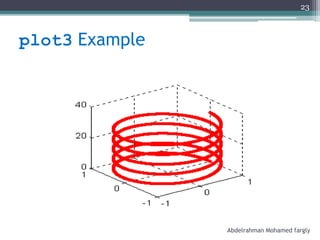
plot3 Example 3
•Example: Plot the helix
• x = cos t, y = sin t, z = t, 0 < t < 10
t=0:0.01:10*pi;
x=cos(t);
y=sin(t);
z=t;
plot3(x,y,z,'r.')
grid on
Abdelrahman Mohamed fargly
22
plot3 function
• TheMATLAB function plot3 can be used
also to plot multiple 2D curves in 3D.
Abdelrahman Mohamed fargly
24
25.
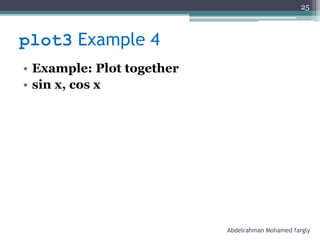
plot3 Example 4
•Example: Plot together
• sin x, cos x
Abdelrahman Mohamed fargly
25
26.
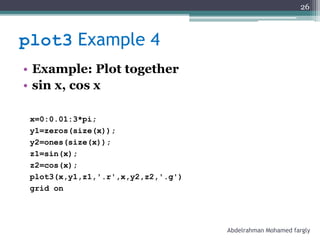
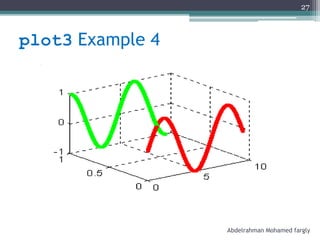
plot3 Example 4
•Example: Plot together
• sin x, cos x
x=0:0.01:3*pi;
y1=zeros(size(x));
y2=ones(size(x));
z1=sin(x);
z2=cos(x);
plot3(x,y1,z1,'.r',x,y2,z2,'.g')
grid on
Abdelrahman Mohamed fargly
26
mesh function
• TheMATLAB function mesh is used to
plot surfaces.
Abdelrahman Mohamed fargly
28
29.
mesh function
• TheMATLAB function mesh is used to
plot surfaces.
• Surfaces are usually represented by a
function of two variables:
• z = f(x, y)
Abdelrahman Mohamed fargly
29
30.
mesh function
• TheMATLAB function mesh is used to
plot surfaces.
• Surfaces are usually represented by a
function of two variables:
• z = f(x, y)
• To use this function we have to use
meshgrid first to generate to pairs (x, y)
Abdelrahman Mohamed fargly
30
31.
meshgrid by example
>>x=0:2
x = 0 1 2
>> y=0:2
y = 0 1 2
>> [X,Y]=meshgrid(x,y)
Abdelrahman Mohamed fargly
31
32.
meshgrid by example
>>x=0:2
x = 0 1 2
>> y=0:2
y = 0 1 2
>> [X,Y]=meshgrid(x,y)
X = 0 1 2
0 1 2
0 1 2
Y = 0 0 0
1 1 1
2 2 2
Abdelrahman Mohamed fargly
32
33.
mesh Example 1
•Example: Plot the surface
• z = x2 + y2
Abdelrahman Mohamed fargly
33
34.
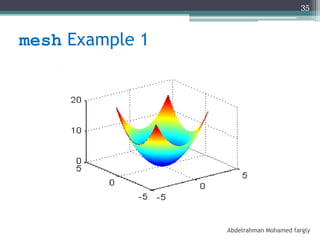
mesh Example 1
•Example: Plot the surface
• z = x2 + y2
x=-3:0.01:3;
y=-3:0.01:3;
[X,Y]=meshgrid(x,y);
z=X.^2+Y.^2;
mesh(X,Y,z)
Abdelrahman Mohamed fargly
34
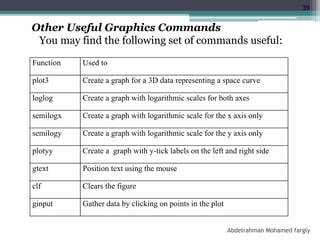
Other Useful GraphicsCommands
You may find the following set of commands useful:
Function Used to
plot3 Create a graph for a 3D data representing a space curve
loglog Create a graph with logarithmic scales for both axes
semilogx Create a graph with logarithmic scale for the x axis only
semilogy Create a graph with logarithmic scale for the y axis only
plotyy Create a graph with y-tick labels on the left and right side
gtext Position text using the mouse
clf Clears the figure
ginput Gather data by clicking on points in the plot
39
Abdelrahman Mohamed fargly

![See also
•Function plot
>>fplot(‘function’,[xmin xmax],’property’)
Example :
>>fplot(‘sin’,[0 2*pi],’r:’)
Abdelrahman Mohamed fargly
2](https://image.slidesharecdn.com/plot-260207235618-00607ffe/85/plot-in-ma686737373738353437677365tlab-pdf-2-320.jpg)
![fplot function
• » fplot('sin(x)',[-pi pi])
Abdelrahman Mohamed fargly
3](https://image.slidesharecdn.com/plot-260207235618-00607ffe/85/plot-in-ma686737373738353437677365tlab-pdf-3-320.jpg)
![fplot function
• » fplot('sin(x)',[-pi pi])
-2 0 2
-1
-0.5
0
0.5
1
Abdelrahman Mohamed fargly
4](https://image.slidesharecdn.com/plot-260207235618-00607ffe/85/plot-in-ma686737373738353437677365tlab-pdf-4-320.jpg)
![fplot function
• » fplot('exp(-x)*sin(x)',[0 2])
Abdelrahman Mohamed fargly
5](https://image.slidesharecdn.com/plot-260207235618-00607ffe/85/plot-in-ma686737373738353437677365tlab-pdf-5-320.jpg)
![fplot function
• » fplot('exp(-x)*sin(x)',[0 2])
0 0.5 1 1.5 2
0
0.05
0.1
0.15
0.2
0.25
0.3
0.35
Abdelrahman Mohamed fargly
6](https://image.slidesharecdn.com/plot-260207235618-00607ffe/85/plot-in-ma686737373738353437677365tlab-pdf-6-320.jpg)
![Adding a grid
• » fplot('exp(x)-x-2',[-3 3])
• » grid on
Abdelrahman Mohamed fargly
9](https://image.slidesharecdn.com/plot-260207235618-00607ffe/85/plot-in-ma686737373738353437677365tlab-pdf-9-320.jpg)
![Adding a grid
• » fplot('exp(x)-x-2',[-3 3])
• » grid on
-3 -2 -1 0 1 2 3
-5
0
5
10
15
20
Abdelrahman Mohamed fargly
10](https://image.slidesharecdn.com/plot-260207235618-00607ffe/85/plot-in-ma686737373738353437677365tlab-pdf-10-320.jpg)
![meshgrid by example
>> x=0:2
x = 0 1 2
>> y=0:2
y = 0 1 2
>> [X,Y]=meshgrid(x,y)
Abdelrahman Mohamed fargly
31](https://image.slidesharecdn.com/plot-260207235618-00607ffe/85/plot-in-ma686737373738353437677365tlab-pdf-31-320.jpg)
![meshgrid by example
>> x=0:2
x = 0 1 2
>> y=0:2
y = 0 1 2
>> [X,Y]=meshgrid(x,y)
X = 0 1 2
0 1 2
0 1 2
Y = 0 0 0
1 1 1
2 2 2
Abdelrahman Mohamed fargly
32](https://image.slidesharecdn.com/plot-260207235618-00607ffe/85/plot-in-ma686737373738353437677365tlab-pdf-32-320.jpg)
![mesh Example 1
• Example: Plot the surface
• z = x2 + y2
x=-3:0.01:3;
y=-3:0.01:3;
[X,Y]=meshgrid(x,y);
z=X.^2+Y.^2;
mesh(X,Y,z)
Abdelrahman Mohamed fargly
34](https://image.slidesharecdn.com/plot-260207235618-00607ffe/85/plot-in-ma686737373738353437677365tlab-pdf-34-320.jpg)
![mesh Example 2
• Example: Plot the surface
• 7 x - y + z=3
>> x=-3:0.1:3;
>> y=-3:0.1:3;
>> [X,Y]=meshgrid(x,y);
>> z=3-7*X+Y;
>> mesh(X,Y,z)
Abdelrahman Mohamed fargly
37](https://image.slidesharecdn.com/plot-260207235618-00607ffe/85/plot-in-ma686737373738353437677365tlab-pdf-37-320.jpg)