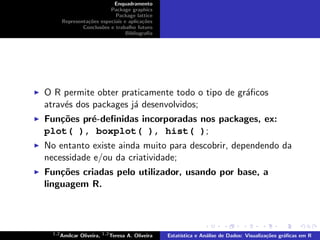
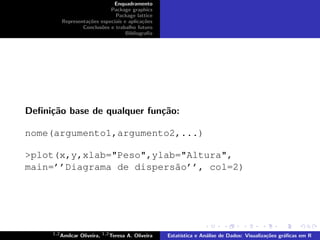
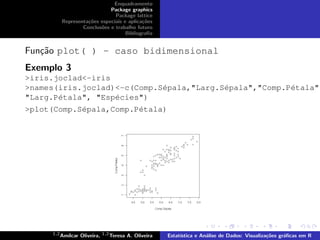
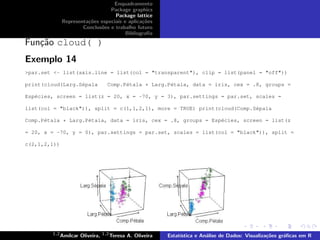
This document provides examples of various plotting functions in R including plot(), boxplot(), hist(), pairs(), barplot(), densityplot(), dotplot(), histogram(), xyplot(), cloud(), and biplot/triplot. Functions are demonstrated using built-in datasets like iris and by plotting variables against each other to create scatter plots, histograms, and other visualizations.


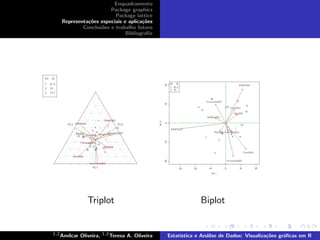
![biplot e triplot)
> library(agricolae)
> library(klaR)
> data(Oat2)
> startgraph
> biplot
> model<- AMMI(Oat2[,1], Oat2[,2], Oat2[,3], Oat2[,4],xlim=c(-35,20),ylim=c(-20,20),
graph="biplot")
> model<- AMMI(Oat2[,1], Oat2[,2], Oat2[,3], Oat2[,4],xlim=c(-35,20),ylim=c(-20,20),
graph="biplot",number=FALSE)
> triplot
> model<- AMMI(Oat2[,1], Oat2[,2], Oat2[,3], Oat2[,4],graph="triplot")](https://image.slidesharecdn.com/joclad2010d-120223193436-phpapp02/85/Joclad-2010-d-28-320.jpg)


![Some Examples in R- [Data Visualization--R graphics]](https://cdn.slidesharecdn.com/ss_thumbnails/rchart-160729210112-thumbnail.jpg?width=640&height=640&fit=bounds)


![[1062BPY12001] Data analysis with R / April 19](https://cdn.slidesharecdn.com/ss_thumbnails/dataanalyzer05control-180419065850-thumbnail.jpg?width=640&height=640&fit=bounds)


