This document summarizes the development of a mathematical model for flood management in the Godavari River basin in India using the MIKE 11 software. The model is calibrated using data from 2009-2011 and validated against data from 2012. Real-time validation is also conducted during floods in 2013. Results show good agreement between measured and computed river stages, indicating the model can accurately forecast river levels for flood management.
Fitting Probability Distribution Functions To Discharge Variability Of Kaduna...IJMER
International Journal of Modern Engineering Research (IJMER) is Peer reviewed, online Journal. It serves as an international archival forum of scholarly research related to engineering and science education.
Runoff modelling using hec hms for rural watershedEditorIJAERD
Due to climate change it is very essential to do hydrological modelling. Reliable models are essential for planning,
developmental works, prediction and safety of the population. Hydrological models are used to determine catchment
discharge/flow through an efficient way. HEC-HM (Hydrological engineering centre Hydrological modelling system) is
one of hydrological modelling tool developed by United States army corps of engineer (USACE) for event as well as for
continuous simulations. Models, especially continuous simulations are useful for future predictions of stream flow due to
land-use changes or extreme events phenomenon. In this study continuous hydrologic modellingwas carried out using
HEC HMS modelling tool.
Deficit and Constant Loss methods with Clark transform methods were selected. The calibrated model (period
1986-1988) was validated with data set of the period of 2009-2013. Study concluded that the model recommended and
can be used for stated River as decision support tool in the design and operation.
DETERMINATION OF NET FLOWS INTO ALMATTI RESERVOIR FROM CWC GAUGE DATA AND RES...IAEME Publication
This paper presents the determination of net flows into Almatti reservoir from CWC data and reservoir data. From the study it can be concluded that the average flow in to Almatti will be 574.86 TMC, the maximum inflow will be 1196.8 TMC and the minimum flow will be 166.99 TMC. The flows in annual in deficit years may reduce by about 50 TMC but there is no variation in the good years in the good years as the storage effects will take care of this aspect during good years. It can be concluded that there will be reduction of flows in the June and July flows in the ultimate scenario except in very good years.
Abstract Urban watersheds produce an instantaneous response to rainfall. That results in stormwater runoff in excess of the capacity of drainage systems. The excess stormwater must be managed to prevent flooding and erosion of streams. Management can be achieved with the help of structural stormwater Best Management Practices (BMPs). Detention ponds is one such BMP commonly found in the Austin, TX, USA. The City of Austin developed a plan to mitigate future events of flooding and erosion, resulting in the development and integration of stormwater BMP algorithms into the sub-hourly version of SWAT model. This paper deals with the development of a physically based algorithm for detention pond. The algorithm was tested using a previously flow-calibrated watershed in the Austin area. From the test results obtained it appears that the detention pond algorithm is functioning satisfactorily. The algorithm developed could be used a) to evaluate the functionality of individual detention pond b) to analyze the benefits of such structures at watershed or higher scales and c) as design tool. Keywords: flooding, detention, urban, watershed, BMP, algorithm, stormwater, modeling
International Journal of Engineering Research and Applications (IJERA) is an open access online peer reviewed international journal that publishes research and review articles in the fields of Computer Science, Neural Networks, Electrical Engineering, Software Engineering, Information Technology, Mechanical Engineering, Chemical Engineering, Plastic Engineering, Food Technology, Textile Engineering, Nano Technology & science, Power Electronics, Electronics & Communication Engineering, Computational mathematics, Image processing, Civil Engineering, Structural Engineering, Environmental Engineering, VLSI Testing & Low Power VLSI Design etc.
APPLICATION OF 1-D HEC-RAS MODEL IN DESIGN OF CHANNELSAM Publications
Flood occurs at Surat city frequently due to sudden release of water from Ukai dam in river Tapi. At the
time of floods in river Tapi, Surat city and surrounding regions are most affected. The city has faced many floods
since long back. Major flood event occurred in the year 1883, 1884, 1942,1944,1945,1949, 1959, 1968, 1994, 1998,
2002, 2006, 2007 and 2012. The carrying capacity of river is approximately about 4.5 lakhs cusecs (12753 cumecs) at
present. In this, stability of a segment of lower reach approximately 6 km length of Tapi river between Weir cum
causeway and Sardar bridge is evaluated for its carrying capacity and stability in response to discharge and slopes
using HEC-RAS software for past flood data. The study reach consists of 24 cross-sections. The hydraulics model,
HEC-RAS is employed to evaluate flood conveyance performance and also uniform flow computation is carried out.
In the present study existing storm drains are not only marked but based on the HEC-RAS water surface elevation
computation for various flood discharges, need of flood gates on the storm drains are also assessed. The
recommendations are done based on this study either to increase height of bank or construct a retaining wall at
certain sections along the study reach. The present study also recommends installations of flood gates on all the storm
drain outlets which are without flood gates. The width of river in no case be encroached as sections are sensitive high
floods.
The Development of a Catchment Management Modelling System for the Googong Re...GavanThomas
A scenario assessment model to assist the end-user in determining priorities for a series of agreed management prescriptions that can be enacted through controls on existing landuse
Workshop on Storm Water Modeling ApproachesM. Damon Weiss
The attached presentation was prepared by Pennoni Associates and Michael Baker Corporation to the Pittsburgh Parks Conservancy and members of the Pennsylvania Environmental Council Green Infrastructure Network. The presentation discussed various watershed modeling techniques for regional, watershed and local projects, as well as an overview of the different tools that engineers use to create these models.
Suspended Sediment Rating Curve for Tigris River Upstream Al- Betera RegulatorIJRES Journal
In this study, suspended sediment rating curves for sediment concentration for a section of Tigris
River located upstream AL-Betera regulator, Maysan province. For this purpose. Also, for each observation, the
river discharge was measured using the ADCP . Abased previous years data have been benefiting from the
vicissitudes of time of study area and took the annual discharge rate for each year and then entered into the
equation for calculation of suspended sediment through draw the relationship between discharge and sediment
suspended ,noticed power link between data and a good agreement between the power relation and the observed
data were achieved depending on the value of correlation coefficient R.
Streamflow simulation using radar-based precipitation applied to the Illinois...Alireza Safari
This paper describes the application of a spatially distributed hydrological model WetSpa (Water and Energy Transfer between Soil, Plants and Atmosphere) using radar-based rainfall data provide by the United States Hydrology Laboratory of NOAA's National Weather Service for a distributed model intercomparison project. The model is applied to the
river basin above Tahlequah hydrometry station with 30-m spatial resolution and one hour time--step for a total simulation period of 6 years. Rainfall inputs are derived from radar. The distributed model parameters are based on an extensive database of watershed characteristics available for the region, including digital maps of DEM, soil type, and land use. The model is calibrated and validated on part of the river flow records. The simulated hydrograph shows a good correspondence with observation (Nash efficiency coeffiecient >80%, indicating that the model is able to simulate the relevant hydrologic processes in the basin accurately.
Floodplain Modelling Materials and MethodologyIDES Editor
A floodplain is the normally dry land area adjoining
river or stream that is inundated during flood events. The
most common reason for flooding could be overtopping of river
or stream due to heavy downfall. The floodplain carries flow
in excess of the river or stream capacity. Flood frequency and
flood water-surface elevations are the crucial components for
the evaluation of flood hazard. This paper presents the
methodology that incorporates advanced technologies for
hydrologic and hydraulic analyses that are needed to be carried
out to predict the flood water-surface elevations for any
ungaged watershed.
International Journal of Engineering Research and Applications (IJERA) is an open access online peer reviewed international journal that publishes research and review articles in the fields of Computer Science, Neural Networks, Electrical Engineering, Software Engineering, Information Technology, Mechanical Engineering, Chemical Engineering, Plastic Engineering, Food Technology, Textile Engineering, Nano Technology & science, Power Electronics, Electronics & Communication Engineering, Computational mathematics, Image processing, Civil Engineering, Structural Engineering, Environmental Engineering, VLSI Testing & Low Power VLSI Design etc.
A Holistic Approach for Determining the Characteristic Flow on Kangsabati Cat...ijceronline
Kangsabati river rises from the Chotanagpur plateau in the state of West Bengal, India and passes through the districts of Purulia, Bankura and Paschim Medinipur in West Bengal before joining into river Rupnarayan. It is life of these three districts of West Bengal situated in the western part of the state. The river has ephemeral characteristics i.e. it has low flow in the year round and have a high peak on a certain time basis. In the Kangasabati catchment hydrological study gives an evident that during the period every two years there is a chance of drought condition and consecutively after that there is a high flow year. In our study period from 1991 to 2010 there are six low streamflow year i.e. in that year there is less rainfall than the average rainfall on that area. The year 1991, 2002 and 2009 are the drought prone year and above that in 2010 the severe drought condition was seen and this is the lowest rainfall year among the last 20 years and the rainfall on this year is only 766 mm which is in an about 38% less rainfall than the average rainfall of the catchment. And the highest flood peak in the last twenty year is noted on 19th Aug 2007 as 377107.8 Mm3
A study confined to the lower tapi basin in Gujarat, India to find out the primary causes for 2006 floods in Surat city. The study involves collection of topographical data from the local geological survey organization, rainfall data from meteorological department of india and the application of HEC-HMS software from US Army corps of engineers to identify the primary cause of the runoff.
International Journal of Computational Engineering Research (IJCER) is dedicated to protecting personal information and will make every reasonable effort to handle collected information appropriately. All information collected, as well as related requests, will be handled as carefully and efficiently as possible in accordance with IJCER standards for integrity and objectivity.
Assessment and Analysis of Maximum Precipitation at Bharkawada Village, Palan...RSIS International
Efficient Storm water network is the main tool to prevent the water gatheration and scattering of a city. Selecting the Bharkawada as study area and its problem was identified to be of very less effective drainage system. In this study methods have been adopted to identify the possibilities of completing the research for designing the storm water drainage design. Our main aim is to design a very efficient and rpid drainage system which should drain the water very fastly with less concentration time and less spreading of water with less provision of slope. The present design is based on rainfall data. Past 30 years rainfall data has been taken for study. The system has been designed considering in total of 65% of the impervious area. Estimated rainfall intensity has been calculated as 33.02527 mm/hour with a recurrence interval of 2 years from the detailed analysis of rainfall data of 34 years. Rainfall Intensity is estimated after frequency analysis of the rainfall data. The calculated runoff is 25.056 m3/s, which can be used as a design discharge for network designing. Different methods can be used for runoff estimation. Here, Rational method seems to be best for use in estimation of storm water runoff. The outfalls of system are directed to proposed lakes. Ere at this stage rainfall calculations have been done and in future work complete rainfall and runoff analysis will be carried out for storm water network.
International Journal of Engineering Research and Applications (IJERA) is an open access online peer reviewed international journal that publishes research and review articles in the fields of Computer Science, Neural Networks, Electrical Engineering, Software Engineering, Information Technology, Mechanical Engineering, Chemical Engineering, Plastic Engineering, Food Technology, Textile Engineering, Nano Technology & science, Power Electronics, Electronics & Communication Engineering, Computational mathematics, Image processing, Civil Engineering, Structural Engineering, Environmental Engineering, VLSI Testing & Low Power VLSI Design etc.
PHP Frameworks: I want to break free (IPC Berlin 2024)Ralf Eggert
In this presentation, we examine the challenges and limitations of relying too heavily on PHP frameworks in web development. We discuss the history of PHP and its frameworks to understand how this dependence has evolved. The focus will be on providing concrete tips and strategies to reduce reliance on these frameworks, based on real-world examples and practical considerations. The goal is to equip developers with the skills and knowledge to create more flexible and future-proof web applications. We'll explore the importance of maintaining autonomy in a rapidly changing tech landscape and how to make informed decisions in PHP development.
This talk is aimed at encouraging a more independent approach to using PHP frameworks, moving towards a more flexible and future-proof approach to PHP development.
Key Trends Shaping the Future of Infrastructure.pdfCheryl Hung
Keynote at DIGIT West Expo, Glasgow on 29 May 2024.
Cheryl Hung, ochery.com
Sr Director, Infrastructure Ecosystem, Arm.
The key trends across hardware, cloud and open-source; exploring how these areas are likely to mature and develop over the short and long-term, and then considering how organisations can position themselves to adapt and thrive.
GDG Cloud Southlake #33: Boule & Rebala: Effective AppSec in SDLC using Deplo...James Anderson
Effective Application Security in Software Delivery lifecycle using Deployment Firewall and DBOM
The modern software delivery process (or the CI/CD process) includes many tools, distributed teams, open-source code, and cloud platforms. Constant focus on speed to release software to market, along with the traditional slow and manual security checks has caused gaps in continuous security as an important piece in the software supply chain. Today organizations feel more susceptible to external and internal cyber threats due to the vast attack surface in their applications supply chain and the lack of end-to-end governance and risk management.
The software team must secure its software delivery process to avoid vulnerability and security breaches. This needs to be achieved with existing tool chains and without extensive rework of the delivery processes. This talk will present strategies and techniques for providing visibility into the true risk of the existing vulnerabilities, preventing the introduction of security issues in the software, resolving vulnerabilities in production environments quickly, and capturing the deployment bill of materials (DBOM).
Speakers:
Bob Boule
Robert Boule is a technology enthusiast with PASSION for technology and making things work along with a knack for helping others understand how things work. He comes with around 20 years of solution engineering experience in application security, software continuous delivery, and SaaS platforms. He is known for his dynamic presentations in CI/CD and application security integrated in software delivery lifecycle.
Gopinath Rebala
Gopinath Rebala is the CTO of OpsMx, where he has overall responsibility for the machine learning and data processing architectures for Secure Software Delivery. Gopi also has a strong connection with our customers, leading design and architecture for strategic implementations. Gopi is a frequent speaker and well-known leader in continuous delivery and integrating security into software delivery.
Builder.ai Founder Sachin Dev Duggal's Strategic Approach to Create an Innova...Ramesh Iyer
In today's fast-changing business world, Companies that adapt and embrace new ideas often need help to keep up with the competition. However, fostering a culture of innovation takes much work. It takes vision, leadership and willingness to take risks in the right proportion. Sachin Dev Duggal, co-founder of Builder.ai, has perfected the art of this balance, creating a company culture where creativity and growth are nurtured at each stage.
JMeter webinar - integration with InfluxDB and GrafanaRTTS
Watch this recorded webinar about real-time monitoring of application performance. See how to integrate Apache JMeter, the open-source leader in performance testing, with InfluxDB, the open-source time-series database, and Grafana, the open-source analytics and visualization application.
In this webinar, we will review the benefits of leveraging InfluxDB and Grafana when executing load tests and demonstrate how these tools are used to visualize performance metrics.
Length: 30 minutes
Session Overview
-------------------------------------------
During this webinar, we will cover the following topics while demonstrating the integrations of JMeter, InfluxDB and Grafana:
- What out-of-the-box solutions are available for real-time monitoring JMeter tests?
- What are the benefits of integrating InfluxDB and Grafana into the load testing stack?
- Which features are provided by Grafana?
- Demonstration of InfluxDB and Grafana using a practice web application
To view the webinar recording, go to:
https://www.rttsweb.com/jmeter-integration-webinar
LF Energy Webinar: Electrical Grid Modelling and Simulation Through PowSyBl -...DanBrown980551
Do you want to learn how to model and simulate an electrical network from scratch in under an hour?
Then welcome to this PowSyBl workshop, hosted by Rte, the French Transmission System Operator (TSO)!
During the webinar, you will discover the PowSyBl ecosystem as well as handle and study an electrical network through an interactive Python notebook.
PowSyBl is an open source project hosted by LF Energy, which offers a comprehensive set of features for electrical grid modelling and simulation. Among other advanced features, PowSyBl provides:
- A fully editable and extendable library for grid component modelling;
- Visualization tools to display your network;
- Grid simulation tools, such as power flows, security analyses (with or without remedial actions) and sensitivity analyses;
The framework is mostly written in Java, with a Python binding so that Python developers can access PowSyBl functionalities as well.
What you will learn during the webinar:
- For beginners: discover PowSyBl's functionalities through a quick general presentation and the notebook, without needing any expert coding skills;
- For advanced developers: master the skills to efficiently apply PowSyBl functionalities to your real-world scenarios.
UiPath Test Automation using UiPath Test Suite series, part 4DianaGray10
Welcome to UiPath Test Automation using UiPath Test Suite series part 4. In this session, we will cover Test Manager overview along with SAP heatmap.
The UiPath Test Manager overview with SAP heatmap webinar offers a concise yet comprehensive exploration of the role of a Test Manager within SAP environments, coupled with the utilization of heatmaps for effective testing strategies.
Participants will gain insights into the responsibilities, challenges, and best practices associated with test management in SAP projects. Additionally, the webinar delves into the significance of heatmaps as a visual aid for identifying testing priorities, areas of risk, and resource allocation within SAP landscapes. Through this session, attendees can expect to enhance their understanding of test management principles while learning practical approaches to optimize testing processes in SAP environments using heatmap visualization techniques
What will you get from this session?
1. Insights into SAP testing best practices
2. Heatmap utilization for testing
3. Optimization of testing processes
4. Demo
Topics covered:
Execution from the test manager
Orchestrator execution result
Defect reporting
SAP heatmap example with demo
Speaker:
Deepak Rai, Automation Practice Lead, Boundaryless Group and UiPath MVP
Let's dive deeper into the world of ODC! Ricardo Alves (OutSystems) will join us to tell all about the new Data Fabric. After that, Sezen de Bruijn (OutSystems) will get into the details on how to best design a sturdy architecture within ODC.
Search and Society: Reimagining Information Access for Radical FuturesBhaskar Mitra
The field of Information retrieval (IR) is currently undergoing a transformative shift, at least partly due to the emerging applications of generative AI to information access. In this talk, we will deliberate on the sociotechnical implications of generative AI for information access. We will argue that there is both a critical necessity and an exciting opportunity for the IR community to re-center our research agendas on societal needs while dismantling the artificial separation between the work on fairness, accountability, transparency, and ethics in IR and the rest of IR research. Instead of adopting a reactionary strategy of trying to mitigate potential social harms from emerging technologies, the community should aim to proactively set the research agenda for the kinds of systems we should build inspired by diverse explicitly stated sociotechnical imaginaries. The sociotechnical imaginaries that underpin the design and development of information access technologies needs to be explicitly articulated, and we need to develop theories of change in context of these diverse perspectives. Our guiding future imaginaries must be informed by other academic fields, such as democratic theory and critical theory, and should be co-developed with social science scholars, legal scholars, civil rights and social justice activists, and artists, among others.
Smart TV Buyer Insights Survey 2024 by 91mobiles.pdf91mobiles
91mobiles recently conducted a Smart TV Buyer Insights Survey in which we asked over 3,000 respondents about the TV they own, aspects they look at on a new TV, and their TV buying preferences.
2. International Journal of Civil Engineering Research and Development (IJCERD), ISSN 2248-
9428 (Print), ISSN- 2248-9436 (Online) Volume 4, Number 2, April - June (2014)
10
(ii) a rainfall-runoff forecasting model, (iii) a flood routing model. The ability to provide
reliable forecast of river stages for a short period following the storm is of great importance in
planning proper actions during flood event. This article focuses on the development of the flood
forecasting model.
In general, the flood routing can be classified into two categories including hydrologic
method and hydraulic method. Among the hydraulic method can be widely applied to some
special problems that hydrologic techniques cannot overcome and achieve the desired degree of
accuracy. But, many researchers used various adaptive techniques and the real-time
observation data to develop the real-time hydro-logical forecasting model in most practical
applications. The various adaptive techniques include the time series analysis, linear Kalman
filter, multiple regression analysis, and statistical method. The real-time observation data
including the rainfall, temperature, water stage, and soil moisture were employed in their
models for subsequent forecasting.
Hydrologic models were frequently applied to the real-time flow discharge forecasting
with adaptive techniques, but they lack the water stages and detailed flow information in a river
basin. Hydraulic models can provide the detailed flow information based on basic physical
processes, but are unable to use the real-time data to adjust the flow. Hence, building a real-time
flood-forecasting model by hydraulic routing is one of the most challenging and important tasks
for the hydrologists. The purpose of this study is to develop a dynamic routing model with
real-time stage correction method .The model should provide the real-time water stage for the
significant locations in the river system and improve the accuracy of subsequent forecasting.
II. GEOGRAPHIC SETTING OF GODAVARI BASIN
Godavari basin extends over an area of 3, 12,812 sq kms, covering nearly 9.5% of total
area of India. The Godavari River is perennial and is the second largest river in India. The river
joins Bay of Bengal after flowing a distance of 1470 km (CWC 2005).It flows through the
Eastern Ghats and emerges into the plains after passing Koida. Pranahita, Sabari and Indravathi
are the main tributaries of Godavari River. (Fig 1).The basin receives major part of its rainfall
during South West Monsoon period. More than 85 percent of the rain falls from July to
September. Annual rainfall of the basin varies from 880 to 1395 mm and the average annual
rainfall is 1110 mm.Floods are a regular phenomenon in the basin. Badrachalam, Kunavaram,
and the deltaic portion of the river are prone to floods frequently.Perur and Koida gauge
stations are the main base stations of the Central Water Commission for flood forecasting in the
basin. Geographic setting and locations of these basin stations are shown in Figure 1[4]
Fig. 1: Geographic setting of Godavari Basin [4]
3. International Journal of Civil Engineering Research and Development (IJCERD), ISSN 2248-
9428 (Print), ISSN- 2248-9436 (Online) Volume 4, Number 2, April - June (2014)
11
III. FLOOD ROUTING
In hydrology, routing is a technique used to predict the changes in shape of water as it
moves through a river channel or a reservoir. In flood forecasting, hydrologists may want to
know how a short burst of intense rain in an area upstream of a city will change as it reaches the
city. Routing can be used to determine whether the pulse of rain reaches the city as a deluge or
a trickle. . Flood routing is important in the design of flood protection measures, to estimate
how the proposed measures will affect the behaviour of flood waves in rivers, so that adequate
protection and economic solutions may be found.
Central Water Commission started flood-forecasting services in 1958 with the setting
up of its first forecasting station on Yamuna at Delhi Railway Bridge. The Flood Forecasting
Services of CWC consists of collection of Hydrological/ Hydro-meteorological data from 878
sites, transmission of the data using wireless/ fax/ email/ telephones /satellites /mobiles,
processing of data, formulation of forecast and dissemination of the same. Presently, a network
of 175 Flood Forecasting Stations including 28 inflow forecast, in 9 major river basins and 71
sub basins of the country exists. It covers 15 States besides NCT Delhi and UT of Dadra &
Nagar Haveli. Central Water Commission on an average issues 6000 flood forecasts with an
accuracy of more than 95% every year. [3]
Fig. 2: Hydrological land covers of Godavari Basin Lake
Fig. 3: Topographic model of Godavari Basin
4. International Journal of Civil Engineering Research and Development (IJCERD), ISSN 2248-
9428 (Print), ISSN- 2248-9436 (Online) Volume 4, Number 2, April - June (2014)
12
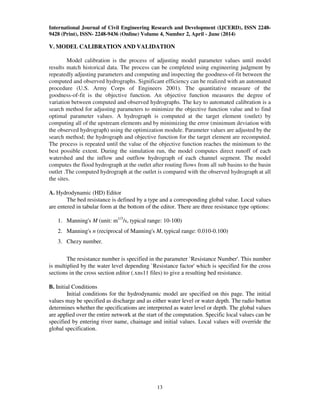
IV. MODELING APPROACH AND METHODOLOGY
MIKE 11 is a professional engineering software tool for the simulation of hydrology,
hydraulics, water quality and sediment transport in estuaries, rivers, irrigation systems and
other inland waters. MIKE 11 is a modeling package for the simulation of surface runoff, flow,
sediment transport, and water quality in rivers, channels, estuaries, and floodplains.
A. Hydrodynamic (HD) Module [1, 2]
The most commonly applied hydrodynamic (HD) model is a flood management tool
simulating the unsteady flows in branched and looped river networks and quasi
two-dimensional flows in floodplains. MIKE 11 HD, when using the fully dynamic wave
description, solves the equations of conservation of continuity and momentum (known as the
'Saint Venant' equations). The solutions to the equations are based on the following
assumptions:
• The water is incompressible and homogeneous (i.e. negligible variation in density)
• The bottom slope is small, thus the cosine of the angle it makes with the horizontal may
be taken as 1
• The wave lengths are large compared to the water depth, assuming that the flow
everywhere can be assumed to flow parallel to the bottom (i.e. vertical accelerations can
be neglected and a hydrostatic pressure variation in the vertical direction can be
assumed)
• The flow is sub-critical (super-critical flow is modeled in MIKE 11, however more
restrictive conditions are applied)
The equations used are:
CONTINUITY:
MOMENTUM:
Where
• Q:discharge,(m³/s)
• A:flowarea,(m²)
• q:lateral inflow,(m²/s)
• h:stage above datum,(m)
• C:Chezy resistance coefficient,(m½/s)
• R:hydraulic or resistance radius,(m)
• I: momentum distribution coefficient
5. International Journal of Civil Engineering Research and Development (IJCERD), ISSN 2248-
9428 (Print), ISSN- 2248-9436 (Online) Volume 4, Number 2, April - June (2014)
13
V. MODEL CALIBRATION AND VALIDATION
Model calibration is the process of adjusting model parameter values until model
results match historical data. The process can be completed using engineering judgment by
repeatedly adjusting parameters and computing and inspecting the goodness-of-fit between the
computed and observed hydrographs. Significant efficiency can be realized with an automated
procedure (U.S. Army Corps of Engineers 2001). The quantitative measure of the
goodness-of-fit is the objective function. An objective function measures the degree of
variation between computed and observed hydrographs. The key to automated calibration is a
search method for adjusting parameters to minimize the objective function value and to find
optimal parameter values. A hydrograph is computed at the target element (outlet) by
computing all of the upstream elements and by minimizing the error (minimum deviation with
the observed hydrograph) using the optimization module. Parameter values are adjusted by the
search method; the hydrograph and objective function for the target element are recomputed.
The process is repeated until the value of the objective function reaches the minimum to the
best possible extent. During the simulation run, the model computes direct runoff of each
watershed and the inflow and outflow hydrograph of each channel segment. The model
computes the flood hydrograph at the outlet after routing flows from all sub basins to the basin
outlet .The computed hydrograph at the outlet is compared with the observed hydrograph at all
the sites.
A. Hydrodynamic (HD) Editor
The bed resistance is defined by a type and a corresponding global value. Local values
are entered in tabular form at the bottom of the editor. There are three resistance type options:
1. Manning's M (unit: m1/3
/s, typical range: 10-100)
2. Manning's n (reciprocal of Manning's M, typical range: 0.010-0.100)
3. Chezy number.
The resistance number is specified in the parameter `Resistance Number'. This number
is multiplied by the water level depending `Resistance factor' which is specified for the cross
sections in the cross section editor (.xns11 files) to give a resulting bed resistance.
B. Initial Conditions
Initial conditions for the hydrodynamic model are specified on this page. The initial
values may be specified as discharge and as either water level or water depth. The radio button
determines whether the specifications are interpreted as water level or depth. The global values
are applied over the entire network at the start of the computation. Specific local values can be
specified by entering river name, chainage and initial values. Local values will override the
global specification.
6. International Journal of Civil Engineering Research and Development (IJCERD), ISSN 2248-
9428 (Print), ISSN- 2248-9436 (Online) Volume 4, Number 2, April - June (2014)
14
Fig. 4: Initial Conditions of Hydrodynamic Editor
C. Bed Resistance Toolbox
The bed resistance toolbox offers a possibility to make the program calculate the bed
resistance as a function of the hydraulic parameters during the computation by applying a
Bed Resistance Equation.
Fig. 5: Bed Resistance Toolbox of Hydrodynamic Editor
7. International Journal of Civil Engineering Research and Development (IJCERD), ISSN 2248-
9428 (Print), ISSN- 2248-9436 (Online) Volume 4, Number 2, April - June (2014)
15
D. Surface and Root zone Parameters
The initial relative water contents of surface and root zone storage must be specified as
well as the initial values of overland flow and interflow. Parameters used in surface and root
zone are given below:
Fig. 6: Surface root zone parameters of Rainfall-Runoff Editor
The model is calibrated for the years 2009, 2010, 2011.After computing the exact value
of the unknown variable during the calibration process; the calibrated model parameters are
tested for another set of field observations to estimate the model accuracy. In this process, if the
calibrated parameters do not fit the data of validation, the required parameters have to be
calibrated again. Thorough investigation is needed to identify the parameters to be calibrated
again. In this study, hydro meteorological data of 2012 were used for model validation.
VI. REAL TIME VALIDATION OF THE MODEL
The developed model has been validated thoroughly at the Central Water Commission
Office in Hyderabad with the real-time hydro meteorological data during the floods of 2013(the
simulation period is 15 June to 15 October 2013). Considering the availability of real-time data,
discharge data of the PERUR, Rainfall Data of Perur, Eturnagaram, Dummagudem and
Badrachalam (Figure 1) were fed into the model as inputs. Rainfall runoff modeling was done
in all the sub basins located in the study area down to the above mentioned stations.
Hydrodynamic flow routing was also done in all the river channels. In real-time validation, the
total flood routing stretch is approximately 133 km long (Perur to Badrachalam). The selected
river reach Perur to Badrachalam is an ideal stretch as we have catchment area, flood routing,
and a tributary joining in middle and the stretch is not very long, the intermittent catchment
contribution is less. For study purpose this is the best stretch.
VII. RESULTS AND DISCUSSIONS
Agricultural land is the predominant land-use type in the study area that is severely
exposed to floods every year. Slopes in the deltaic portion of the river are very flat (less than 3
8. International Journal of Civil Engineering Research and Development (IJCERD), ISSN 2248-
9428 (Print), ISSN- 2248-9436 (Online) Volume 4, Number 2, April - June (2014)
16
percent), causing frequent inundation in this area. Soils in the study area are very fine in texture,
resulting in more runoff.
The computed hydrograph during the validation process and observed hydrograph at
Perur and Badrachalam stations are shown in Figures below.
Fig. 7: Comparison of Actual Perur Water Level graph with the Simulated Perur Water Level
graph for the year 2012
Fig. 8: Comparison of Actual Badrachalam Water Level graph with the Simulated
Badrachalam Water Level graph for the year 2012
9. International Journal of Civil Engineering Research and Development (IJCERD), ISSN 2248-
9428 (Print), ISSN- 2248-9436 (Online) Volume 4, Number 2, April - June (2014)
17
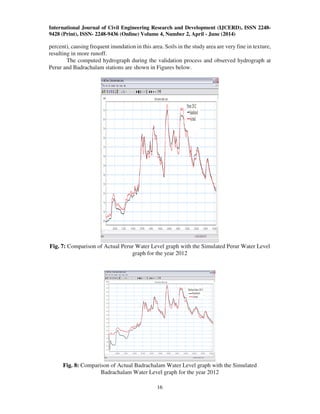
Fig. 9: Comparison of Actual Perur Water Level graph with the Simulated Perur Water Level
graph for the year 2013
Fig. 10: Comparison of Actual Badrachalam Water Level graph with the Simulated
Badrachalam Water Level graph for the year 2013
The computed hydrograph during the validation process and observed hydrograph at
Perur and Badrachalam stations are shown in Figures. These figures indicate that the computed
hydrographs match well with the observed hydrographs.
REFERENCES
[1] Danish Hydraulic Institute (1994): MIKE 11 FF Short description: Real Time flood
forecasting and modeling
[2] DHI (2002) MIKE II: A Modeling System for Rivers and Channels. Reference Manual,
DHI Software 2002, DHI Water & Environment, Horsholm, Denmark.
[3] CWC (Central Water Commission of India). 1989. Manual on Flood Forecasting. New
Delhi: Central Water Commission.
[4] Korada Hari Venkata Durga Rao*, Vala Venkateshwar Rao, Vinay Kumar Dadhwal,
Gandarbha Behera, and Jaswant Raj Sharma.,2011.A Distributed Model for Real-Time
Flood Forecasting in the Godavari Basin Using special inputs.
10. International Journal of Civil Engineering Research and Development (IJCERD), ISSN 2248-
9428 (Print), ISSN- 2248-9436 (Online) Volume 4, Number 2, April - June (2014)
18
[5] Danish Hydraulic Institute (2003). MIKE 11 Reference Manual and User Guide, 2003
Amein, M., Fang, C.S.,
[6] 1970. Implicit flood routing in natural channel. Journal of Hydraulics Division, ASCE
96 (12), 2481–2500
[7] Bairacharya, K., Barry, D.A., 1997. Accuracy criteria for linearised diffusion wave
flood routing. Journal of Hydrology 195, 200–217
[8] Bobinski, E., Mierkiewicz, M., 1986. Recent developments in simple adaptive flow
forecasting models in Poland. Hydro- logical Sciences 31, 297–320.
[9] Chow, V.T., Maidment, D.R., Mays, L.W., 1988. Applied Hydrology, McGraw-Hill,
New York.
[10] Chow, V.T., 1973. Open-Channel Hydraulics, McGraw-Hill, New York
[11] David, C.C., Smith, G.F., 1980. The United States weather service river forecast system.
Real-Time Forecasting/Control of Water Resource Systems, 305 –325
[12] Franchini, M., Lamberti, P., 1994. A flood routing Muskingum type simulation and
forecasting model based on level data along Water Resources Research 30 (7),
2183–2196.
[13] Jorgensen, G. H., and J. Host-Madsen. 1997. Development of a Flood Forecasting
System in Bangladesh. In Proceedings of Conference