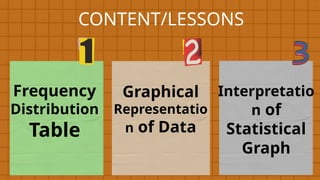
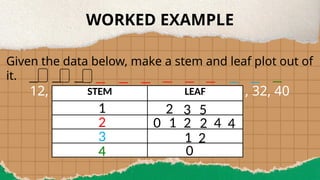
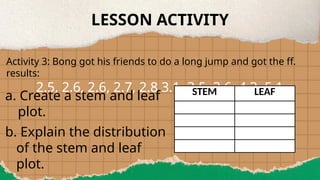
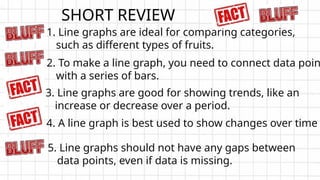
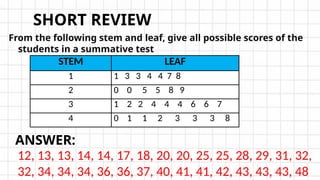
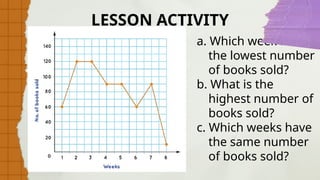
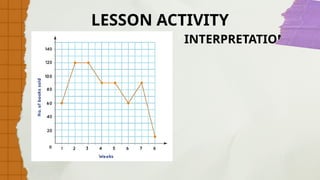
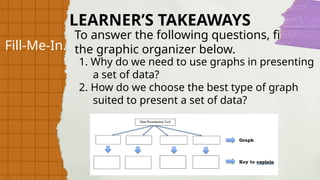
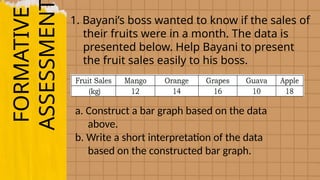
The document outlines lessons for grade 7 math students focused on statistical graphs, including bar graphs, line graphs, and stem-and-leaf plots. It emphasizes the importance of visual data representation for easier understanding and interpretation, along with examples and exercises for practical applications. Key elements discussed include graph construction, data interpretation, and comparative analysis of various data sets.