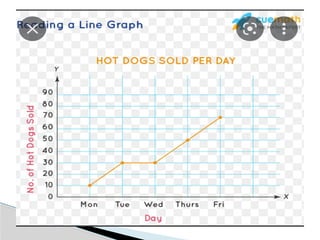
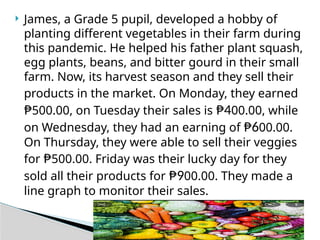
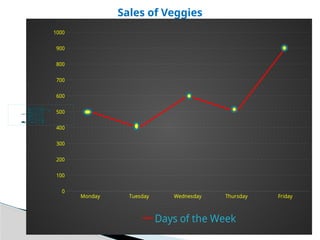
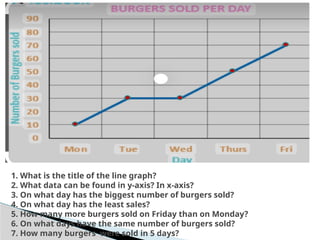
WELCOME!
2nd
Classroom Observation
MATHEMATICS 5
NOVY C. CUEVAS
Teacher I
5, 10, 15, 20, 25, 30, 35, 40, 45, 50
10, 20, 30, 40, 50, 60, 70, 80, 90, 100
100, 200, 300, 400, 500, 600, 700, 800,
900, 1000
Interpreting
Line Graphs
 James, a Grade 5 pupil, developed a hobby of
planting different vegetables in their farm during
this pandemic. He helped his father plant squash,
egg plants, beans, and bitter gourd in their small
farm. Now, its harvest season and they sell their
products in the market. On Monday, they earned
₱500.00, on Tuesday their sales is ₱400.00, while
on Wednesday, they had an earning of ₱600.00.
On Thursday, they were able to sell their veggies
for ₱500.00. Friday was their lucky day for they
sold all their products for ₱900.00. They made a
line graph to monitor their sales.
Sales of Veggies
Monday Tuesday Wednesday Thursday Friday
0
100
200
300
400
500
600
700
800
900
1000
Days of the Week
What is the line graph all
about?
What data can be found in x-
axis? y-axis?
What is the scale used in the
y-axis?
How much did they earn on
Monday? Wednesday? Friday
 What day has the highest sale?
How much? Lowest? How
much?
 What days have the same
amount of sales?
 How much more earnings they
got on Friday than on Tuesday?
 How much did they earn in 5
days?
 Determine the given data in x and y
axes
 Determine the range of the graph
 Base your answers from the data
presented in the graph
 In a line graph, a line that goes up
means an increase in value, while a
line that goes down from its
previous point means a decrease in
value.
Interpreting a Line Graph
1. What is the title of the line graph?
2. What data can be found in y-axis? In x-axis?
3. On what day Caleb spent most of the time in his assignment?
4. On what day he spent the least?
5. How many more minutes did he spend on Tuesday than on Monday?
6. How many minutes did he spend on Thursday?
7. How many minutes did he spend on his homework the whole week?
Let’s Go Fishing!
Individual
Activity
Group Activity
Generalizatio
n
 Determine the given data in x and y
axes
 Determine the range of the graph
 Base your answers from the data
presented in the graph
 In a line graph, a line that goes up
means an increase in value, while a
line that goes down from its
previous point means a decrease in
value.
Interpreting a Line Graph
Evaluation
1. What is the title of the line graph?
2. What data can be found in y-axis? In x-axis?
3. On what day has the biggest number of burgers sold?
4. On what day has the least sales?
5. How many more burgers sold on Friday than on Monday?
6. On what days have the same number of burgers sold?
7. How many burgers were sold in 5 days?
Enrichmen
t
Lm

Classroom Demonstration Teaching in.pptx

  • 1.
  • 2.
    5, 10, 15,20, 25, 30, 35, 40, 45, 50 10, 20, 30, 40, 50, 60, 70, 80, 90, 100 100, 200, 300, 400, 500, 600, 700, 800, 900, 1000
  • 4.
  • 6.
     James, aGrade 5 pupil, developed a hobby of planting different vegetables in their farm during this pandemic. He helped his father plant squash, egg plants, beans, and bitter gourd in their small farm. Now, its harvest season and they sell their products in the market. On Monday, they earned ₱500.00, on Tuesday their sales is ₱400.00, while on Wednesday, they had an earning of ₱600.00. On Thursday, they were able to sell their veggies for ₱500.00. Friday was their lucky day for they sold all their products for ₱900.00. They made a line graph to monitor their sales.
  • 7.
    Sales of Veggies MondayTuesday Wednesday Thursday Friday 0 100 200 300 400 500 600 700 800 900 1000 Days of the Week
  • 8.
    What is theline graph all about? What data can be found in x- axis? y-axis? What is the scale used in the y-axis? How much did they earn on Monday? Wednesday? Friday
  • 9.
     What dayhas the highest sale? How much? Lowest? How much?  What days have the same amount of sales?  How much more earnings they got on Friday than on Tuesday?  How much did they earn in 5 days?
  • 10.
     Determine thegiven data in x and y axes  Determine the range of the graph  Base your answers from the data presented in the graph  In a line graph, a line that goes up means an increase in value, while a line that goes down from its previous point means a decrease in value. Interpreting a Line Graph
  • 11.
    1. What isthe title of the line graph? 2. What data can be found in y-axis? In x-axis? 3. On what day Caleb spent most of the time in his assignment? 4. On what day he spent the least? 5. How many more minutes did he spend on Tuesday than on Monday? 6. How many minutes did he spend on Thursday? 7. How many minutes did he spend on his homework the whole week?
  • 12.
  • 13.
  • 15.
  • 17.
  • 18.
     Determine thegiven data in x and y axes  Determine the range of the graph  Base your answers from the data presented in the graph  In a line graph, a line that goes up means an increase in value, while a line that goes down from its previous point means a decrease in value. Interpreting a Line Graph
  • 19.
  • 20.
    1. What isthe title of the line graph? 2. What data can be found in y-axis? In x-axis? 3. On what day has the biggest number of burgers sold? 4. On what day has the least sales? 5. How many more burgers sold on Friday than on Monday? 6. On what days have the same number of burgers sold? 7. How many burgers were sold in 5 days?
  • 21.
  • 22.