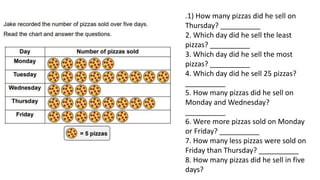
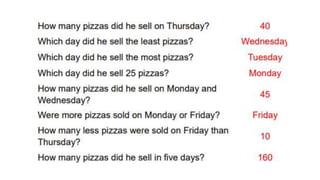
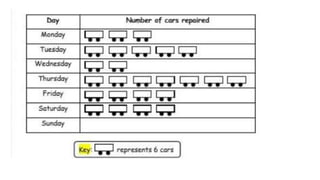
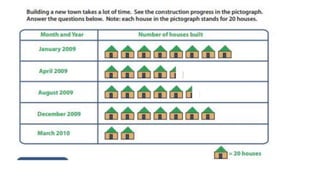
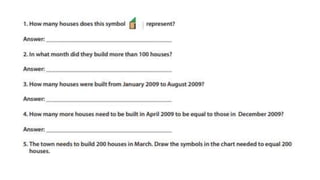
INTERPRETING
PICTOGRAPHS
What is a
Pictograph
•A pictograph, also known as a
pictogram, is the pictorial
representation of data using
images, icons, or symbols. We can
represent the frequency of data
while using symbols or images that
are relevant using a pictograph.
.1) How many pizzas did he sell on
Thursday? __________
2. Which day did he sell the least
pizzas? __________
3. Which day did he sell the most
pizzas? __________
4. Which day did he sell 25 pizzas?
__________
5. How many pizzas did he sell on
Monday and Wednesday?
__________
6. Were more pizzas sold on Monday
or Friday? __________
7. How many less pizzas were sold on
Friday than Thursday? __________
8. How many pizzas did he sell in five
days?
The chart shows some data for you to display in a
pictograph.
• What symbol will you
use to represent the
number of bones?
• b) How many bones will
each symbol represent?
•
PPT on pictographs.pptx

PPT on pictographs.pptx

  • 1.
  • 2.
    What is a Pictograph •Apictograph, also known as a pictogram, is the pictorial representation of data using images, icons, or symbols. We can represent the frequency of data while using symbols or images that are relevant using a pictograph.
  • 3.
    .1) How manypizzas did he sell on Thursday? __________ 2. Which day did he sell the least pizzas? __________ 3. Which day did he sell the most pizzas? __________ 4. Which day did he sell 25 pizzas? __________ 5. How many pizzas did he sell on Monday and Wednesday? __________ 6. Were more pizzas sold on Monday or Friday? __________ 7. How many less pizzas were sold on Friday than Thursday? __________ 8. How many pizzas did he sell in five days?
  • 5.
    The chart showssome data for you to display in a pictograph. • What symbol will you use to represent the number of bones? • b) How many bones will each symbol represent? •