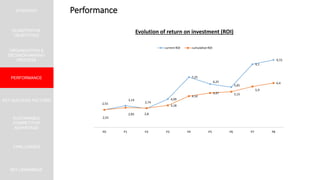
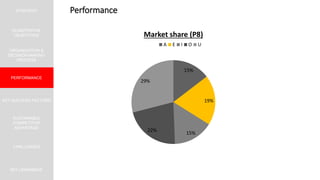
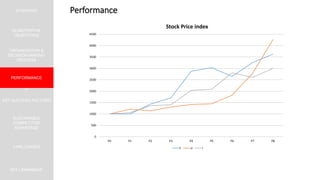
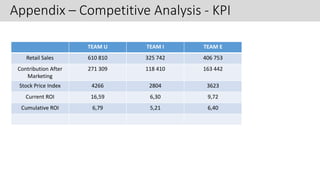
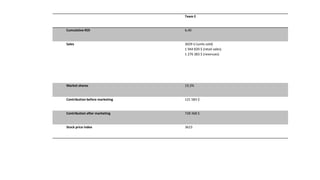
Team E achieved a cumulative ROI of 6.4%, generated $1.276 billion in revenues through sales of 3029 units, and increased their market share to 19.3%, resulting in a $728 thousand contribution after marketing and a stock price index of 3623. Their strong financial performance was driven by growing market share and revenues while maintaining high returns on investment.
3. STRATEGY
QUANTITATIVE
OBJECTIVES
ORGANIZATION &
DECISION-MAKING
PROCESS
PERFORMANCE
CHALLENGES
KEY SUCCESS FACTORS
SUSTAINABLE
COMPETITIVE
ADVANTAGE
Organization & Decision-making process
KEY LEARNINGS
Brand by Brand decisions
1
• Data analysis and benchmarking (competitors’ analysis)
2
• Calculate prediction for next periods for production levels, product
characteristics (ideal values), distribution channels and sales force, price
changing and advertising
3
• Analyse profitability of each brand
4
• Even though each person has an individual responsibility, all team members
participate in every product decision
11. STRATEGY
QUANTITATIVE
OBJECTIVES
ORGANIZATION &
DECISION-MAKING
PROCESS
PERFORMANCE
CHALLENGES
KEY SUCCESS FACTORS
SUSTAINABLE
COMPETITIVE
ADVANTAGE
Challenges
KEY LEARNINGS
• Achieve and maintain leadership in competitive markets.
LEADERSHIP
• Budget management and allocation (brands and markets).
• Decide the financial efforts that should be allocated to products with distinct ROI.
RESOURCES
• Understand the competitors strategy and anticipate competitors moves.
• Compete with other products that target the same segment and better fit the segment needs.
• Compete with lower priced products in the market (Vodite – Company U).
COMPETITION
• Estimation of production level (with uncertainty about new product launches by competitors).
PRODUCTION
• Constantly adapt the products characteristics/perceptions according to the consumers preferences evolution.
Be one step ahead of the market needs.
• Existence of product cannibalization between products that target different segments in the Sonite Market.
• Need to reposition a product for a different consumer segment.
CONSUMER PREFERENCES
• Decide whether a product should be kept in the product portfolio or dropped out - SEMI(good decision), SELF
(mistake).
UNDERPERFORMING PRODUCTS
12. STRATEGY
QUANTITATIVE
OBJECTIVES
ORGANIZATION &
DECISION-MAKING
PROCESS
PERFORMANCE
CHALLENGES
KEY SUCCESS FACTORS
SUSTAINABLE
COMPETITIVE
ADVANTAGE
Key Learnings
KEY LEARNINGS
Each product must target
one customer segment.
Select high-growing
profitable segments.
Manage products requires
a deep analysis of the
market and product
performance.
Competition evolves over
time.
Consumer preferences
evolve over time.
Marketing is a crucial
element to model
consumer perceptions
regarding products.
Innovation is a key factor –
R&D to launch new
products and expansion
opportunities to new
markets.
First-mover advantage
(Vodite Market).
Understand when to drop
off a underperforming
product
Need to correctly forecast
the production level
15. Appendix – BCG (Sonite – Period 8)
Product Revenues
% of Company E
revenues
Company E largest
rival’s market share
Company E
market share
Relative market
share
“SELF" $36.349 41% 27,80% 24,90% 89,57%
“SEKA" $53.154 59% 50,50% 45,9% 90,89%
Note:
• SELF major competitor – SULI (Company U)
• SEKA major competitor – SIHI (Company I)
In the Sonite Market, Company E has 2 products in this period – SELF and SEKA
16. Appendix – BCG (Sonite – Period 8)
STARS
- High Market Share and High Market
Growth
QUESTION MARKS
- Low Market Share and High Market
Growth
CASH COWS
- High Market Share and Low Market
Growth
DOGS
- Low Market Share and Low Market
Growth
High
Low
LowHigh
MarketGrowth
Relative Market Share
SELF
SEKA
Excluded in Period 2
10,9%
100%
17. Appendix – BCG (Vodite – Period 8)
Note:
• VEST major competitor – VUFF (Company U)
• VEZA major competitor – VANA (Company A)
In the Vodite Market, Company E has 2 products in this period – VEST and VEZA
Product Revenues
% of Company E
revenues
Company E largest rival’s
market share
Company E
market share
Relative market
share
“VEST" $132.601 73% 43,0% 22,80% 53,02%
“VEZA" $48.810 27% 33,2% 27,30% 82,23%
18. Appendix – BCG (Vodite – Period 8)
STARS
- High Market Share and High Market
Growth
QUESTION MARKS
- Low Market Share and High Market
Growth
CASH COWS
- High Market Share and Low Market
Growth
DOGS
- Low Market Share and Low Market
Growth
High
Low
LowHigh
MarketGrowth
Relative Market Share
VEZA
VEST
Excluded in Period 2
78,8%
100%
20. TEAM U TEAM I TEAM E
Retail Sales 610 810 325 742 406 753
Contribution After
Marketing
271 309 118 410 163 442
Stock Price Index 4266 2804 3623
Current ROI 16,59 6,30 9,72
Cumulative ROI 6,79 5,21 6,40
Appendix – Competitive Analysis - KPI
21. TEAM U TEAM I TEAM E
Competitive
Advertising (Sonites)
4 550 3 550 3 900
Competitive
Advertising (Vodites)
4400 8300 6550
Total 8950 11850 10450
Competitive Sales
Force (Sonites)
124 139 113
Competitive Sales
Force (Vodites)
153 90 98
Total 277 229 211
Appendix – Competitive Analysis - Marketing
22. • Contribution before marketing – Contribution after marketing = ...
Contribution TEAM U TEAM I TEAM E
Before Marketing 287 666 136 205 179 252
After Marketing 271 309 118 410 163 442
Value 18 357 17 795 15 810
Appendix – Competitive Analysis - Marketing
23. Product Professionals High Earners Innovators Followers
SALT 532 - - -
SIBI 535 - - -
SONO 540 - - -
SULI 562 - - -
SELF 525 - - -
SIHI - 490 - -
SEKA - 500 - -
VANA - - 1250 -
VIVO - - 1350 -
VOVO - - 1350 -
VEZA - - 1250 -
VOFL - - - 850
VUFF - - - 930
VEST - - - 850
Appendix – Competitive Analysis - pricing
27. 0
100
200
300
400
500
600
700
800
Period 0 Period 1 Period 2 Period 3 Period 4 Period 5 Period 6 Period 7 Period 8
SINGLES
PROFESSIONALS
HIGH EARNERS
Segment growth rate SONITE
MARKET
ActualMarketSize
28. 0
10
20
30
40
50
60
Period 0 Period 1 Period 2 Period 3 Period 4 Period 5 Period 6 Period 7 Period 8
SEMI
SELF
SEKA
Market share growth rate
SONITE MARKET
MarketShare(%)