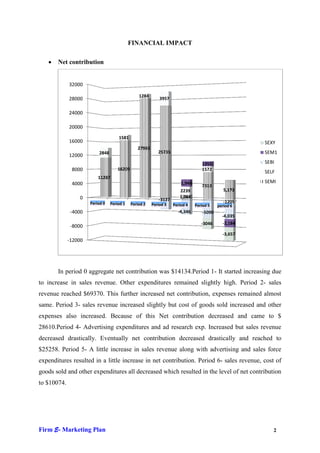
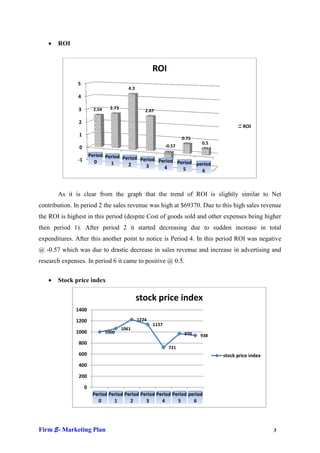
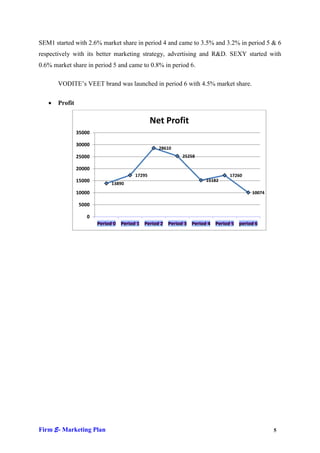
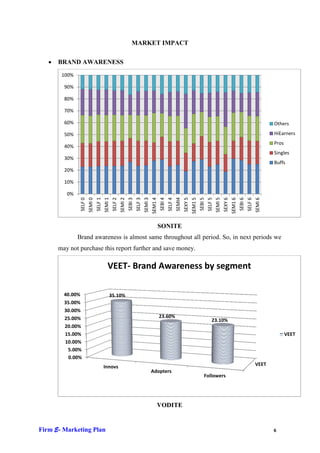
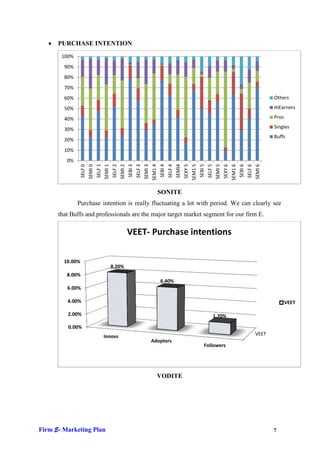
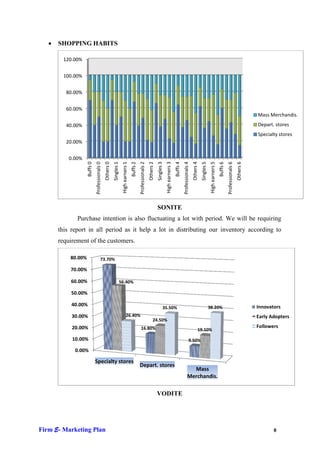
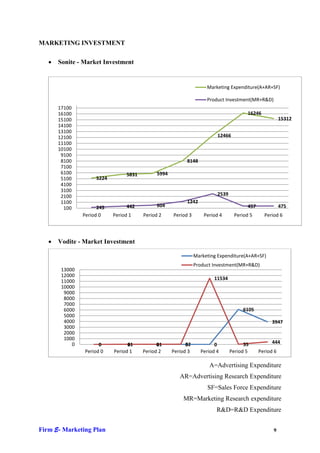
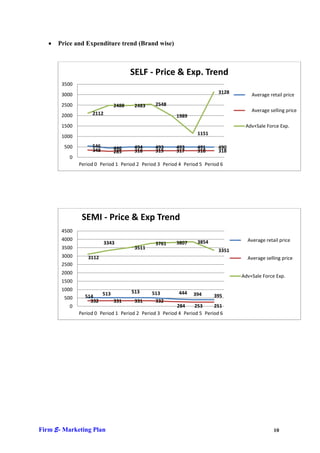
SlideShare a Scribd company logo
SUBMITTED TO Dr. anita basalingappa

                         January, 2012


Firm E- Marketing Plan                               1
FINANCIAL IMPACT

   ï‚·   Net contribution


             32000

                                                 1284
             28000                                          3957

             24000

             20000
                                     1581
             16000                                                                                    SEXY
                                                27983
                          2848                             25735                                      SEM1
             12000
                                                                                  1355                SEBI
              8000                   16209                                        1572
                                                                                                      SELF
                          11287
              4000                                                     1,944                          SEMI
                                                                                  7313
                                                                      2239                    5,173
                 0                                                    1,064
                                                           -3127                              -1205
                      Period 0   Period 1    Period 2   Period 3   Period 4    Period 5    period 6
              -4000                                                  -4,346        -5090
                                                                                             -4,035
                                                                                  -3046      -2,184
              -8000
                                                                                             -3,657
             -12000


       In period 0 aggregate net contribution was $14134.Period 1- It started increasing due
to increase in sales revenue. Other expenditures remained slightly high. Period 2- sales
revenue reached $69370. This further increased net contribution, expenses remained almost
same. Period 3- sales revenue increased slightly but cost of goods sold increased and other
expenses also increased. Because of this Net contribution decreased and came to $
28610.Period 4- Advertising expenditures and ad research exp. Increased but sales revenue
decreased drastically. Eventually net contribution decreased drastically and reached to
$25258. Period 5- A little increase in sales revenue along with advertising and sales force
expenditures resulted in a little increase in net contribution. Period 6- sales revenue, cost of
goods sold and other expenditures all decreased which resulted in the level of net contribution
to $10074.


Firm E- Marketing Plan                                                                                   2
ï‚·   ROI


                                                         ROI
               5
                                            4.3
               4

               3         2.54     2.73
                                                     2.67

               2
                                                                                             ROI
               1
                                                                        0.75
                                                                               0.5
               0                                                -0.57
                        Period Period
               -1                     Period Period
                          0      1                  Period Period
                                        2      3                  period
                                                      4      5      6


       As it is clear from the graph that the trend of ROI is slightly similar to Net
contribution. In period 2 the sales revenue was high at $69370. Due to this high sales revenue
the ROI is highest in this period (despite Cost of goods sold and other expenses being higher
then period 1). After period 2 it started decreasing due to sudden increase in total
expenditures. After this another point to notice is Period 4. In this period ROI was negative
@ -0.57 which was due to drastic decrease in sales revenue and increase in advertising and
research expenses. In period 6 it came to positive @ 0.5.

   ï‚·   Stock price index

                                                  stock price index
              1400

              1200                                1224
                                                         1137
                                         1061
              1000              1000                                     970   938
               800
                                                                 721
               600                                                                   stock price index
               400

               200

                    0
                         Period Period Period Period Period Period period
                           0      1      2      3      4      5      6


Firm E- Marketing Plan                                                                                   3
Stock price is highest @ $1224 in period 2. The reasons for this can be many. In
period 2 sales revenue increased. Expenses were slightly higher than previous periods. But
ROI and Net contribution is highest in period 2, which resulted in highest stock price.

       The stock price was lowest @ $721 in period 4. This was due to direct relationship
between Stock price, Net contribution and ROI. The net contribution and ROI are lowest in
this period. This poor performance of company leads to lower stock price. In period 6 stock
price came to $938.

   ï‚·   Market Share

             100%                                                   Market Share
                                                                       0.60%
                                                   1.80%
              90%                        2.70%
                       4.40%
                                5.80%                       2.60%
              80%                                                                4.50%
                                                   3.30%               3.50%
              70%

                                                                                 0.80%            VEET
              60%
                                                            1.90%      1.10%                      SEXY
              50%
                                                                       1.10%     3.20%            SEM1
              40%                        12.50%                                                   SEBI
                       10.60%
                                10.70%                      2.10%                0.70%            SELF
              30%                                 10.30%
                                                                                 0.90%
                                                                                                  SEMI
              20%
                                                                       5.40%
              10%
                                                            2.20%                4.50%
                0%
                      Period 0 Period 1
                                        Period 2 Period 3
                                                          Period 4 Period 5
                                                                               period 6


       In period 0 there were two brands SEMI & SELF in Sonite and their market share
were 10.6% and 4.4% respectively. Team A’s SAMA brand market share was highest @
12.2% in this period. In period 1 both brand’s market share increased slightly. But in period 2
SEMI’s market share increased but SELF’s market share started decreasing. In period 3 SEBI
was launched. And its market share remained at 1.8%. In period 4 and period 5 SEM1 and
SEXY brands were launched respectively. In this period SEMI’s market share was lowest @
2.2 % this was due to Team U’s better market strategy for brand SULI. SULI was at highest
@ 21.1% in this period. SELF and SEBI’s market share remained lowest in period 6. While


Firm E- Marketing Plan                                                                      4
SEM1 started with 2.6% market share in period 4 and came to 3.5% and 3.2% in period 5 & 6
respectively with its better marketing strategy, advertising and R&D. SEXY started with
0.6% market share in period 5 and came to 0.8% in period 6.

       VODITE’s VEET brand was launched in period 6 with 4.5% market share.

   ï‚·   Profit

                                              Net Profit
                35000

                30000
                                                28610
                25000                                   25258

                20000
                                      17295                                17260
                15000                                             15182
                             13890
                10000                                                              10074

                 5000

                    0
                        Period 0 Period 1 Period 2 Period 3 Period 4 Period 5 period 6


Firm E- Marketing Plan                                                                     5
MARKET IMPACT

   ï‚·   BRAND AWARENESS
        100%

         90%

         80%

         70%

         60%                                                                            Others

         50%                                                                            HiEarners
                                                                                        Pros
         40%
                                                                                        Singles
         30%
                                                                                        Buffs
         20%

         10%

          0%
                 SEMI 3
                 SEMI 0
                 SELF 1
                 SEMI 1

                 SEMI 2


                 SEXY 5


                 SEMI 5
                 SEXY 6


                 SEMI 6
                 SELF 0


                 SELF 2

                  SEBI 3
                 SELF 3


                  SEBI 4
                 SELF 4
                 SEMI4


                  SEBI 5
                 SELF 5


                  SEBI 6
                 SELF 6
                SEM1 4


                SEM1 5


                SEM1 6
                                            SONITE
               Brand awareness is almost same throughout all period. So, in next periods we
       may not purchase this report further and save money.

                          VEET- Brand Awareness by segment

         40.00%           35.10%
         35.00%
         30.00%
         25.00%                              23.60%
                                                                 23.10%
         20.00%
         15.00%                                                                                VEET
         10.00%
           5.00%
           0.00%
                        Innovs                                                   VEET
                                          Adopters
                                                              Followers


                                            VODITE


Firm E- Marketing Plan                                                                  6
ï‚·   PURCHASE INTENTION
        100%
         90%
         80%
         70%
         60%                                                                              Others

         50%                                                                              HiEarners

         40%                                                                              Pros

         30%                                                                              Singles
                                                                                          Buffs
         20%
         10%
          0%
                   SELF 1


                   SEMI 3


                   SEXY 5


                   SEXY 6
                   SELF 0
                   SEMI 0

                   SEMI 1
                   SELF 2
                   SEMI 2
                    SEBI 3
                   SELF 3


                    SEBI 4
                   SELF 4


                    SEBI 5
                   SELF 5
                   SEMI 5


                    SEBI 6
                   SELF 6
                   SEMI 6
                  SEM1 4


                   SEMI4

                  SEM1 5


                  SEM1 6
                                             SONITE
               Purchase intention is really fluctuating a lot with period. We can clearly see
       that Buffs and professionals are the major target market segment for our firm E.

                                   VEET- Purchase intentions

         10.00%
                           8.20%
          8.00%
                                              6.40%
          6.00%

          4.00%                                                                                  VEET

          2.00%                                                    1.70%

          0.00%
                         Innovs                                                    VEET
                                           Adopters
                                                               Followers


                                             VODITE


Firm E- Marketing Plan                                                                    7
ï‚·   SHOPPING HABITS

         120.00%


         100.00%


          80.00%


          60.00%
                                                                                                                                                                                                                                                                       Mass Merchandis.
          40.00%                                                                                                                                                                                                                                                       Depart. stores
                                                                                                                                                                                                                                                                       Specialty stores
          20.00%


           0.00%
                                                Others 0


                                                                                                                    Others 2


                                                                                                                                                                                        Others 4


                                                                                                                                                                                                                                                            Others 6
                                                           Singles 1


                                                                                                                               Singles 3


                                                                                                                                                                                                   Singles 5
                    Buffs 0


                                                                       High earners 1
                                                                                        Buffs 2


                                                                                                                                           High earners 3
                                                                                                                                                            Buffs 4


                                                                                                                                                                                                               High earners 5
                                                                                                                                                                                                                                Buffs 6
                              Professionals 0


                                                                                                  Professionals 2


                                                                                                                                                                      Professionals 4


                                                                                                                                                                                                                                          Professionals 6
                                                                                                                               SONITE
              Purchase intention is also fluctuating a lot with period. We will be requiring
       this report in all period as it help a lot in distributing our inventory according to
       requirement of the customers.

           80.00%                        73.70%

           70.00%

           60.00%                                                  56.40%

            50.00%

            40.00%                                                                                                                                                                                             38.20%                                                  Innovators
                                                                                                                                       35.50%
            30.00%                                                             26.40%                                                                                                                                                                                  Early Adopters
                                                                                                                         24.50%
            20.00%                                                                                  16.80%                                                                                                                                                             Followers
                                                                                                                                                                                               19.10%
            10.00%                                                                                                                                                                9.50%

             0.00%

                              Specialty stores
                                                                                                  Depart. stores
                                                                                                                                                                                 Mass
                                                                                                                                                                               Merchandis.

                                                                                                                               VODITE


Firm E- Marketing Plan                                                                                                                                                                                                                                                        8
MARKETING INVESTMENT

   ï‚·   Sonite - Market Investment


                                                                      Marketing Expenditure(A+AR+SF)

                                                                      Product Investment(MR+R&D)
       17100
       16100                                                                             16246
       15100                                                                                              15312
       14100
       13100
       12100                                                               12466
       11100
       10100
        9100
        8100                                                8148
        7100
        6100                      5831         5994
        5100         5224
        4100
        3100
        2100                                                               2539
        1100                                                1242
         100          245         442          604                                       457              475
                Period 0    Period 1     Period 2     Period 3       Period 4      Period 5      Period 6


   ï‚·   Vodite - Market Investment

                                                                 Marketing Expenditure(A+AR+SF)
                                                                 Product Investment(MR+R&D)
        13000
        12000
                                                                          11534
        11000
        10000
         9000
         8000
         7000
         6000                                                                          6105
         5000
         4000                                                                                        3947
         3000
         2000
         1000
            0         0           21
                                  0            21
                                               0            32
                                                            0             0             35           444
                Period 0    Period 1     Period 2     Period 3      Period 4      Period 5     Period 6

                                                                       A=Advertising Expenditure
                                                         AR=Advertising Research Expenditure
                                                                       SF=Sales Force Expenditure
                                                          MR=Marketing Research expenditure
                                                                           R&D=R&D Expenditure


Firm E- Marketing Plan                                                                               9
ï‚·   Price and Expenditure trend (Brand wise)


                                     SELF - Price & Exp. Trend
        3500
        3000                                                               3128       Average retail price
        2500                  2488    2483     2548
                                                                                      Average selling price
        2000        2112                                 1989
        1500                                                                       Adv+Sale Force Exp.
                                                                  1151
        1000
         500        546       446     494      493       493      491      490
                    348       285     318      319       317      318      318
           0
               Period 0 Period 1 Period 2 Period 3 Period 4 Period 5 Period 6


                SEMI - Price & Exp Trend
        4500
        4000                                                                        Average retail price
                           3343                3761      3807     3854
        3500                          3511
                                                                           3351
        3000      3112                                                              Average selling price
        2500
        2000
                                                                                  Adv+Sale Force Exp.
        1500
        1000                         513
                       513                    513         444   394
         500     514                                                     395
                   332     331        331      332
           0                                             284     253     251
               Period 0 Period 1 Period 2 Period 3 Period 4 Period 5 Period 6


Firm E- Marketing Plan                                                                          10
SEBI Price & Exp. Trend
      3500

      3000                                      2909
      2500
                                                                         Average retail price
      2000                                                      1907
                   1840          1874
      1500                                                               Average selling price

      1000
                                                                       Adv+Sale Force Exp.
       500

         0
             Period 3      Period 4      Period 5       Period 6


                           SEMI1 Price & Exp. Trend
     6000

     5000                                4850
                    4795
     4000
                                                             3447           Average retail price
     3000
                                                                            Average selling price
     2000                                                                Adv+Sale Force Exp.

     1000        541
                                        384               270
        0        346                                       173
                                     245
              Period 4           Period 5              Period 6


Firm E- Marketing Plan                                                                              11
SEXY Price & Exp. Trend
        4000

        3500

        3000

        2500
                                                              Average retail price
        2000
                                                              Average selling price
        1500                                                Adv+Sale Force Exp.
        1000

         500

           0
                   Period 5            Period 6


                              Adv. includes advertising & advertising research expenditure.


Firm E- Marketing Plan                                                                  12
B) Explain your company's SPI to your shareholders


                               Period
                                  0     Period 1   Period 2   Period 3      Period 4    Period 5     Period 6
Stock Price                     1000     1061       1224       1137           721         970          938
Budget avl. at end              7150     7300       11450      10100         7900        8200         8500


 14000
                               11450
 12000

 10000                                  10100              8200
             7150
  8000                                                               8500
                        7300                       7900
                                                                                       Budget avl. at end
  6000                                                                                 Stock Price

  4000

  2000        1000              1224
                      1061               1137      721     970        938
      0
            Period 0 Period 1 Period 2 Period 3 Period 4 Period 5 Period 6


   1. We would like to thank all our shareholders for keeping faith in our company at the
          time when company was not performing as per expectations.
   2. Currently the cash position of the company is good and we don’t have much deficits
          though our profits have come down.
   3. We want to give you assurance that company has taken some strategic decisions that
          will help to improve the company performance.
   4. We will discontinue our loss making brands and will focus on our strength (SEMI).

   5. We are also going to change our marketing strategy for Vodite market.


Firm E- Marketing Plan                                                                                  13
C) You are now leaving the company. What is your advice to the new team taking over
your company? (SWOT and learning’s from success and mistakes)

Strengths

   ï‚·   Our R&D department has continued to improve. We have built such a solid
       foundation that our new brand introductions and modifications have done extremely
       well upon entry into the market. We are confident that our R&D group has gained
       adequate experience to successfully guide us into a new market in the near future.
   ï‚·   Our Brand awareness continues to increase, as we devote ample amounts of capital to
       our advertising.

Weaknesses

   ï‚·   Throughout our management, we have had difficulty predicting the initial production
       levels of our new brands, as well as those of some of our declining brands. We must
       request productions levels more efficiently in order to meet sales requirements and
       minimize inventory holding costs.
   ï‚·   The changing preferences of the consumers continue to challenge our firm. We are
       forced to continually monitor and adjust the Perceptual Objectives to reposition our
       brands in an attempt to gain additional market share.
   ï‚·   We would like to expand into the Vodite market. However, we do not have the
       necessary capital to proceed at this time. We must substantially increase our revenues
       in the next period in order to enter this new market and still remain competitive in the
       Sonite market.

Opportunities

   ï‚·   We have now gained extensive market experience. This has afforded us the
       opportunity to successfully reposition our brands at poorly targeted segments. As we
       continue to draw on this advantage, we will achieve a greater market share and higher
       revenues.
   ï‚·   In Period 6, we completed a project Feasibility Study for the Vodite market. If our
       revenues remain stable in the coming periods, we will have the opportunity to
       complete this R&D project and introduce a brand into the untapped Vodite market.


Firm E- Marketing Plan                                                                      14
ï‚·   We are able to purchase additional Vodite market studies to better position our brands
       according to the preferences of our targeted markets. This will provide us with
       opportunities to further increase our market share.

Threats

   ï‚·   Our brand positioning is frequently threatened by the unstable Purchase Intentions of
       consumers in the Sonite Market. No apparent trends have been identified to date.
   ï‚·   Competition in the Sonite market remains constant and the ability of our competitors
       to better project some Ideal Values remains a constant threat to our market share.
   ï‚·   Three of the five segments that our firm is targeting are declining in size. In addition,
       the growth rates are projected to decrease in all segments but one. This threat requires
       us to operate under more scrutinized production levels.


Firm E- Marketing Plan                                                                       15
Past Performance Learning’s

   ï‚·   Since Period 5, our low-end brand, SEMI, has performed way above our expectations.
       It has been our most successful brand throughout our management. Sales have
       increased by as much as 164%. We have now begun to better estimate adequate
       production levels for this successful brand.
   ï‚·   Our most successful brand is SEMI. Since Period 5, this brand has grown as much as
       164%. We recently made modifications to reposition SEMI closer to the shifting
       preferences of the Buffs. Until Period 6, we had expected this brand to continue its
       successful sales pattern. However, it has seen unexpected drops in sales. We attribute
       this drop to the decline of the Professionals base, as well as the current limited growth
       of the Sonite market itself.
   ï‚·   Our SEXY brand has also experienced tremendous sales growth levels. Its primary
       target is the Professionals segment, and since its introduction in Period 5, this brand
       has grown as much as 40%. As sales levels continue to decline for our competitors
       who are targeting the Professionals, we expect our SEXY sales to increase even
       further.
   ï‚·   Our newest brand, SEXY, has made a respectable entrance into the Sonite market.
       Since its introduction in Period 5, it has grown by 40% in period 6 to almost 8,859
       units. At first we kept advertising levels and sale efforts low to determine its
       positioning on the Multidimensional Scaling map. Once it was determined that this
       brand was successfully positioned, we decided to place a greater emphasis on this
       brand. We expect this brand’s sales to continue to grow and provide us with the
       largest unit shares of the Professionals market.
   ï‚·   Since Period 2, we have experienced tremendous drops in sales in our SELF brand
       (from 28,896 to 18,237 units). In response to this, we will modify this brand in Period
       7. We had previously decided to let this brand simply disappear, but now feel that this
       would be a mistake. We believe our new modifications aimed at the Buffs and
       Professionals should return this brand to its previous levels of success.


Firm E- Marketing Plan                                                                       16
D) What were the most important learning’s from your competitors’ success and
mistakes?

These are the learning’s

          1. For taking better decisions analyse the past data for many years rather than
analysing just previous year’s data.

          2. Make the projections for 2-3 years in future. Rather than making strategy for just 1
year. This helps in refining the mistakes for coming years and help making long term profits
and sustainable growth.

          3. The available resources like funds should be used in an optimal way. This reduces
the cost and increases profit. For e.g. If we see the estimated overall performance of all the
teams Team A as an exceptional cost of $630. Had this not been occurred the profit would
have increased by $630.

          4. First see the need of an expense. Then think about the outcome of that expense. If
the outcome covers that expense only then expense should be made. Or the other way is if we
see the long term growth and profits by spending today, only then it should be made.
Otherwise we should avoid the unnecessary expenses. For e.g. If we compare Period 3 and
period 6 the sales revenue are almost same. But the advertising expenses are more than
double.

          5. Innovation is the key to stay in the top. Keep innovating if you want to keep your
market share and profits higher than the others. For e.g. In period 4 SEMI’s market share was
lowest @ 2.2 % this was due to Team U’s better and innovative market strategy for brand
SULI. SULI was at highest @ 21.1% in this period.

          6. To become a market leader we need to stick to point 1 and 2. This means we should
always keep into consideration the long term perspective. Our focus should be more on long
term goals. Long term strategy always leads to sustainable growth and profits in the long run.


Firm E- Marketing Plan                                                                        17
E) Comparison of our brands similar to Sonites or Vodites product market with other
companies

Sonite

         The characteristics of our company’s brands are chosen as unique and match no other
company’s brands. However, there is a similarity with respect to some characteristics with
some other brands such as SONI and SEXY.

         The main drawback regarding the characteristics of our brands with respect to other
brands has been that our newly introduced brands were too similar to our existing brands.
This led to an intra-brand competition within the company, and hence no clear distinction
meant confusion and conflict within our brands. This is to be rectified in the coming years,
with a concise brand distinction and targeting.

Vodite

         As already stated, our company is still in the establishment phase of this market. We
have invested in various Research and Development programmes for product development
and manufacturing in this market. We will soon launch more products in this market based on
the R&D studies we have already invested in and waiting for their results.

         Talking of the similarity, strikingly, no other product can be identified as similar. This
has provided our sole brand in this market, called VEET, a competitive edge. This brand has
a premium pricing @ 3100, which is marginally above any other brand. Optimistically, this
brand has been able to fetch high revenues for its unique features and the given premium
pricing.


Firm E- Marketing Plan                                                                         18

More Related Content

What's hot

Markstrat Simulation Game - using Segmentation, Targeting, and Positioning
Markstrat Simulation Game - using Segmentation, Targeting, and PositioningMarkstrat Simulation Game - using Segmentation, Targeting, and Positioning
Markstrat Simulation Game - using Segmentation, Targeting, and Positioning
Sharanya Ray
 
MARKSTRAT Business Simulation Presentation
MARKSTRAT Business Simulation PresentationMARKSTRAT Business Simulation Presentation
MARKSTRAT Business Simulation Presentation
caamch2
 
Markstrat 2015 - Team Kamikaze
Markstrat 2015 - Team Kamikaze Markstrat 2015 - Team Kamikaze
Markstrat 2015 - Team Kamikaze
Paola Aulisa
 
Marketing Simulation
Marketing SimulationMarketing Simulation
Marketing Simulation
jaikishan_nitdgp
 
Final Markstrat Marketing Plan
Final Markstrat Marketing PlanFinal Markstrat Marketing Plan
Final Markstrat Marketing Plan
Allison Stokes
 
The Birth of the Swatch - HBR Case Study
The Birth of the Swatch - HBR Case Study The Birth of the Swatch - HBR Case Study
The Birth of the Swatch - HBR Case Study
Raffy Karamanian
 
Team I - Markstrat Final Presentation at UC Davis
Team I - Markstrat Final Presentation at UC DavisTeam I - Markstrat Final Presentation at UC Davis
Team I - Markstrat Final Presentation at UC Davis
bkfirebird
 
Markstrat Presentation
Markstrat PresentationMarkstrat Presentation
Markstrat Presentation
Muthuraman Jayaraman
 
Gino Sa - Harvard Case Study
Gino Sa - Harvard Case StudyGino Sa - Harvard Case Study
Gino Sa - Harvard Case Study
Vaishnavi Ketharnathan
 
MKT 440: Markstrat Presentation
MKT 440: Markstrat PresentationMKT 440: Markstrat Presentation
MKT 440: Markstrat Presentation
Alex Sugano
 
CAPSIM-Final-Paper_FINAL
CAPSIM-Final-Paper_FINALCAPSIM-Final-Paper_FINAL
CAPSIM-Final-Paper_FINALPriscilla Gonzalez
 
Arrow electronics case b2 b
Arrow electronics case b2 bArrow electronics case b2 b
Arrow electronics case b2 b
Abhijeet Kumar
 
Flare Case Study - Savvy
Flare Case Study - SavvyFlare Case Study - Savvy
Flare Case Study - Savvy
Pratikshya Mishra
 
Gino sa distribution channel management case study
Gino sa distribution channel management case studyGino sa distribution channel management case study
Gino sa distribution channel management case study
Sameer Mathur
 
Harvard Case Study analysis: P&G
Harvard Case Study analysis: P&GHarvard Case Study analysis: P&G
Harvard Case Study analysis: P&G
Harshit Gupta
 
Samsung global marketing operations
Samsung global marketing operationsSamsung global marketing operations
Samsung global marketing operations
Mithisar Basumatary
 
CAPSIM PRESENTATION-TEAM FERRIS
CAPSIM PRESENTATION-TEAM FERRIS CAPSIM PRESENTATION-TEAM FERRIS
CAPSIM PRESENTATION-TEAM FERRIS Priscilla Gonzalez
 
Black & Decker 1990 Strategy (MBA Case)
Black & Decker 1990 Strategy (MBA Case)Black & Decker 1990 Strategy (MBA Case)
Black & Decker 1990 Strategy (MBA Case)
Seth Sparks
 

What's hot (20)

Markstrat Simulation Game - using Segmentation, Targeting, and Positioning
Markstrat Simulation Game - using Segmentation, Targeting, and PositioningMarkstrat Simulation Game - using Segmentation, Targeting, and Positioning
Markstrat Simulation Game - using Segmentation, Targeting, and Positioning
 
MARKSTRAT Business Simulation Presentation
MARKSTRAT Business Simulation PresentationMARKSTRAT Business Simulation Presentation
MARKSTRAT Business Simulation Presentation
 
Markstrat 2015 - Team Kamikaze
Markstrat 2015 - Team Kamikaze Markstrat 2015 - Team Kamikaze
Markstrat 2015 - Team Kamikaze
 
Markstrat ppt
Markstrat ppt Markstrat ppt
Markstrat ppt
 
Marketing Simulation
Marketing SimulationMarketing Simulation
Marketing Simulation
 
Final Markstrat Marketing Plan
Final Markstrat Marketing PlanFinal Markstrat Marketing Plan
Final Markstrat Marketing Plan
 
MarkStrat Final Presentation
MarkStrat Final PresentationMarkStrat Final Presentation
MarkStrat Final Presentation
 
The Birth of the Swatch - HBR Case Study
The Birth of the Swatch - HBR Case Study The Birth of the Swatch - HBR Case Study
The Birth of the Swatch - HBR Case Study
 
Team I - Markstrat Final Presentation at UC Davis
Team I - Markstrat Final Presentation at UC DavisTeam I - Markstrat Final Presentation at UC Davis
Team I - Markstrat Final Presentation at UC Davis
 
Markstrat Presentation
Markstrat PresentationMarkstrat Presentation
Markstrat Presentation
 
Gino Sa - Harvard Case Study
Gino Sa - Harvard Case StudyGino Sa - Harvard Case Study
Gino Sa - Harvard Case Study
 
MKT 440: Markstrat Presentation
MKT 440: Markstrat PresentationMKT 440: Markstrat Presentation
MKT 440: Markstrat Presentation
 
CAPSIM-Final-Paper_FINAL
CAPSIM-Final-Paper_FINALCAPSIM-Final-Paper_FINAL
CAPSIM-Final-Paper_FINAL
 
Arrow electronics case b2 b
Arrow electronics case b2 bArrow electronics case b2 b
Arrow electronics case b2 b
 
Flare Case Study - Savvy
Flare Case Study - SavvyFlare Case Study - Savvy
Flare Case Study - Savvy
 
Gino sa distribution channel management case study
Gino sa distribution channel management case studyGino sa distribution channel management case study
Gino sa distribution channel management case study
 
Harvard Case Study analysis: P&G
Harvard Case Study analysis: P&GHarvard Case Study analysis: P&G
Harvard Case Study analysis: P&G
 
Samsung global marketing operations
Samsung global marketing operationsSamsung global marketing operations
Samsung global marketing operations
 
CAPSIM PRESENTATION-TEAM FERRIS
CAPSIM PRESENTATION-TEAM FERRIS CAPSIM PRESENTATION-TEAM FERRIS
CAPSIM PRESENTATION-TEAM FERRIS
 
Black & Decker 1990 Strategy (MBA Case)
Black & Decker 1990 Strategy (MBA Case)Black & Decker 1990 Strategy (MBA Case)
Black & Decker 1990 Strategy (MBA Case)
 

Similar to Markstrat Simulation Game

Electrolux Interim Report Q1 2012 Presentation
Electrolux Interim Report Q1 2012 PresentationElectrolux Interim Report Q1 2012 Presentation
Electrolux Interim Report Q1 2012 Presentation
Electrolux Group
 
Pricing for profit
Pricing for profitPricing for profit
Pricing for profitAzure Group
 
Frontline Q3 2012 results presentation
Frontline Q3 2012 results presentationFrontline Q3 2012 results presentation
Frontline Q3 2012 results presentationTradeWindsnews
 
eBay Q2-2007 Earnings Slides
eBay  Q2-2007 Earnings SlideseBay  Q2-2007 Earnings Slides
eBay Q2-2007 Earnings Slides
Phil Wolff
 
Market outlook stoplosstrade 14 th jan 2013
Market outlook stoplosstrade 14 th jan 2013Market outlook stoplosstrade 14 th jan 2013
Market outlook stoplosstrade 14 th jan 2013
jkhbjcapital
 
Comcast 2008 Annual Meeting
Comcast 2008 Annual Meeting Comcast 2008 Annual Meeting
Comcast 2008 Annual Meeting finance8
 
Building a Compensation Plan Part 3: Implementing Your Total Rewards Plan
Building a Compensation Plan Part 3: Implementing Your Total Rewards Plan Building a Compensation Plan Part 3: Implementing Your Total Rewards Plan
Building a Compensation Plan Part 3: Implementing Your Total Rewards Plan
PayScale, Inc.
 
Daily equity-report by epic research 26 feb 2013
Daily equity-report by epic research 26 feb 2013Daily equity-report by epic research 26 feb 2013
Daily equity-report by epic research 26 feb 2013Epic Daily Report
 
Shell Q1 2008 Keyfinancials
Shell Q1 2008 KeyfinancialsShell Q1 2008 Keyfinancials
Shell Q1 2008 Keyfinancials
earningsreport
 
Atc Fahhan(Presentation)
Atc Fahhan(Presentation)Atc Fahhan(Presentation)
Atc Fahhan(Presentation)
Fahhan Ozcelik
 
Atc Fahhan(Presentation)
Atc Fahhan(Presentation)Atc Fahhan(Presentation)
Atc Fahhan(Presentation)
Fahhan Ozcelik
 
Metso Financial Statements Review 2012 presentation
Metso Financial Statements Review 2012 presentation Metso Financial Statements Review 2012 presentation
Metso Financial Statements Review 2012 presentation
Metso Group
 
Markstrat Gorilla Team
Markstrat Gorilla TeamMarkstrat Gorilla Team
Markstrat Gorilla TeamAshish Arya
 
Metso Interim Review January-September 2012 presentation
Metso Interim Review January-September 2012 presentationMetso Interim Review January-September 2012 presentation
Metso Interim Review January-September 2012 presentation
Metso Group
 
Weekly equity-report by epic research 4 march 2013
Weekly equity-report by epic research 4 march 2013Weekly equity-report by epic research 4 march 2013
Weekly equity-report by epic research 4 march 2013Epic Daily Report
 
Financial Modeling Case on FMCG Sector
Financial Modeling Case on FMCG SectorFinancial Modeling Case on FMCG Sector
Financial Modeling Case on FMCG SectorPristine Careers
 
Daily equity-report by epic research 15 april 2013
Daily equity-report by epic research 15 april 2013Daily equity-report by epic research 15 april 2013
Daily equity-report by epic research 15 april 2013Surbhi Jain
 
Fae Nyc May 21 Final
Fae Nyc May 21 FinalFae Nyc May 21 Final
Fae Nyc May 21 Final
Ashok_Abbott
 
Electrolux Interim Report Q3 2012 Presentation
Electrolux Interim Report Q3 2012 Presentation Electrolux Interim Report Q3 2012 Presentation
Electrolux Interim Report Q3 2012 Presentation
Electrolux Group
 
Salix
SalixSalix
SalixJim
 

Similar to Markstrat Simulation Game (20)

Electrolux Interim Report Q1 2012 Presentation
Electrolux Interim Report Q1 2012 PresentationElectrolux Interim Report Q1 2012 Presentation
Electrolux Interim Report Q1 2012 Presentation
 
Pricing for profit
Pricing for profitPricing for profit
Pricing for profit
 
Frontline Q3 2012 results presentation
Frontline Q3 2012 results presentationFrontline Q3 2012 results presentation
Frontline Q3 2012 results presentation
 
eBay Q2-2007 Earnings Slides
eBay  Q2-2007 Earnings SlideseBay  Q2-2007 Earnings Slides
eBay Q2-2007 Earnings Slides
 
Market outlook stoplosstrade 14 th jan 2013
Market outlook stoplosstrade 14 th jan 2013Market outlook stoplosstrade 14 th jan 2013
Market outlook stoplosstrade 14 th jan 2013
 
Comcast 2008 Annual Meeting
Comcast 2008 Annual Meeting Comcast 2008 Annual Meeting
Comcast 2008 Annual Meeting
 
Building a Compensation Plan Part 3: Implementing Your Total Rewards Plan
Building a Compensation Plan Part 3: Implementing Your Total Rewards Plan Building a Compensation Plan Part 3: Implementing Your Total Rewards Plan
Building a Compensation Plan Part 3: Implementing Your Total Rewards Plan
 
Daily equity-report by epic research 26 feb 2013
Daily equity-report by epic research 26 feb 2013Daily equity-report by epic research 26 feb 2013
Daily equity-report by epic research 26 feb 2013
 
Shell Q1 2008 Keyfinancials
Shell Q1 2008 KeyfinancialsShell Q1 2008 Keyfinancials
Shell Q1 2008 Keyfinancials
 
Atc Fahhan(Presentation)
Atc Fahhan(Presentation)Atc Fahhan(Presentation)
Atc Fahhan(Presentation)
 
Atc Fahhan(Presentation)
Atc Fahhan(Presentation)Atc Fahhan(Presentation)
Atc Fahhan(Presentation)
 
Metso Financial Statements Review 2012 presentation
Metso Financial Statements Review 2012 presentation Metso Financial Statements Review 2012 presentation
Metso Financial Statements Review 2012 presentation
 
Markstrat Gorilla Team
Markstrat Gorilla TeamMarkstrat Gorilla Team
Markstrat Gorilla Team
 
Metso Interim Review January-September 2012 presentation
Metso Interim Review January-September 2012 presentationMetso Interim Review January-September 2012 presentation
Metso Interim Review January-September 2012 presentation
 
Weekly equity-report by epic research 4 march 2013
Weekly equity-report by epic research 4 march 2013Weekly equity-report by epic research 4 march 2013
Weekly equity-report by epic research 4 march 2013
 
Financial Modeling Case on FMCG Sector
Financial Modeling Case on FMCG SectorFinancial Modeling Case on FMCG Sector
Financial Modeling Case on FMCG Sector
 
Daily equity-report by epic research 15 april 2013
Daily equity-report by epic research 15 april 2013Daily equity-report by epic research 15 april 2013
Daily equity-report by epic research 15 april 2013
 
Fae Nyc May 21 Final
Fae Nyc May 21 FinalFae Nyc May 21 Final
Fae Nyc May 21 Final
 
Electrolux Interim Report Q3 2012 Presentation
Electrolux Interim Report Q3 2012 Presentation Electrolux Interim Report Q3 2012 Presentation
Electrolux Interim Report Q3 2012 Presentation
 
Salix
SalixSalix
Salix
 

More from Sunny Goyal

Mahindra subhlabh services ltd
Mahindra subhlabh services ltdMahindra subhlabh services ltd
Mahindra subhlabh services ltd
Sunny Goyal
 
Tea Research
Tea ResearchTea Research
Tea ResearchSunny Goyal
 
Café de colombia
Café de colombiaCafé de colombia
Café de colombiaSunny Goyal
 
Information theory
Information theoryInformation theory
Information theory
Sunny Goyal
 
Wipro Transformation
Wipro TransformationWipro Transformation
Wipro TransformationSunny Goyal
 
Case
CaseCase
Case
Sunny Goyal
 
Indian airliness
Indian airlinessIndian airliness
Indian airliness
Sunny Goyal
 
Nokia microsoft alliance
Nokia microsoft allianceNokia microsoft alliance
Nokia microsoft allianceSunny Goyal
 
Res
ResRes

More from Sunny Goyal (10)

Mahindra subhlabh services ltd
Mahindra subhlabh services ltdMahindra subhlabh services ltd
Mahindra subhlabh services ltd
 
Tea Research
Tea ResearchTea Research
Tea Research
 
Café de colombia
Café de colombiaCafé de colombia
Café de colombia
 
Sun Tv
Sun TvSun Tv
Sun Tv
 
Information theory
Information theoryInformation theory
Information theory
 
Wipro Transformation
Wipro TransformationWipro Transformation
Wipro Transformation
 
Case
CaseCase
Case
 
Indian airliness
Indian airlinessIndian airliness
Indian airliness
 
Nokia microsoft alliance
Nokia microsoft allianceNokia microsoft alliance
Nokia microsoft alliance
 
Res
ResRes
Res
 

Recently uploaded

Project File Report BBA 6th semester.pdf
Project File Report BBA 6th semester.pdfProject File Report BBA 6th semester.pdf
Project File Report BBA 6th semester.pdf
RajPriye
 
BeMetals Investor Presentation_June 1, 2024.pdf
BeMetals Investor Presentation_June 1, 2024.pdfBeMetals Investor Presentation_June 1, 2024.pdf
BeMetals Investor Presentation_June 1, 2024.pdf
DerekIwanaka1
 
Agency Managed Advisory Board As a Solution To Career Path Defining Business ...
Agency Managed Advisory Board As a Solution To Career Path Defining Business ...Agency Managed Advisory Board As a Solution To Career Path Defining Business ...
Agency Managed Advisory Board As a Solution To Career Path Defining Business ...
Boris Ziegler
 
FINAL PRESENTATION.pptx12143241324134134
FINAL PRESENTATION.pptx12143241324134134FINAL PRESENTATION.pptx12143241324134134
FINAL PRESENTATION.pptx12143241324134134
LR1709MUSIC
 
Building Your Employer Brand with Social Media
Building Your Employer Brand with Social MediaBuilding Your Employer Brand with Social Media
Building Your Employer Brand with Social Media
LuanWise
 
Enterprise Excellence is Inclusive Excellence.pdf
Enterprise Excellence is Inclusive Excellence.pdfEnterprise Excellence is Inclusive Excellence.pdf
Enterprise Excellence is Inclusive Excellence.pdf
KaiNexus
 
Auditing study material for b.com final year students
Auditing study material for b.com final year  studentsAuditing study material for b.com final year  students
Auditing study material for b.com final year students
narasimhamurthyh4
 
Business Valuation Principles for Entrepreneurs
Business Valuation Principles for EntrepreneursBusiness Valuation Principles for Entrepreneurs
Business Valuation Principles for Entrepreneurs
Ben Wann
 
Maksym Vyshnivetskyi: PMO Quality Management (UA)
Maksym Vyshnivetskyi: PMO Quality Management (UA)Maksym Vyshnivetskyi: PMO Quality Management (UA)
Maksym Vyshnivetskyi: PMO Quality Management (UA)
Lviv Startup Club
 
Company Valuation webinar series - Tuesday, 4 June 2024
Company Valuation webinar series - Tuesday, 4 June 2024Company Valuation webinar series - Tuesday, 4 June 2024
Company Valuation webinar series - Tuesday, 4 June 2024
FelixPerez547899
 
Buy Verified PayPal Account | Buy Google 5 Star Reviews
Buy Verified PayPal Account | Buy Google 5 Star ReviewsBuy Verified PayPal Account | Buy Google 5 Star Reviews
Buy Verified PayPal Account | Buy Google 5 Star Reviews
usawebmarket
 
Exploring Patterns of Connection with Social Dreaming
Exploring Patterns of Connection with Social DreamingExploring Patterns of Connection with Social Dreaming
Exploring Patterns of Connection with Social Dreaming
Nicola Wreford-Howard
 
Brand Analysis for an artist named Struan
Brand Analysis for an artist named StruanBrand Analysis for an artist named Struan
Brand Analysis for an artist named Struan
sarahvanessa51503
 
Evgen Osmak: Methods of key project parameters estimation: from the shaman-in...
Evgen Osmak: Methods of key project parameters estimation: from the shaman-in...Evgen Osmak: Methods of key project parameters estimation: from the shaman-in...
Evgen Osmak: Methods of key project parameters estimation: from the shaman-in...
Lviv Startup Club
 
The effects of customers service quality and online reviews on customer loyal...
The effects of customers service quality and online reviews on customer loyal...The effects of customers service quality and online reviews on customer loyal...
The effects of customers service quality and online reviews on customer loyal...
balatucanapplelovely
 
Premium MEAN Stack Development Solutions for Modern Businesses
Premium MEAN Stack Development Solutions for Modern BusinessesPremium MEAN Stack Development Solutions for Modern Businesses
Premium MEAN Stack Development Solutions for Modern Businesses
SynapseIndia
 
ikea_woodgreen_petscharity_dog-alogue_digital.pdf
ikea_woodgreen_petscharity_dog-alogue_digital.pdfikea_woodgreen_petscharity_dog-alogue_digital.pdf
ikea_woodgreen_petscharity_dog-alogue_digital.pdf
agatadrynko
 
Training my puppy and implementation in this story
Training my puppy and implementation in this storyTraining my puppy and implementation in this story
Training my puppy and implementation in this story
WilliamRodrigues148
 
Sustainability: Balancing the Environment, Equity & Economy
Sustainability: Balancing the Environment, Equity & EconomySustainability: Balancing the Environment, Equity & Economy
Sustainability: Balancing the Environment, Equity & Economy
Operational Excellence Consulting
 
Authentically Social Presented by Corey Perlman
Authentically Social Presented by Corey PerlmanAuthentically Social Presented by Corey Perlman
Authentically Social Presented by Corey Perlman
Corey Perlman, Social Media Speaker and Consultant
 

Recently uploaded (20)

Project File Report BBA 6th semester.pdf
Project File Report BBA 6th semester.pdfProject File Report BBA 6th semester.pdf
Project File Report BBA 6th semester.pdf
 
BeMetals Investor Presentation_June 1, 2024.pdf
BeMetals Investor Presentation_June 1, 2024.pdfBeMetals Investor Presentation_June 1, 2024.pdf
BeMetals Investor Presentation_June 1, 2024.pdf
 
Agency Managed Advisory Board As a Solution To Career Path Defining Business ...
Agency Managed Advisory Board As a Solution To Career Path Defining Business ...Agency Managed Advisory Board As a Solution To Career Path Defining Business ...
Agency Managed Advisory Board As a Solution To Career Path Defining Business ...
 
FINAL PRESENTATION.pptx12143241324134134
FINAL PRESENTATION.pptx12143241324134134FINAL PRESENTATION.pptx12143241324134134
FINAL PRESENTATION.pptx12143241324134134
 
Building Your Employer Brand with Social Media
Building Your Employer Brand with Social MediaBuilding Your Employer Brand with Social Media
Building Your Employer Brand with Social Media
 
Enterprise Excellence is Inclusive Excellence.pdf
Enterprise Excellence is Inclusive Excellence.pdfEnterprise Excellence is Inclusive Excellence.pdf
Enterprise Excellence is Inclusive Excellence.pdf
 
Auditing study material for b.com final year students
Auditing study material for b.com final year  studentsAuditing study material for b.com final year  students
Auditing study material for b.com final year students
 
Business Valuation Principles for Entrepreneurs
Business Valuation Principles for EntrepreneursBusiness Valuation Principles for Entrepreneurs
Business Valuation Principles for Entrepreneurs
 
Maksym Vyshnivetskyi: PMO Quality Management (UA)
Maksym Vyshnivetskyi: PMO Quality Management (UA)Maksym Vyshnivetskyi: PMO Quality Management (UA)
Maksym Vyshnivetskyi: PMO Quality Management (UA)
 
Company Valuation webinar series - Tuesday, 4 June 2024
Company Valuation webinar series - Tuesday, 4 June 2024Company Valuation webinar series - Tuesday, 4 June 2024
Company Valuation webinar series - Tuesday, 4 June 2024
 
Buy Verified PayPal Account | Buy Google 5 Star Reviews
Buy Verified PayPal Account | Buy Google 5 Star ReviewsBuy Verified PayPal Account | Buy Google 5 Star Reviews
Buy Verified PayPal Account | Buy Google 5 Star Reviews
 
Exploring Patterns of Connection with Social Dreaming
Exploring Patterns of Connection with Social DreamingExploring Patterns of Connection with Social Dreaming
Exploring Patterns of Connection with Social Dreaming
 
Brand Analysis for an artist named Struan
Brand Analysis for an artist named StruanBrand Analysis for an artist named Struan
Brand Analysis for an artist named Struan
 
Evgen Osmak: Methods of key project parameters estimation: from the shaman-in...
Evgen Osmak: Methods of key project parameters estimation: from the shaman-in...Evgen Osmak: Methods of key project parameters estimation: from the shaman-in...
Evgen Osmak: Methods of key project parameters estimation: from the shaman-in...
 
The effects of customers service quality and online reviews on customer loyal...
The effects of customers service quality and online reviews on customer loyal...The effects of customers service quality and online reviews on customer loyal...
The effects of customers service quality and online reviews on customer loyal...
 
Premium MEAN Stack Development Solutions for Modern Businesses
Premium MEAN Stack Development Solutions for Modern BusinessesPremium MEAN Stack Development Solutions for Modern Businesses
Premium MEAN Stack Development Solutions for Modern Businesses
 
ikea_woodgreen_petscharity_dog-alogue_digital.pdf
ikea_woodgreen_petscharity_dog-alogue_digital.pdfikea_woodgreen_petscharity_dog-alogue_digital.pdf
ikea_woodgreen_petscharity_dog-alogue_digital.pdf
 
Training my puppy and implementation in this story
Training my puppy and implementation in this storyTraining my puppy and implementation in this story
Training my puppy and implementation in this story
 
Sustainability: Balancing the Environment, Equity & Economy
Sustainability: Balancing the Environment, Equity & EconomySustainability: Balancing the Environment, Equity & Economy
Sustainability: Balancing the Environment, Equity & Economy
 
Authentically Social Presented by Corey Perlman
Authentically Social Presented by Corey PerlmanAuthentically Social Presented by Corey Perlman
Authentically Social Presented by Corey Perlman
 

Markstrat Simulation Game

  • 1. SUBMITTED TO Dr. anita basalingappa January, 2012 Firm E- Marketing Plan 1
  • 2. FINANCIAL IMPACT ï‚· Net contribution 32000 1284 28000 3957 24000 20000 1581 16000 SEXY 27983 2848 25735 SEM1 12000 1355 SEBI 8000 16209 1572 SELF 11287 4000 1,944 SEMI 7313 2239 5,173 0 1,064 -3127 -1205 Period 0 Period 1 Period 2 Period 3 Period 4 Period 5 period 6 -4000 -4,346 -5090 -4,035 -3046 -2,184 -8000 -3,657 -12000 In period 0 aggregate net contribution was $14134.Period 1- It started increasing due to increase in sales revenue. Other expenditures remained slightly high. Period 2- sales revenue reached $69370. This further increased net contribution, expenses remained almost same. Period 3- sales revenue increased slightly but cost of goods sold increased and other expenses also increased. Because of this Net contribution decreased and came to $ 28610.Period 4- Advertising expenditures and ad research exp. Increased but sales revenue decreased drastically. Eventually net contribution decreased drastically and reached to $25258. Period 5- A little increase in sales revenue along with advertising and sales force expenditures resulted in a little increase in net contribution. Period 6- sales revenue, cost of goods sold and other expenditures all decreased which resulted in the level of net contribution to $10074. Firm E- Marketing Plan 2
  • 3. ï‚· ROI ROI 5 4.3 4 3 2.54 2.73 2.67 2 ROI 1 0.75 0.5 0 -0.57 Period Period -1 Period Period 0 1 Period Period 2 3 period 4 5 6 As it is clear from the graph that the trend of ROI is slightly similar to Net contribution. In period 2 the sales revenue was high at $69370. Due to this high sales revenue the ROI is highest in this period (despite Cost of goods sold and other expenses being higher then period 1). After period 2 it started decreasing due to sudden increase in total expenditures. After this another point to notice is Period 4. In this period ROI was negative @ -0.57 which was due to drastic decrease in sales revenue and increase in advertising and research expenses. In period 6 it came to positive @ 0.5. ï‚· Stock price index stock price index 1400 1200 1224 1137 1061 1000 1000 970 938 800 721 600 stock price index 400 200 0 Period Period Period Period Period Period period 0 1 2 3 4 5 6 Firm E- Marketing Plan 3
  • 4. Stock price is highest @ $1224 in period 2. The reasons for this can be many. In period 2 sales revenue increased. Expenses were slightly higher than previous periods. But ROI and Net contribution is highest in period 2, which resulted in highest stock price. The stock price was lowest @ $721 in period 4. This was due to direct relationship between Stock price, Net contribution and ROI. The net contribution and ROI are lowest in this period. This poor performance of company leads to lower stock price. In period 6 stock price came to $938. ï‚· Market Share 100% Market Share 0.60% 1.80% 90% 2.70% 4.40% 5.80% 2.60% 80% 4.50% 3.30% 3.50% 70% 0.80% VEET 60% 1.90% 1.10% SEXY 50% 1.10% 3.20% SEM1 40% 12.50% SEBI 10.60% 10.70% 2.10% 0.70% SELF 30% 10.30% 0.90% SEMI 20% 5.40% 10% 2.20% 4.50% 0% Period 0 Period 1 Period 2 Period 3 Period 4 Period 5 period 6 In period 0 there were two brands SEMI & SELF in Sonite and their market share were 10.6% and 4.4% respectively. Team A’s SAMA brand market share was highest @ 12.2% in this period. In period 1 both brand’s market share increased slightly. But in period 2 SEMI’s market share increased but SELF’s market share started decreasing. In period 3 SEBI was launched. And its market share remained at 1.8%. In period 4 and period 5 SEM1 and SEXY brands were launched respectively. In this period SEMI’s market share was lowest @ 2.2 % this was due to Team U’s better market strategy for brand SULI. SULI was at highest @ 21.1% in this period. SELF and SEBI’s market share remained lowest in period 6. While Firm E- Marketing Plan 4
  • 5. SEM1 started with 2.6% market share in period 4 and came to 3.5% and 3.2% in period 5 & 6 respectively with its better marketing strategy, advertising and R&D. SEXY started with 0.6% market share in period 5 and came to 0.8% in period 6. VODITE’s VEET brand was launched in period 6 with 4.5% market share. ï‚· Profit Net Profit 35000 30000 28610 25000 25258 20000 17295 17260 15000 15182 13890 10000 10074 5000 0 Period 0 Period 1 Period 2 Period 3 Period 4 Period 5 period 6 Firm E- Marketing Plan 5
  • 6. MARKET IMPACT ï‚· BRAND AWARENESS 100% 90% 80% 70% 60% Others 50% HiEarners Pros 40% Singles 30% Buffs 20% 10% 0% SEMI 3 SEMI 0 SELF 1 SEMI 1 SEMI 2 SEXY 5 SEMI 5 SEXY 6 SEMI 6 SELF 0 SELF 2 SEBI 3 SELF 3 SEBI 4 SELF 4 SEMI4 SEBI 5 SELF 5 SEBI 6 SELF 6 SEM1 4 SEM1 5 SEM1 6 SONITE Brand awareness is almost same throughout all period. So, in next periods we may not purchase this report further and save money. VEET- Brand Awareness by segment 40.00% 35.10% 35.00% 30.00% 25.00% 23.60% 23.10% 20.00% 15.00% VEET 10.00% 5.00% 0.00% Innovs VEET Adopters Followers VODITE Firm E- Marketing Plan 6
  • 7. ï‚· PURCHASE INTENTION 100% 90% 80% 70% 60% Others 50% HiEarners 40% Pros 30% Singles Buffs 20% 10% 0% SELF 1 SEMI 3 SEXY 5 SEXY 6 SELF 0 SEMI 0 SEMI 1 SELF 2 SEMI 2 SEBI 3 SELF 3 SEBI 4 SELF 4 SEBI 5 SELF 5 SEMI 5 SEBI 6 SELF 6 SEMI 6 SEM1 4 SEMI4 SEM1 5 SEM1 6 SONITE Purchase intention is really fluctuating a lot with period. We can clearly see that Buffs and professionals are the major target market segment for our firm E. VEET- Purchase intentions 10.00% 8.20% 8.00% 6.40% 6.00% 4.00% VEET 2.00% 1.70% 0.00% Innovs VEET Adopters Followers VODITE Firm E- Marketing Plan 7
  • 8. ï‚· SHOPPING HABITS 120.00% 100.00% 80.00% 60.00% Mass Merchandis. 40.00% Depart. stores Specialty stores 20.00% 0.00% Others 0 Others 2 Others 4 Others 6 Singles 1 Singles 3 Singles 5 Buffs 0 High earners 1 Buffs 2 High earners 3 Buffs 4 High earners 5 Buffs 6 Professionals 0 Professionals 2 Professionals 4 Professionals 6 SONITE Purchase intention is also fluctuating a lot with period. We will be requiring this report in all period as it help a lot in distributing our inventory according to requirement of the customers. 80.00% 73.70% 70.00% 60.00% 56.40% 50.00% 40.00% 38.20% Innovators 35.50% 30.00% 26.40% Early Adopters 24.50% 20.00% 16.80% Followers 19.10% 10.00% 9.50% 0.00% Specialty stores Depart. stores Mass Merchandis. VODITE Firm E- Marketing Plan 8
  • 9. MARKETING INVESTMENT ï‚· Sonite - Market Investment Marketing Expenditure(A+AR+SF) Product Investment(MR+R&D) 17100 16100 16246 15100 15312 14100 13100 12100 12466 11100 10100 9100 8100 8148 7100 6100 5831 5994 5100 5224 4100 3100 2100 2539 1100 1242 100 245 442 604 457 475 Period 0 Period 1 Period 2 Period 3 Period 4 Period 5 Period 6 ï‚· Vodite - Market Investment Marketing Expenditure(A+AR+SF) Product Investment(MR+R&D) 13000 12000 11534 11000 10000 9000 8000 7000 6000 6105 5000 4000 3947 3000 2000 1000 0 0 21 0 21 0 32 0 0 35 444 Period 0 Period 1 Period 2 Period 3 Period 4 Period 5 Period 6 A=Advertising Expenditure AR=Advertising Research Expenditure SF=Sales Force Expenditure MR=Marketing Research expenditure R&D=R&D Expenditure Firm E- Marketing Plan 9
  • 10. ï‚· Price and Expenditure trend (Brand wise) SELF - Price & Exp. Trend 3500 3000 3128 Average retail price 2500 2488 2483 2548 Average selling price 2000 2112 1989 1500 Adv+Sale Force Exp. 1151 1000 500 546 446 494 493 493 491 490 348 285 318 319 317 318 318 0 Period 0 Period 1 Period 2 Period 3 Period 4 Period 5 Period 6 SEMI - Price & Exp Trend 4500 4000 Average retail price 3343 3761 3807 3854 3500 3511 3351 3000 3112 Average selling price 2500 2000 Adv+Sale Force Exp. 1500 1000 513 513 513 444 394 500 514 395 332 331 331 332 0 284 253 251 Period 0 Period 1 Period 2 Period 3 Period 4 Period 5 Period 6 Firm E- Marketing Plan 10
  • 11. SEBI Price & Exp. Trend 3500 3000 2909 2500 Average retail price 2000 1907 1840 1874 1500 Average selling price 1000 Adv+Sale Force Exp. 500 0 Period 3 Period 4 Period 5 Period 6 SEMI1 Price & Exp. Trend 6000 5000 4850 4795 4000 3447 Average retail price 3000 Average selling price 2000 Adv+Sale Force Exp. 1000 541 384 270 0 346 173 245 Period 4 Period 5 Period 6 Firm E- Marketing Plan 11
  • 12. SEXY Price & Exp. Trend 4000 3500 3000 2500 Average retail price 2000 Average selling price 1500 Adv+Sale Force Exp. 1000 500 0 Period 5 Period 6 Adv. includes advertising & advertising research expenditure. Firm E- Marketing Plan 12
  • 13. B) Explain your company's SPI to your shareholders Period 0 Period 1 Period 2 Period 3 Period 4 Period 5 Period 6 Stock Price 1000 1061 1224 1137 721 970 938 Budget avl. at end 7150 7300 11450 10100 7900 8200 8500 14000 11450 12000 10000 10100 8200 7150 8000 8500 7300 7900 Budget avl. at end 6000 Stock Price 4000 2000 1000 1224 1061 1137 721 970 938 0 Period 0 Period 1 Period 2 Period 3 Period 4 Period 5 Period 6 1. We would like to thank all our shareholders for keeping faith in our company at the time when company was not performing as per expectations. 2. Currently the cash position of the company is good and we don’t have much deficits though our profits have come down. 3. We want to give you assurance that company has taken some strategic decisions that will help to improve the company performance. 4. We will discontinue our loss making brands and will focus on our strength (SEMI). 5. We are also going to change our marketing strategy for Vodite market. Firm E- Marketing Plan 13
  • 14. C) You are now leaving the company. What is your advice to the new team taking over your company? (SWOT and learning’s from success and mistakes) Strengths ï‚· Our R&D department has continued to improve. We have built such a solid foundation that our new brand introductions and modifications have done extremely well upon entry into the market. We are confident that our R&D group has gained adequate experience to successfully guide us into a new market in the near future. ï‚· Our Brand awareness continues to increase, as we devote ample amounts of capital to our advertising. Weaknesses ï‚· Throughout our management, we have had difficulty predicting the initial production levels of our new brands, as well as those of some of our declining brands. We must request productions levels more efficiently in order to meet sales requirements and minimize inventory holding costs. ï‚· The changing preferences of the consumers continue to challenge our firm. We are forced to continually monitor and adjust the Perceptual Objectives to reposition our brands in an attempt to gain additional market share. ï‚· We would like to expand into the Vodite market. However, we do not have the necessary capital to proceed at this time. We must substantially increase our revenues in the next period in order to enter this new market and still remain competitive in the Sonite market. Opportunities ï‚· We have now gained extensive market experience. This has afforded us the opportunity to successfully reposition our brands at poorly targeted segments. As we continue to draw on this advantage, we will achieve a greater market share and higher revenues. ï‚· In Period 6, we completed a project Feasibility Study for the Vodite market. If our revenues remain stable in the coming periods, we will have the opportunity to complete this R&D project and introduce a brand into the untapped Vodite market. Firm E- Marketing Plan 14
  • 15. ï‚· We are able to purchase additional Vodite market studies to better position our brands according to the preferences of our targeted markets. This will provide us with opportunities to further increase our market share. Threats ï‚· Our brand positioning is frequently threatened by the unstable Purchase Intentions of consumers in the Sonite Market. No apparent trends have been identified to date. ï‚· Competition in the Sonite market remains constant and the ability of our competitors to better project some Ideal Values remains a constant threat to our market share. ï‚· Three of the five segments that our firm is targeting are declining in size. In addition, the growth rates are projected to decrease in all segments but one. This threat requires us to operate under more scrutinized production levels. Firm E- Marketing Plan 15
  • 16. Past Performance Learning’s ï‚· Since Period 5, our low-end brand, SEMI, has performed way above our expectations. It has been our most successful brand throughout our management. Sales have increased by as much as 164%. We have now begun to better estimate adequate production levels for this successful brand. ï‚· Our most successful brand is SEMI. Since Period 5, this brand has grown as much as 164%. We recently made modifications to reposition SEMI closer to the shifting preferences of the Buffs. Until Period 6, we had expected this brand to continue its successful sales pattern. However, it has seen unexpected drops in sales. We attribute this drop to the decline of the Professionals base, as well as the current limited growth of the Sonite market itself. ï‚· Our SEXY brand has also experienced tremendous sales growth levels. Its primary target is the Professionals segment, and since its introduction in Period 5, this brand has grown as much as 40%. As sales levels continue to decline for our competitors who are targeting the Professionals, we expect our SEXY sales to increase even further. ï‚· Our newest brand, SEXY, has made a respectable entrance into the Sonite market. Since its introduction in Period 5, it has grown by 40% in period 6 to almost 8,859 units. At first we kept advertising levels and sale efforts low to determine its positioning on the Multidimensional Scaling map. Once it was determined that this brand was successfully positioned, we decided to place a greater emphasis on this brand. We expect this brand’s sales to continue to grow and provide us with the largest unit shares of the Professionals market. ï‚· Since Period 2, we have experienced tremendous drops in sales in our SELF brand (from 28,896 to 18,237 units). In response to this, we will modify this brand in Period 7. We had previously decided to let this brand simply disappear, but now feel that this would be a mistake. We believe our new modifications aimed at the Buffs and Professionals should return this brand to its previous levels of success. Firm E- Marketing Plan 16
  • 17. D) What were the most important learning’s from your competitors’ success and mistakes? These are the learning’s 1. For taking better decisions analyse the past data for many years rather than analysing just previous year’s data. 2. Make the projections for 2-3 years in future. Rather than making strategy for just 1 year. This helps in refining the mistakes for coming years and help making long term profits and sustainable growth. 3. The available resources like funds should be used in an optimal way. This reduces the cost and increases profit. For e.g. If we see the estimated overall performance of all the teams Team A as an exceptional cost of $630. Had this not been occurred the profit would have increased by $630. 4. First see the need of an expense. Then think about the outcome of that expense. If the outcome covers that expense only then expense should be made. Or the other way is if we see the long term growth and profits by spending today, only then it should be made. Otherwise we should avoid the unnecessary expenses. For e.g. If we compare Period 3 and period 6 the sales revenue are almost same. But the advertising expenses are more than double. 5. Innovation is the key to stay in the top. Keep innovating if you want to keep your market share and profits higher than the others. For e.g. In period 4 SEMI’s market share was lowest @ 2.2 % this was due to Team U’s better and innovative market strategy for brand SULI. SULI was at highest @ 21.1% in this period. 6. To become a market leader we need to stick to point 1 and 2. This means we should always keep into consideration the long term perspective. Our focus should be more on long term goals. Long term strategy always leads to sustainable growth and profits in the long run. Firm E- Marketing Plan 17
  • 18. E) Comparison of our brands similar to Sonites or Vodites product market with other companies Sonite The characteristics of our company’s brands are chosen as unique and match no other company’s brands. However, there is a similarity with respect to some characteristics with some other brands such as SONI and SEXY. The main drawback regarding the characteristics of our brands with respect to other brands has been that our newly introduced brands were too similar to our existing brands. This led to an intra-brand competition within the company, and hence no clear distinction meant confusion and conflict within our brands. This is to be rectified in the coming years, with a concise brand distinction and targeting. Vodite As already stated, our company is still in the establishment phase of this market. We have invested in various Research and Development programmes for product development and manufacturing in this market. We will soon launch more products in this market based on the R&D studies we have already invested in and waiting for their results. Talking of the similarity, strikingly, no other product can be identified as similar. This has provided our sole brand in this market, called VEET, a competitive edge. This brand has a premium pricing @ 3100, which is marginally above any other brand. Optimistically, this brand has been able to fetch high revenues for its unique features and the given premium pricing. Firm E- Marketing Plan 18